ITERATE
IT for Error Remediation And Trapping Emergencies
Results from the analysis and input to the
develop-ment and validation of the statistical models
Deliverable No. D5.1
Workpackage No. WP5
Workpackage Title Extraction of model relations from experimental data
Editor Andreas Tapani (andreas.tapani@vti.se)
Authors Åsa Forsman, Anna Vadeby, Mohammad-Reza Yahya and
Andreas Tapani (VTI), Simon Enjalbert (UNIVAL), Mirella Cas-sani, Aladino Amantini (KITE), Frank Lai (LEEDS), Lena Keck-lund and Marcus Arvidsson (MTO)
Status (F: Final; ECS: EC Submission; RC:
Review Copy: D: draft): Second revised EC submission Reviewed and approved for submission Björn Peters (VTI), 2011/11/24
EUROPEAN COMMISSION DG RESEARCH
A FP7 Collaborative Project Work programme: Sustainable Surface Transport SST.2007.4.1.2: Human physical and behavioural components
The ITERATE project
This report is produced within the European project ITERATE (IT for Error Remediation And Trapping Emergencies), Grant agreement number 218496. The project started the 1st of January 2009 and will end 31st of December 2011.
The objective of ITERATE is to develop and validate a unified model of driver behaviour (UMD) and driver interaction with innovative technologies in emergency situations. This model will be applicable to and validated for all the surface transport modes. Drivers’ age, gender, education and experience and culture (whether regional or company/organisational) are factors that will be considered togeth-er with influences from the environment and the vehicle.
Such a unified model of driver behaviour will be of great use when designing innovative technologies since it will allow for assessment and tuning of the systems in a safe and controllable environment without actually putting them to use in real traffic. At the concept stage, the model could guide de-signers in identifying potential problem areas whilst at the prototype stage, the model could inform on the scenarios to be used in system evaluation. In this way the systems will be better adapted to the drivers before being available on the market and will provide better support to the driver in emergency situations. Along the same lines, the model could be of use for authorities as a guide in assessing and approving innovative technologies without performing extensive simulator experi-ments or large scale field trials.
ITERATE is based on the assumption that the underlying factors influencing human behaviour such as age, gender, culture etc. are constant between transport modes. This assumption allows for a unified model of driver behaviour, applicable to all surface transport modes, to be developed. This will be done within ITERATE and the model can be used to improve design and safety assessment of innova-tive technologies and make it possible to adapt these technologies to the abilities, needs, driving style and capacity of the individual driver. The model will also provide a useful tool for authorities to assess ITS which is missing today.
The project consortium consists of seven partners:
Statens väg och Transportforskningsinstitut (VTI) Sweden; University of Leeds (UNIVLEEDS) UK; Uni-versity of Valenciennes (UNIVAL) France; Kite Solutions s.n.c. (Kite) Italy; Ben Gurion UniUni-versity (BGU) Israel; Chalmers University (Chalmers) Sweden; MTO Psykologi (MTOP) Sweden
For more information regarding the project please see http://www.iterate-project.eu/
I hope you will enjoy this and all other deliverables produced within the ITERATE project. If you seek more information or have questions don’t hesitate to contact me.
Björn Peters, VTI Project coordinator
e-mail: Bjorn.Peters@vti.se tel: +46 13 20 40 00
List of abbreviations used in the deliverable
Acronym Explanation
ATP Automatic Train Protection Systems BSSS Brief Sensation Seeking Scale DAQ Driving Attitude Questionnaire DBQ Driver Behaviour Questionnaire
ERTMS European Rail Traffic Management System ETCS European Train Control System
FCW Forward Collision Warning ISA Intelligent Speed Adaptation
ITERATE IT for Error Remediation And Trapping Emergencies KSS Karolinska Sleepiness Scale
SPSS Statistical Package for the Social Science SS Sensation Seeking
SSS Sensation Seeking Scale
TDBQ Train Driver Behaviour Questionnaire TTC Time To Collision
Table of Contents
1. Introduction ... 1
2. The ITERATE dataset ... 2
2.1 Car and train driving simulator experiments ... 2
2.2 Contents of the ITERATE dataset ... 5
3. Method ... 7
3.1 Overview ... 7
3.2 Pre-processing of operator data ... 7
3.2.1 Simulator data... 7
3.2.2 Operator data ... 12
3.2.3 Hypotheses of the car experiment ... 14
3.2.4 Hypotheses of the train experiment ... 15
3.3 Statistical analysis ... 15
3.4 Validation against full motion simulators ... 16
3.5 Exploratory data analysis ... 16
3.6 Derivation of correlation relationships ... 17
4. Participants’ background data ... 20
4.1 Car drivers ... 20 4.1.1 Experience ... 20 4.1.2 Sensation seeking ... 22 4.1.3 Driver state ... 23 4.2 Train operators ... 25 4.2.1 Experience ... 26 4.2.2 Sensation seeking ... 27 4.2.3 Driver state ... 28
5. Hypothesis testing results - car drivers ... 30
5.1 Hypothesis testing results ... 30
5.1.1 ISA – mean speed during normal driving ... 30
5.1.2 ISA – speed through curves ... 32
5.1.3 ISA – speed at village ... 36
5.1.4 ISA – speed at school ... 41
5.1.5 FCW – reaction type of event ... 42
5.1.6 FCW – car following ... 43
5.2 Validation against full motion car simulator ... 46
5.2.1 ISA – speed through curves ... 47
5.2.2 ISA – speed at village ... 48
5.2.3 ISA – speed at school ... 49
6. Hypothesis testing results - train operators ... 51
6.1 Hypothesis testing results ... 51
6.2 Validation against full scale train simulator ... 64
7. Exploratory data analysis ... 72
7.1 Cluster analysis of the questionnaire data from the car driving experiment ... 72
7.1.1 Grouping participants by statistical central tendency measures ... 72
7.1.2 Grouping participants by homogeneous clusters ... 73
7.2 Explorative analyses of the questionnaire data from the train driving experiment ... 76
7.2.1 Introduction ... 76
7.2.2 Descriptive analyses of the data set and identification of subgroups ... 76
8. Derivation of correlation relationships ... 82
8.1 Car driver correlations ... 82
8.1.1 Intended speed ... 82
8.1.2 Intended Distance ... 83
8.1.3 Gas and brake rate ... 83
8.2 Train driver correlations ... 84
9. Discussion ... 85
9.1 Participants’ background data ... 85
9.2 Hypothesis testing, comparison between train and car ... 85
9.2.1 Car ... 85
9.2.2 Train ... 86
9.2.3 Car vs. train ... 87
9.3 Implications of the cluster analysis ... 87
10. Conclusions ... 88
List of Tables
Table 1 Events in the train scenario ... 10
Table 2 Events of different type and in different workload condition in the train scenario ... 11
Table 3 Situations and hypotheses during the drive on the rural road with ISA system ... 14
Table 4: Situations and hypotheses during the drive on the motorway with FCW system ... 14
Table 5 Hypothesis from D3.1 ... 15
Table 6 Modified hypotheses for the train driving experiment ... 15
Table 7 Driver parameters value ... 18
Table 8 Number of participants in the car driving simulator experiment... 20
Table 9 Descriptive statistics - Age of the participants in the car driving simulator experiment ... 20
Table 10 Descriptive statistics – Number of years holding a driving license for the participants in the car driving simulator experiment ... 21
Table 11 Descriptive statistics - Number of km driven last year ... 21
Table 12 Analysis of variance P values – average sensation seeking score ... 22
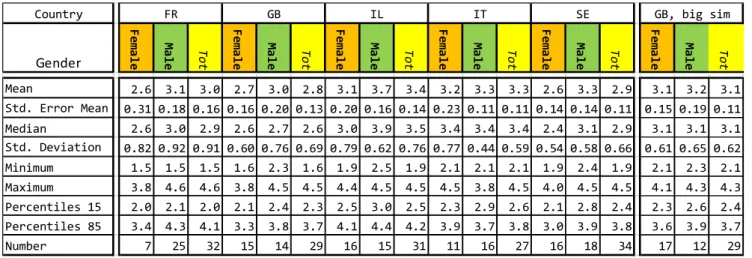
Table 13 Descriptive statistics – Sensation seeking score for the participants in the car driving experiment ... 23
Table 14 Analysis of variance P values – KSS score before and after the simulator drive ... 24
Table 15 Descriptive statistics – KSS scores before and after the experiment for the participants in the car driving experiment ... 25
Table 16 Number of participants in the train driving simulator experiment ... 25
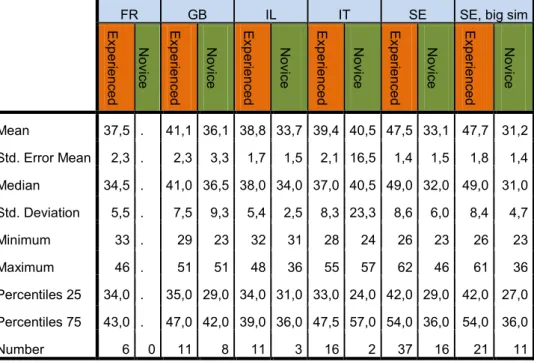
Table 17 Descriptive statistics - Age of the participants in the train driving simulator experiment... 26
Table 18 Descriptive statistics – Number of years holding a driving license for the participants in the train driving simulator experiment ... 26
Table 19 Analysis of variance P values – average sensation seeking score ... 27
Table 20 Descriptive statistics – Sensation seeking score for the participants in the train driving experiment ... 28
Table 21 Analysis of variance P values – KSS score before and after the simulator drive ... 29
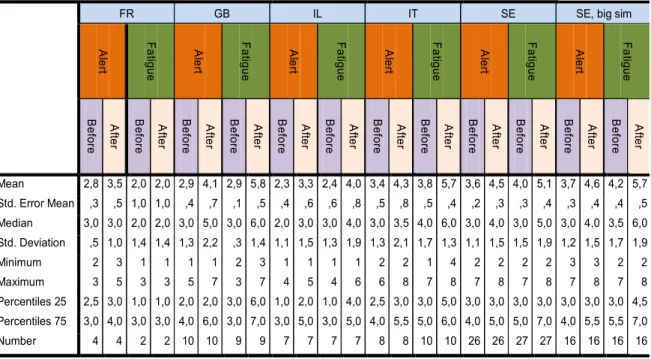
Table 22 Descriptive statistics – KSS scores before and after the experiment for the participants in the train driving experiment ... 29
Table 23 Analysis of variance - P values. Mean speed during normal driving ... 30
Table 24 Analysis of variance – adjusted mean values, mean speed during normal driving ... 30
Table 25 Analysis of variance - P values, number of warnings during normal driving ... 32
Table 26 Analysis of variance - P values, speed at various locations in relation to curves ... 33
Table 27 Analysis of variance – adjusted mean values for different countries ... 33
Table 28 Analysis of variance – adjusted mean values for gender ... 34
Table 29 Analysis of variance – adjusted mean values for workload ... 34
Table 30: Analysis of variance, p-values. Number of warnings during curves ... 36
Table 31 Analysis of variance - P values, speed at village ... 37
Table 32 Analysis of variance – adjusted mean values for different countries ... 37
Table 33: Analysis of variance – adjusted mean values for gender ... 38
Table 34 Analysis of variance – adjusted mean values for order ... 38
Table 35: Number of warnings at speed check point and village entry ... 41
Table 36: Analysis of variance, P-values. Speed at school. ... 41
Table 37 Analysis of variance – adjusted mean values for different countries ... 42
Table 38: Analysis of variance – adjusted mean values for gender ... 42
Table 39 Proportion of drivers in the four different events with a reaction time less than 5 seconds. 43 Table 40 Proportion of drivers with minimum and mean time headway less than 6 seconds. ... 43
Table 41: Analysis of variance, P-values. Mean and minimum time headway for event A and C. ... 44
Table 42 Analysis of variance – adjusted mean values for order in event C ... 44
Table 44 Analysis of variance – adjusted mean values, mean speed during normal driving ... 46
Table 45: Analysis of variance - P values, speed at various locations in relation to curves ... 47
Table 46 Analysis of variance – adjusted mean values for type of simulator, driving through curves . 47 Table 47: Analysis of variance - P values, speed at various locations driving through villages ... 48
Table 48: Analysis of variance – adjusted mean values for type of simulator, driving through villages ... 49
Table 49: Analysis of variance - P values, speed at various locations driving through school zone. .... 50
Table 50 Analysis of variance – adjusted mean values for type of simulator, driving through school zone ... 50
Table 51 Analysis of variance – p-values, difference between permitted and measured speed for the Speed reduction at station approach events ... 51
Table 52 Analysis of variance – p-values, difference between permitted and measured speed for the Speed reduction while driving events ... 52
Table 53 Analysis of variance – p-values, warning duration for the Speed reduction at station approach events, the Speed reduction while driving events, the Braking for station stop events, and all events ... 52
Table 54 Analysis of variance – p-values, stop quality for the Braking for station stop events ... 53
Tables 55 Mean difference of speed between permitted and measured (in kilometres per hour) ... 54
Tables 56 Warning duration (in seconds per kilometre) ... 55
Tables 57 Warning duration for all events (in seconds per kilometre) ... 55
Tables 58 Stop Quality (percentage), stop at good position (within 20 meters before the end of platform) and stop time respected (wait 30 seconds or sound signal authorization to go) ... 56
Table 59 Testing of hypotheses from D2.2 for the train experiments ... 63
Table 60 Analysis of variance – p-values, difference between permitted and measured speed for the Speed reduction at station approach events ... 64
Table 61 Analysis of variance – p-values, difference between permitted and measured speed for the Speed reduction while driving events ... 65
Table 62 Analysis of variance – p-values, warning duration for the Speed reduction at station approach events, the Speed reduction while driving, the Braking for stop, and All events ... 65
Table 63 Analysis of variance – p-values, stop quality for the Braking for station stop events ... 66
Table 64: Mean difference of speed between permitted and measured (in kilometres per hour)... 67
Table 65: Warning duration (in seconds per kilometre) ... 69
Table 66: Stop Quality (percentage), stop at good position (within 20 meters before the end of platform) and stop time respected (wait 30 seconds for sound signal authorization to go) ... 70
Table 67: Central tendency of the BSSS scores ... 72
Table 68: Descriptive statistics of participant grouping by the mean BSSS score ... 72
Table 69: Central tendency of the DAQ scores ... 72
Table 70: Descriptive statistics of participant grouping by the mean DAQ score ... 72
Table 71: Sensitivity of participant grouping variables to experimental events ... 75
Table 72: Central tendency of the BSSS scores ... 76
Table 73: Descriptive statistics of participant grouping by a BSSS score of 3 ... 76
Table 74: Central tendency of the TDBQ scores and the twelve questions. Scale from 1-6, 1=Never, 2= Hardly ever, 3=Occasionally, 4=Quite often, 5=Frequently, 6= Nearly all the time. ... 77
Table 75: Results from the One-way ANOVA comparing drivers from different countries ... 78
Table 76: Results from Post Hoc tests comparing drivers from different countries ... 80
Table 77: Statistically significant differences between Experienced and Novice drivers ... 81
List of Figures
Figure 1 The ITERATE portable car/train driving simulator ... 2
Figure 2 The interior of the train cabin in the full scale train driving simulator at VTI ... 3
Figure 3 The moving base car driving simulator at the University of Leeds ... 3
Figure 4 The ITERATE Unified Model of Driver behaviour ... 5
Figure 5: The ETSC display – signal set to stop ... 9
Figure 6: The ETSC display – new lower speed limit ... 9
Figure 7 Example speed reduction event including speed profiles for two British participants (GB04TA and GB05TA) ... 11
Figure 8 Adjusted mean speed for culture and gender. ... 31
Figure 9 Adjusted mean values of spot speeds at different locations through the curve. ... 34
Figure 10 Adjusted mean values of spot speeds at different locations through the curve ... 35
Figure 11 Adjusted mean speeds for workload and sensation seekers at curve entryTable 30: Analysis of variance, p-values. Number of warnings during curves shows the analysis result of number of warnings in curves. The total number of warnings is calculated between the spot where the curve sign is visible and curve exit. Similar to the analysis where mean speeds are studied; country, gender and workload are significant. There are no significant interaction effects... 35
Figure 12: Adjusted mean values of spot speeds at different locations through the village. ... 37
Figure 13 Adjusted mean speed for culture and experience at speed village check point... 38
Figure 14: Adjusted mean speed for culture and experience, mean speed through village ... 39
Figure 15 Adjusted mean speed for sensation seeker and experience where village sign visible... 40
Figure 16 Adjusted mean speed for sensation seeker and experience at speed village check point ... 40
Figure 17 Adjusted mean speeds for different countries ... 42
Figure 18 Adjusted mean of mean time headway for gender and country during event C. ... 45
Figure 19 Adjusted mean of minimum time headway for gender and country during event C. ... 45
Figure 20: Adjusted mean speed for type of simulator, driving through curves. ... 48
Figure 21 Adjusted mean values for type of simulator, driving through villages ... 49
Figure 22 Adjusted mean values for type of simulator, driving through school zone ... 50
Figure 23 Difference between permitted and measured speed (km/h) depending on Sensation seeking score during the Speed reduction at station approach event and the Speed reduction while driving event, at point PI and PII and over section SI ... 57
Figure 24 Warning duration per kilometre (s/km) depending sensation seeker score for the Speed reduction at station approach event, the Speed reduction while driving event and the Braking for station stop event ... 58
Figure 25 Difference between permitted and measured speed (km/h) depending on Sensation seeking score during the Speed reduction at station approach event and the Speed reduction while driving event, at point PII and PIII and over section SII ... 58
Figure 26 Warning duration per kilometre (s/km) depending on experience for the Speed reduction at station approach event, the Speed reduction while driving event and the Braking for station stop event ... 59
Figure 27 Warning duration per kilometre (s/km) depending on driver state for the Speed reduction at station approach event, the Speed reduction while driving event and the Braking for station stop event ... 60
Figure 28 Stop quality during the Braking for stop event depending on driver state. ... 60
Figure 29 Difference between permitted and measured speed (km/h) depending on driver state during the Speed reduction at station approach event and the Speed reduction while driving event 61 Figure 30 Warning duration per kilometre (s/km) depending on workload for the Speed reduction at station approach event the Speed reduction while driving event and the Braking for station stop event ... 62
Figure 31 Difference between permitted and measured speed (km/h) depending on simulator during
the Speed reduction at station approach event and the Speed reduction while driving event ... 68
Figure 32 Warning duration per kilometre (s/km) depending on simulator for the Speed reduction at station approach event, the Speed reduction while driving event and the Braking for station stop event ... 69
Figure 33 Stop quality during the Braking for stop event depending on simulator. ... 70
Figure 34: Tentative grouping of participants by mean scores ... 73
Figure 35: Tentative grouping of participants by homogeneous clusters... 73
EXECUTIVE SUMMARY
The aim of Deliverable 5.1 of the ITERATE project is to present results of analyses made of the data collected in the ITERATE WP4 driving simulator experiments. The ITERATE WP4 driving simulator experiments consisted of train and car driving experiments carried out on a portable car/train driving simulator platform and in full scale car and train driving simulators.
The analyses conducted and presented in this deliverable consist of hypothesis testing, cluster analy-sis and development of a procedure for estimation of parameters of relationships in the WP6 UMD simulation model.
Findings from the analyses show that country was found to be an important factor in both the car and train driving experiment. Significant effects of the factor workload were also established in many of the events analysed. The conclusion of comparisons between the data collected in the portable and full scale simulators is that the ITERATE portable driving simulator platform is a suitable tool to studying underlying factors controlling driver behaviour. However, there were some minor differ-ences between the portable and full scale train simulators which was attributed to the driver’s con-trol device. These differences should be considered in for the further development of the train simu-lator.
The next step within the ITERATE project is to estimate relevant relationships in the WP6 UMD simu-lation model based on the findings of the analyses presented in this deliverable. The analyses pre-sented will also be important as inspiration for other studies outside of the present project with the ITERATE driving simulator dataset as an important source of data.
1. INTRODUCTION
The aim of the ITERATE project is to develop a unified model of driver behaviour (UMD) and driver interaction with innovative technologies in emergency situations. The model should be applicable to all surface transport modes. As a basis of the model development it is assumed that the underlying factors influencing human behaviour such as age, gender, culture and so forth are constant between the different transport modes. The UMD will be implemented into a numerical simulation model that can be used to study interactions between the driver, the vehicle and the environment.
In the early stages of the project, the UMD was developed based on a literature review of driver behaviour models. A review of innovative technologies, i.e. driver assistance systems such as Intelli-gent Speed Adaptation (ISA) for the road traffic domain and the European Rail Traffic Management System (ERTMS) for the rail domain, was also conducted. Based on these reviews, a set of hypothe-ses were formulated on how drivers will behave and interact with assistance systems depending on the underlying factors influencing human behaviour. To test these hypotheses and thereby verify the theoretically developed UMD, road and rail driving simulator experiments were conducted. Results of the driving simulator experiments will also be used to estimate parameters of the numerical UMD simulation model. The ITERATE driving simulator experiments are unique in the sense that common scenarios run on a common portable car/train driving platform as well as full scale train and car driv-ing simulators. Two identical portable drivdriv-ing simulator platforms were used among the project partners across five countries allowing a large number of participants to take part in the experiment. The purpose of this deliverable is to present the results of the analyses performed on the data set collected in these driving simulator experiments and to describe how the driving simulator data will be used to estimate parameters in the numerical UMD simulation. The main part of the analysis is driven by the hypotheses formulated earlier in the project, i.e. the objective is to statistically test the hypotheses. As a complement to the hypothesis testing, exploratory data analysis in the form of a cluster analysis were conducted to study alternative underlying factors controlling driver behaviour. Details of the driving simulator experiments including the experimental design, the driving simula-tors used, the experimental protocols and the data collected are given in the ITERATE deliverable 4.1, Data and experimental protocol from the experiments. This report contains only an overview of the experiment to put the analysis into context. In addition, as stated above, a description will be given on how the driving simulator results will be used to estimate parameters of the UMD simula-tion model. The results of the applicasimula-tion of this descripsimula-tion will be presented in the ITERATE deliv-erable 6.3.
The remainder of this document is organised as follows. Chapter 2 gives an overview of the portable and full scale driving simulator experiments and the data collected in these experiments. The analy-sis plan including the methods applied in the different parts of the analyanaly-sis are presented in Chap-ter 3. ChapChap-ter 4 is dedicated to statistics of the participants’ background data. The hypothesis testing results for the car and train domains are presented in Chapter 5 and 6, respectively. Chapter 7 con-tains results of the complementing exploratory data analyses, cluster analyses, performed on the car and train questionnaire data sets. Chapter 8 gives a description of how the driving simulator data will be utilised to estimate parameters in the numerical UMD simulation model. An across mode discussion on the results of the analysis of the car and train data is given in Chapter 9 before the deliverable concludes in Chapter 1.
2. THE ITERATE DATASET
This chapter gives a description of the dataset collected in the experimental studies carried out in ITERATE WP4 and described in detail in Deliverable 4.1. The aim of this chapter is to put the analysis and results presented in this deliverable into context. For complete details of the ITERATE experi-mental studies refer to deliverables D3.1 and D4.1.
2.1 Car and train driving simulator experiments
The WP4 experimental studies consisted of a train driving experiment and a car driving experiment. These two experiments were conducted on a common portable car/train driving simulator platform developed within the ITERATE project, see Figure 1. The experiments were also conducted in the full scale train operator simulator at VTI and in the moving base car driving simulator at the University of Leeds, see Figure 2 and Figure 3.
Figure 2 The interior of the train cabin in the full scale train driving simulator at VTI
Figure 3 The moving base car driving simulator at the University of Leeds
Two identical portable driving simulator platforms were built within the project. These two simula-tors were circulated among KITE solutions (Italy), Ben Gurion University (Israel), the University of Valenciennes (France), the University of Leeds (UK) and VTI (Sweden). The use of portable simulators made it possible to conduct identical experiments in five different countries.
Focus of the ITERATE project is on the operator’s interaction with in-vehicle support systems. The car driving simulator experiment was divided into two parts, driving on a two-lane highway with an In-telligent Speed Adaptation System (ISA) and motorway driving with a Forward Collision Warning System (FCW). During the train driving experiment, the driver interacted with (a simplified version of) the European Rail Traffic Management System (ERTMS) called ETCS (European Train Control Sys-tem).
The ISA part of the car experiment included negotiating speed limit changes and sharp curves, as well as driving through villages and a school zone. The ISA system gave an auditory and visual
warn-ing to the driver if the driver exceeded the speed limit with more than 2 km/h. In approaches to sharp curves there was a curve warning sign at the side of the road and the ISA system displayed an in-vehicle curve warning sign and issued an auditory warning to the driver if the driver drove faster than a given threshold speed at the position of the curve sign and at an intermediate position before the curve. In the approach to the villages an auditory and visual warning was issued if the driver drove faster than a threshold speed at a fixed position before the village entry. Similarly, in the ap-proach to the school zone there was a school warning sign and the ISA system displayed an in-vehicle sign. A warning was issued to the driver if a threshold speed was exceeded in the approach to the school zone. The threshold speeds in the approach to the sharp curves, the village entries and the school zone was determined based on the difference between the general speed limit and a recommended curve speed, the village speed limit and the school zone speed limit, respectively. In the FCW part of the car experiment, the driver encountered events with a lane changing truck, a road work with a lane drop, the sudden braking of a car in front and breakdown of a downstream vehicle. In the lane changing truck event, a truck changed lane in front of the driver in order to over-take a slower truck. The driver responded to the lane changing truck by braking or lane-changing and was forced to follow the trucks until the overtaking was completed. This event could therefore be divided into a reaction and a car-following part. The reaction part of the event was defined as the time that the faster truck started the lane-change until the driver responded by braking or lane changing and the car-following part was defined as the end of the reaction part until the overtaking of the slower truck was completed by the faster truck. In the road work event, the adjacent lane was closed due to a road work and vehicles were therefore cutting in ahead of the driver. This event could also be divided into a reaction and a car-following part with the reaction part being the time from the first vehicle cutting in to the driver responding to this vehicle by braking and the car-following part being the time spent on the one-lane section created by the road work. In the event with a sudden braking of a lead car the driver had to respond to avoid collision. This event consisted of a reaction part measured from the time of the sudden braking of the lead vehicle to the time of the response of the driver. Similarly, the final event including breakdown of a downstream vehicle consisted of a reaction part measured from the vehicle breakdown to driver reaction by braking. During these events the FCW system issued an auditory warning if the driver came closer to the lead vehicle than a warning distance. The warning distance was based on the stopping distances of the lead and following vehicles.
During the train driving scenario the drivers were asked to drive the train according to a given time-table. The train driving scenario included several changes in speed limit and stations at which the driver were to stop. The changes in speed limit and the stops included different track alignments, i.e. slopes, and levels of the permitted speeds. The driver was assisted by the ETCS system that issued a continuous warning to the driver if the speed limit was exceeded. In the approach to changes in speed limit and stop at stations the system indicated the required braking through a permitted speed profile. A continuous warning was issued to the driver if the permitted speed profile was ex-ceeded during the deceleration to new lower speed limit or to stop at a station.
The purpose of the WP4 experiments and the analysis presented in this deliverable was to investi-gate and test assumptions made in the theoretical Unified Driver-Vehicle-Environment interaction model (UMD) presented in ITERATE deliverable D1.2, see Figure 4. An important purpose was also to provide data for estimation of parameters in the numerical UMD simulation model to be developed in ITERATE WP6.
Figure 4 The ITERATE Unified Model of Driver behaviour
In this model, the variables influencing driver behaviour are culture, attitude/personality, experi-ence, driver state and task demand. Task demand (workload) is varied within each participant during the experiment by asking the participants to perform backwards counting tasks. Attitude/personality is measured through the Brief Sensation Seeking Scale (BSSS) (Hoyle et al. 2002). The Traffic Culture and Climate Scale developed by Özkan et al. (2006) with 44 items related to traffic culture version was used as an indicator of culture, country of living (and participation in the experiment). A set of complementary questionnaires are also used to allow more detailed analysis of driver culture. Driver state is in the experiment varied between participants in a dichotomous way by letting a group of “alert” participants drive the simulator in the morning and a group of “fatigue” participants to drive the simulator in the afternoon. The Karolinska Sleepiness Scale (KSS) (Gillberg et al., 1994) was used as a subjective measure to quantify the fatigue level in the two groups. Experience is measured by the number of years as a train driver or the number of years holding a car driving license for train and car drivers respectively. The participants were also asked to complete Sagberg and Bjørnskau’s hazard perception test (Sagberg and Bjørnskau, 2006) that could be used to verify the relationship between experience and hazard perception skills.
2.2 Contents of the ITERATE dataset
The ITERATE dataset collected in the experimental studies consists of:
• Simulator data collected in the portable and full scale simulator experiments • Questionnaire data
• Hazard perception test data
• KSS scores before and after the simulator drive. • A participant information file
• Column specifications for the simulator data files
The simulator data was sampled at 60 Hz and the data recorded at each sample is described in the column specification files. From the car experiment there are also a set of two aggregate data files in the data set that contain the participant’s reactions to the events in the ISA and FCW parts of the experiment.
The questionnaire data includes general information about the participant and the answers to the driving culture and sensation seeking questionnaires. All questionnaire data was collected with a web-based questionnaire (SPSS Mr Interview) and stored in SPSS-format.
The hazard perception test data consists of the output files from the hazard perception test for more details see D4.1.
The participant information file contains information about the properties of each participant, i.e. gender, experience or novice, alert or fatigue and so forth. Observations done during the experi-ments are also included in the participant information file. Details about the participants in the car and train experiments are presented in Chapter 4.
3. METHOD
3.1 Overview
In this chapter, an analysis plan for the experiments conducted in WP4 is described. In section 3.2, the pre-processing of simulator and operator data is described. The hypotheses to be tested are described in section 3.3. These hypotheses are based on the hypotheses outlined in Deliverable 3.1. The hypotheses have been adjusted according to the final design of the experiments and according to what is most relevant for the work in WP6. In section 3.4, the statistical models used in the analy-sis are described. Validation of the portable simulators against the full motion simulators in Leeds (car) and at VTI (train) is described in section 3.5. Section 3.6, Explorative data analysis, describes the cluster analysis on the questionnaire data . In section 3.7, a presentation is given of the method for estimation of relationships in the WP6 UMD simulation.
3.2 Pre-processing of operator data 3.2.1 Simulator data
This step includes checking the data quality (missing data during the drive, interrupted drives, etc) and calculating performance indicators. The performance indicators to be applied for the car and train experiments are presented in the following sub-sections.
3.2.1.1 Performance indicators for the car driving simulator experiment
For the car driving simulator experiment, the performance indicators calculated for the ISA-part and FCW-part respectively are specified below. As mentioned in section 2.1, the ISA part of the car ex-periment includes negotiating speed limit changes and sharp bends, as well as driving through villag-es and a school zone. In the FCW part, the driver encountered events with a lane changing truck (A), vehicle breaks down of a car in front (B), a road work with a lane drop (C) and the sudden braking of car in front (D).
ISA
Normal driving (during sections with 80 km/h)
• Mean speed and number of warnings at each section with 80 km/h Speed and warnings in relation to sharp curves
• Spot speed and warnings
o where speed curve sign visible o at curve sign (-250 m before curve)
o at speed check point (-125 m before curve) o at curve entry
o at curve apex (+ 76.5 m after curve sign) o at curve exit (+ 153 m after curve sign) • Mean speed through curves
Speed and warnings at village entry • Spot speed and warnings
o where speed limit sign becomes visible o where ISA speed check turned off o at speed check point
o at village entry (speed limit sign)
Speed and warnings at school zone • Spot speed and warnings
o where school sign becomes visible
o at school sign (-100 m before speed sign 30 km/h) o at speed check point (-50 m before speed sign 30 km/h) o at start of school zone (at speed sign 30 km/h)
o at end of school zone (+ 108 m, at speed sign 50 km/h)
• Mean speed and total number of warnings during section with 30 km/h (school zone) FCW
Event A: lane changing truck and Event C: a road work with a lane drop Reaction region
• Reaction time • Min TTC
• Frequency of warning Car following region
• Mean time headway • Min time headway • Frequency of warning
Event B: vehicle breaks down of a car in front and Event D: the sudden braking of car in front Reaction region
• Reaction time • Min TTC
• Frequency of warning
3.2.1.2 Performance indicators for the train driving simulator experiment
In the train experiment, the following performance indicators were used in the analysis (see Figure 7 for definition of positions):
• difference between permitted and measured speed (i.e. permitted speed – measured speed, km/h) at specific positions
• mean difference between permitted and measured speed (km/h) between these positions and
• warning duration (seconds) per kilometre during speed reduction
In Table 1, Events (E from 1 to 25) in the train scenario are presented. There are three levels of work-load (WL) in the scenario, Low (L), Medium (M) and High (H). Three types of events can be defined:
1. Speed reduction at station approach are events in which the train driver has to reduce speed in the approach to a station. (in general the allowed speed is 40 km/h within the station area if there is a track change and a station stop)
2. Speed reduction while driving are events in which the train driver has to reduce speed along the track. The required speed reduction is lower in the Speed reduction while driving events compared to the Speed reduction at station approach events.
3. Braking for station stop are events in which the train driver is required to stop at a station.
The speed reduction during these events are in general from 40 km/h to zero.
The driver gets information on how to perform the speed reduction on the ETCS display (see D4.1 for details). A brief description of the information given to the driver on the display is given below.
Figure 5: The ETSC display – signal set to stop
In Figure 5 the driver is driving at 40 km/h and receives a notification that there is a stop ahead. The countdown bar on the left indicates the distance to the stop. The number above the bar indicates the exact distance (in this case 772 meters). The dark green arc around the speedometer has been replaced with a light grey arc. This means that the current speed is allowed but as the train ap-proaches the stop this arc will shrink. Also note the small square in the upper left hand corner. This square will grow as the train approach the point where braking has to start to be able to safely reach standstill.
Figure 6: The ETSC display – new lower speed limit
In Figure 6 the driver is driving at 140 km/h and then gets a notification about a new lower speed ahead, in this case 90 km/h. The bar on the left says that he has 845 meters left to the new speed. Also note the small square in the upper left hand corner. This square will grow as we approach the point where braking has to start to be able to safely reach the new speed.
Table 1 Events in the train scenario
Event
Position (Km+m)
WL Type
Start Speed reduction / End of platform End
E1 23+185 24+113 25+271 M Speed reduction at station approach
E2 25+271 25+980 26+175 M Braking for station stop
E3
31+050 32+501 32+650
M Speed reduction while driving
32+651 32+914 33+054
33+285 33+730 34+285
E4 36+032 36+718 37+032 L Speed reduction at station approach
E5 37+032 37+820 38+002 L Braking for station stop
E6 45+160 45+997 46+000 L Speed reduction while driving
E7 46+001 "" 46+160 H Speed reduction while driving E8 48+746 49+239 49+746 H Speed reduction at station approach
E9 49+838 50+460 50+838 H Braking for station stop
E10 55+060 55+828 56+060 H Speed reduction while driving E11 57+001 57+553 58+060 M Speed reduction at station approach
E12 58+140 58+705 59+140 M Braking for station stop
E13 67+283 67+897 68+284 M Speed reduction while driving
E14 68+536 69+075 69+536 M Braking for station stop
E15 69+920 70+815 70+920 M Speed reduction while driving E16 74+391 74+884 75+391 M Speed reduction at station approach
E17 75+444 76+025 76+444 M Braking for station stop
E18 83+628 83+890 84+628 L Speed reduction at station approach
E19 84+760 85+440 85+760 L Braking for station stop
E20 89+430 90+267 90+430 L Speed reduction while driving E21 94+967 95+229 95+967 L Speed reduction at station approach
E22 95+967 96+670 96+905 L Braking for station stop
E23 102+050 102+312 103+050 H Speed reduction at station approach E24 103+050 103+840 104+035 H Braking for station stop E25 109+977 110+552 110+977 L Speed reduction while driving Start and End of events, and speed reduction positions were determined by analysing the raw data from the experiments. The End of platform position, was defined by running the full simulation twice and observing where the drivers actually stopped. Drivers were instructed to stop at the end of the platform in order to trigger the “clear to drive” signal i.e. new allowed speed (40 km/h). The same positions were used for all drivers in the analysis.
Note that concerning event 6, there is "only" 3 meters of deceleration. In fact, events 6 and 7 were supposed to be only one during scenario specification but because of workload modification (Low to High) at Km 46+001, it was decided to split the event in two for the analysis.
Table 2 Events of different type and in different workload condition in the train scenario
Event Workload
Speed reduction at station approach, strong deceleration required L: E4, E18, and E21 M: E1, E11, and E16 H: E8, and E23 Speed reduction while driving, mild deceleration required L: E6, E20, and E25
M: E3, E13, and E15 H: E7, and E10
Braking for station stop L: E5, E19, and E22
M: E2, E12, E14, and E17 H: E9, and E24
For each speed reduction event, the difference between measured and permitted speed perfor-mance indicators will be calculated at three points (PI, PII and PIII) and over the two sections con-necting these three points (SI and SII). PI corresponds to the start of the event, PII is defined as the point at which the ETCS display begins to reduce the permitted speed and PIII is the end point of the event (the point at which the new speed should have been reached). SI is the section in between points PI and PII. Similarly, SII is the section between points PII and PIII. For the sections, SI and SII, the performance indicator used is the mean difference between permitted and measured speed. An example (speed reduction at station approach) that illustrates the points and sections PI-PIII is shown in Figure 7.
Figure 7 Example speed reduction event including speed profiles for two British participants (GB04TA and GB05TA)
In Figure 7 PI is located at km 48746, PII at km 49239 and PIII at km 49746. SI is defined as the sec-tion between km 48746 and km 49239. Finally SII is the secsec-tion between km 49239 and km 49746. Note that, in the example, the difference between permitted and measured speed will be negative at point PIII and over section SII for participant GB04TA.
30 40 50 60 70 80 90 100 110 120 4 8 7 4 6 4 8 7 7 1 4 8 7 9 6 4 8 8 2 1 4 8 8 4 6 4 8 8 7 1 4 8 8 9 6 4 8 9 2 1 4 8 9 4 6 4 8 9 7 1 4 8 9 9 6 4 9 0 2 1 4 9 0 4 6 4 9 0 7 1 4 9 0 9 6 4 9 1 2 1 4 9 1 4 6 4 9 1 7 1 4 9 1 9 6 4 9 2 2 1 4 9 2 4 6 4 9 2 7 1 4 9 2 9 6 4 9 3 2 1 4 9 3 4 6 4 9 3 7 1 4 9 3 9 6 4 9 4 2 1 4 9 4 4 6 4 9 4 7 1 4 9 4 9 6 4 9 5 2 1 4 9 5 4 6 4 9 5 7 1 4 9 5 9 6 4 9 6 2 1 4 9 6 4 6 4 9 6 7 1 4 9 6 9 6 4 9 7 2 1 4 9 7 4 6 permitted GB04TA_measured GB05TA_measured PI PII SI SII PIII
For E6, we have only considered points from PI to PII and for E7, from PII to PIII, which corresponds to the initial scenario specification before splitting because of workload levels.
If the train driver exceeds the permitted speed, the ETCS system issues a continuous warning. Due to the different lengths of the events, the warning duration performance indicator has been normal-ised with respect to the length of the event.
3.2.2 Operator data
Pre-processing of operator data includes checking for missing data.
The operators are categorised by a number of factors that are important to consider in the analyses. Many of the factors are already defined in Deliverable 3.1. These are:
Culture
Drivers from the five countries: Sweden, France, Italy, UK and Israel
Experience
− Inexperienced car drivers: license held for a maximum of 1 year;
− Experienced car drivers: license for 5-10 years; drives a minimum of 10,000 km per year; − Inexperienced train drivers: qualified drivers, but less than 2 year experience as an active
train driver;
− Experienced train drivers: more than 4 year experience as an active train driver.
Fatigue
Fatigue was induced during the experiment and the factor has two levels: not fatigued and mild fa-tigue.
Workload
There are three levels of workload in the experiments (low, medium and high) and workload will be manipulated within a run.
In addition to these four factors we have defined high and low sensation seekers and a factor that describes the order of the two runs in the car experiment with different systems (ISA and FCW).
Sensation seekers
A convention that have been used in several other studies is that operators scoring under 3 are cat-egorised as low sensation seekers and operators scoring over 3 as high sensations seekers (Zakletskaia et al., 2009). That categorisation can be used if the sample is more or less evenly divided between the two groups. If, instead, most operators are scoring under or over 3 one can consider dividing the sample in half according to the size of the actual scores. In this study we defined high sensation seekers as those who score over 3. The mean value of the average sensation seeking score was very close to 3 which is described in section 4.1.2 for car drivers and 4.2.1 for train drivers.
Order
Half of the operators in the car driving experiment start driving on the rural road with the ISA sys-tem. The other half starts driving on the motorway with the FCW syssys-tem. To take account of the different orders a factor order is included in the analyses of the car driving data. The factor is 1 if the operator started the drive with the system under study and 2 otherwise.
Finally, we include the factors gender and operator as covariates in the model. We have chosen not to include age since age is very closely related to experience.
This part of the analysis also includes checking how well we succeeded to induce fatigue. This is done by comparing self-reported fatigue according to KSS within the two groups with induced fatigue. It should be noted that KSS normally is difficult to use for comparisons between operators since the levels of the scale might be interpreted differently by different operators. However, since we have a large number of operators the individual differences should be levelled out. There are two KSS val-ues for each driver, one from before the training and one from after the experimental drive. Thus, there is no KSS value from right before the experimental drive. To take into account that different groups of operators might use the scale differently, we suggest that an analysis of variance model is used. Except fatigue, the factors culture and gender should also be included in the model.
The drivers of the train scenario are asked to follow a timetable. At this stage of the project, since the train drivers are used to follow a timetable, it will be assumed that the timetable had no effect on the driving behaviour.
Table 3, Table 4 and Table 6 summarises the situations that will be studied and corresponding hy-pothesis for the different systems. The hypotheses are developed based on the scenari-os/hypotheses described in D2.2 and in Appendix 1-4 in D 3.1. All hypotheses within the same situa-tion will be tested by the same statistical model.
The car experiment includes two different systems, ISA (Table 3) and FCW (Table 4). The train exper-iment includes only a speed management system (Table 6).
3.2.3 Hypotheses of the car experiment
Table 3 Situations and hypotheses during the drive on the rural road with ISA system Situation/trigger Performance
indi-cators
Hypotheses Normal driving Mean speed and
warnings
1. High sensation seekers will chose higher speed than low sensation seekers
2. Experienced drivers will chose higher speed
3. Fatigued drivers compensate by choosing lower speed 4. Operators choose higher speed during low workload
and lower speed during high workload Approach to curves Warning and speed
before curve
1. High sensation seekers behave so that more warnings will be triggered
2. Experienced drivers will receive fewer warnings than inexperienced
3. Fatigued drivers will rely on the system to warn them and receive more warnings.
4. Operators will receive more warnings during high and low workload.
Driving through curves
Mean speed through curves
Same as for normal driving All changes in
speed limit
Warning and speed in relation to village entry and school zone
1. High sensation seekers behave so that more warnings will be triggered
2. Experienced drivers will receive fewer warnings than inexperienced
3. Fatigued drivers will rely on the system to warn them and receive more warnings.
4. Workload: not relevant due to that speed changes only occur under medium workload
Table 4: Situations and hypotheses during the drive on the motorway with FCW system
Situation Performance
indi-cators
Hypotheses Car-following Warnings1
Mean time head-way
Min time headway
1. High sensation seekers will adopt shorter headway and receive more warnings
2. No hypothesis for experienced drivers
3. Fatigued drivers will rely on the system to warn them and receive more warnings
4. Operators will receive more warnings during high and low workload. Reaction type of scenario Reaction time Min TTC Warnings
1. No hypothesis for sensation seekers
2. Experienced drivers will have shorter reaction time 3. Fatigued drivers will have longer reaction time
4. Operators will have longer reaction time during low and high workload
1
3.2.4 Hypotheses of the train experiment Table 5 contains the hypotheses presented in D3.1. Table 5 Hypothesis from D3.1
H1 Sensation-seeking operators adopt (or choose) shorter warning thresholds.
H2 Sensation-seeking operators will behave in such a way that more warnings will be triggered. H3 Sensation-seeking operators will seek stimulation to cope with monotonous situations. H4 Experienced operators will receive fewer warnings than inexperienced operators. H5 Fatigued operators will rely on the system to warn them about a critical situation. H6 Operators will receive more warnings when fatigued than when alert.
H7 Fatigued operators will have less situational awareness than alert operators.
H8 Fatigued operators may compensate for their fatigue by increasing the safety margin. H9 Operators will receive more warnings when under low workload.
H10 Operators will receive more warnings when under high workload.
These hypotheses have to be modified by formulating them in a more detailed way to fit a train driv-ing scenario. Table 6 contains the modified hypotheses to be tested in the analysis.
Table 6 Modified hypotheses for the train driving experiment
H1 High sensation seekers will drive as close as possible from permitted speed (and keep their current speed
as close as possible from permitted speed before deceleration).
H2 High sensation seekers behave so that more warnings will be triggered.
H3 High sensation seekers will drive as close as possible from permitted speed (and behave so that speed
lowering -deceleration curve- will be as close as possible from permitted speed).
H4 Experienced operators will receive fewer warnings than inexperienced.
H5 Not relevant for train drivers as they always try not to be warned by system.
H6 Fatigued operators will receive more warnings than alert.
H7 Fatigued operators will fail to stop at station.
H8 Fatigued operators will set their speed much lower from permitted speed (and start to lower their speed
-deceleration curve- as soon as possible)
H9 Low workload, more warnings. H10 High workload, more warnings.
The hypotheses in italics (H1, H3, H5, H7, and H8) have been adapted to fit the train driving scenario. 3.3 Statistical analysis
All situations described in 3.2.1 can be modelled with either of two basic models. The difference between the models is whether workload is included or not. Below the model used for analysis of variance with workload included is described. In situations with only one level of workload is rele-vant, all factors including workload cancel out.
The models include a large number of factors which makes it challenging to interpret the data. It is worth noticing that if 7 factors and all two-way interaction terms are included in the model, the probability for at least one significant test only by chance is about .72. Thus, it is important to restrict the number of interaction terms. To limit the number of interaction terms, a priority list for the two-way interactions of interest to include in the model was made. No higher order interactions were included.
Model description: Factors Culture Experience Fatigue Sensation seeker Gender Age Order Operator(Culture*Experience*Fatigue* Sensation seeker*Gender*Age*Order)1 Workload2
All factors except operator are fixed
Interaction terms Country*Experience
Country*Gender Experience*Fatigue Experience*Sensation seeker Experience*Gender Experience*Workload2 Fatigue*Workload2 Sensation seeker*Workload2 1 ) Nested factor 2 ) If relevant
The main type of results from the analyses will be: − ANOVA table with F-tests
− Comparison of different levels of the factors. The comparisons are based on the estimated marginal means which compensate for an unbalanced design if that is the case.
3.4 Validation against full motion simulators
Primarily, we will use data from Swedish participants in the portable train simulator and validate against the full motion simulator at VTI and likewise for the car experiment at Leeds.
Data from both types of simulators (portable or full motion) will be incorporated in the same model. In that way, direct tests of the differences can be made.
The model described in section 3.3 can be used with slight modification: the factor culture should be removed and a factor that describes simulator type should be added.
The main effect of simulator type answers whether there are differences in level between simulator types for different performance indicators. To test whether there is any differences in effect for dif-ferent groups of operators, interaction terms will be studied. For example if the term experi-ence*type is significantly different from zero, this indicates that becoming more experienced does not affect the behaviour in the portable simulator in the same way as in the full motion simulator. Even if the interaction is not statistically significant the relevant effect should be studied to see whether it goes in the same direction for the different simulators.
The same situations as those described in section 3.2 will be analysed 3.5 Exploratory data analysis
The theoretical ITERATE model developed in WP1 considers that operators’ performance would be affected by their attitude towards risk. Sensation seeking is a personal trait which refers to the ten-dency to pursue sensory pleasure and excitement. Individuals with such a trait tend to proactively
seek for novelty and complexity, and may take risks in the pursuit of such experience. Due to its global applicability to human beings across cultures, it was adopted as an independent variable rep-resenting operator attitude in WP2 for hypothesis formulation and in WP3 for experiment design. Sensation seeking is commonly measured by a set of questions relating to a range of activities (Sen-sation Seeking Scales, SSS), which are not directly relating to driving. In order to verify the applicabil-ity of sensation seeking to the ITERATE model, another instrument, Driver Attitude Questionnaire (DAQ), which has been developed in the field of car driving behaviour, was adopted in the WP4 ex-periment, in order to obtain empirical data for examining the association between SSS and DAQ. Sensation seeking is used as a categorical variable in WP5 for exploring the differences in behaviour among groups of drivers. The most commonly adopted approach is to group samples by statistical central tendency indicators, such as mean, median, or mode. In addition to this, cluster analysis is proposed as an exploratory tool to classify samples into relatively homogeneous groups, in order to explore the sensitivity of different categorisation approaches.
3.6 Derivation of correlation relationships
To formulate the correlations which enable to account for the UMD in a simulation of the Driver-Vehicle-Environment interaction, a generic function defining interactions among the driver parame-ters has been defined.
)
(
*
)
(
)
(
*
)
(
)
,
(
*
)
(
)
(
CULT
CULT
f
ATT
EXP
CULT
g
DS
CULT
h
TD
K
F
i=
i+
α
i+
γ
i+
β
iF is a generic function used in the driver simulation to compute different variables such as speed, distance form a leading vehicle or obstacle, acceleration and braking rate etc. In other terms, F is associated to a wide range of driver performances. This is the reason of the presence of the index i, which determines the specific F function that is being considered.
In particular, for the car driver, the behaviour that is analysed is associated with the dependent vari-able: “intended speed”, “braking and acceleration modes” and “intended distance from leading ve-hicle or obstacle”. For the train driver behaviour the same dependent variable as the car driver are considered, with the obvious exclusion of the condition “distance from a leading vehicle”. Other dependent variables, such as for example “reaction distance to signals”, will also be studied as part of the detailed development of the simulation tool (see Deliverable D 6.2).
The F mathematical function is defined by a set of: • Parameters: ATT, EXP, DS, TD, CULT • Functions: f(), g() and h()
• Coefficients: α, β and γ • Constant K
The parameters affect functions, coefficients and constant. Namely, the parameters ATT, EXP DS and
TD are used to compute the output of the functions f(), g(), and h(), while the parameter CULT is
used to compute the coefficient α, β and γ and the constant K. This might appear to suggest that no difference exist between functions, coefficients and constants, but it would be a wrong assumption. Coefficients and constant do not change during the simulation and their values are determined by CULT, which is a not numeric value representing the nationality of the driver. On the other hand functions are computed on the basis of parameters having numeric values and their output, as well as the input parameters, can change during the simulation.
The way in which the function F is formulated assumes that it is possible to develop a linear correla-tion between the parameters ATT, EXP DS and TD and the dependent variables associated to F.
Moreover, the parameter CULT is also affecting the overall value of F, but it characterises entire sets of data collected according to different cultures. This implies that the function F is in reality depend-ent on CULT. Moreover, for each cultural environmdepend-ent it is assumed that the parameters ATT, EXP, DS and TD are not associated to continuous variation and can assume discrete values, which corre-spond to precise numerical quantities as shown in Table 7.
Table 7 Driver parameters value
ATT 0 (Prudent) 1/8 (Sensation seeker) EXP -1/8 (Novice) 1/8 (Experienced) DS 1/8 (Alert) -1/8 (Fatigued) TD 1/8 (Low) 0 (Medium) -1/8 (High)
Given these boundary conditions, the functions associated to the parameters α, β and γ have a very simple formulation: TD TD h DS DS g EXP EXP ATT f ATT if EXP ATT f ATT if = = = ⇒ = → = ⇒ = → ) ( ) ( ) , ( 0 4 / 1 ) , ( 8 / 1
The function F is used in several cases. The most significant ones are shown hereafter, while for a more exhaustive list, which include vehicle dependant cases, please refer to deliverable D6.2 specifi-cally dedicated to the simulation detailed implementation.
• Intended speed computation, depending the maximum allowed speed:
max
int F * v
v = v
• Intended distance from a leading vehicle, depending on current vehicle speed:
s F
t v
sint =1.6* ( )
• Gas pedal pressure rate, depending on current and intended speed
g r F t v t v t g 2 1 ) ( ) ( 1 ) ( int − =
• Brake pedal pressure rate, depending on current and intended speed
b r F t v t v t b 2 1 ) ( ) ( 1 ) ( int − =
In order to obtain a complete definition of correlations, the values of the coefficients will be deter-mined by the linear regression analysis of experimental data. For each F, specific sections of the roads used in the experiments will be identified where the dependent variables used in the correla-tions can be clearly identified and assessed. This is an objective difficulty of the proposed approach, as it will be necessary, for example, to identify sections of the road/rail where the driver will be
driv-ing at the “intended” speed, or sections of the roads where the driver is maintaindriv-ing the intended distance between the “ego-vehicle” and the “leading vehicle”.
Once these sections of the roads are selected, the data of experimental files, for those specific sec-tions of the roads/rail, will be used to perform linear regressions and to compute the values of the constant Ki, and coefficients αi, βi and γi associated to each function Fi.
The main difficulty in this operations lies in the evaluation of measurable variables which are not directly included in the data files, expressing different kind of intention of the driver, e.g., the in-tended speed and inin-tended distance from a leading vehicle or an obstacle (a steady queue blocking the road).
4. PARTICIPANTS’ BACKGROUND DATA
4.1 Car drivers
The car driving data set collected in the portable and in the moving base big driving simulators con-sists of data from 154 and 29 participants, respectively. The numbers of participants from each country and in each group (gender, experience, driver state (fatigue) and order) are shown in Table 8. The order group refers to the order at which the participants have done the two parts of the car driving experiment, i.e. participants in the FCW group did the FCW part of the experiment before the ISA part and vice versa.
Table 8 Number of participants in the car driving simulator experiment
4.1.1 Experience
Participants were recruited into the Experienced/Novice groups based on the number of years that they had been holding a driving license. Naturally there will be a correlation between the partici-pants’ age and experience measured as the number of years as a driving license holder. Descriptive statistics of the age of the participants in the experienced and novice groups are shown in Table 9. Table 9 Descriptive statistics - Age of the participants in the car driving simulator experiment
Table 10 contains descriptive statistics of the number of years holding a driving license for the partic-ipants in the Experienced and Novice groups.
Female Male Experienced Novice Alert Fatigue FCW ISA
FR 32 7 25 16 16 16 16 16 16 GB 30 15 15 16 14 15 15 14 15 IL 31 16 15 16 15 16 15 16 15 IT 27 11 16 20 7 16 11 14 13 SE 34 16 18 26 8 14 20 17 17 Tot 154 65 89 94 60 77 77 77 76 GB, big sim 29 17 12 15 14 14 15 14 15
Country Number Gender Experience Fatigue Order
Country Experience E x p e r i e n c e d N o v i c e E x p e r i e n c e d N o v i c e E x p e r i e n c e d N o v i c e E x p e r i e n c e d N o v i c e E x p e r i e n c e d N o v i c e E x p e r i e n c e d N o v i c e Mean 33.2 21.7 35.8 25.3 25.6 23.3 35.5 21.1 39.4 18.4 43.4 18.4 Std. Error Mean 2.30 1.03 2.96 1.96 0.47 1.23 2.90 0.46 2.21 0.18 3.19 0.23 Median 31.5 20.0 31.5 24.0 25.0 23.0 30.0 22.0 36.5 18.0 41.0 18.0 Std. Deviation 9.21 4.13 11.83 7.08 1.86 4.77 12.98 1.21 11.25 0.52 12.35 0.85 Minimum 23.0 18.0 22.0 17.0 23.0 17.0 20.0 19.0 18.0 18.0 22.0 18.0 Maximum 47.0 32.0 65.0 38.0 31.0 32.0 61.0 22.0 58.0 19.0 66.0 21.0 Percentiles 15 24.0 18.3 27.8 18.0 24.0 17.1 23.0 19.9 29.0 18.0 36.2 18.0 Percentiles 85 45.5 25.5 47.0 35.2 26.0 28.0 56.2 22.0 54.0 19.0 57.1 19.0 Number 16 16 16 13 16 15 20 7 26 8 15 14 GB, big sim FR GB IL IT SE