VT
/s
ä
149
1989
The impact of simple car and driver variables
in discriminating between fast and slow
subgroups of two speed populations
Lisbeth Harms, Gunilla Rudander, Roger Johansson
and Gunnar Carlsson
Reprint from the International Symposium on Driving
Behaviour in a Social Context, Paris 16 - 18 May 1989
TVäg00/1 Efi/( Statens väg- och trafikinstitut (VTI) + 581 01 Linköping StltllIBt Swedish Road and Traffic Research Institute * S-581 01 Linköping Sweden
__"1/särtryck
149
1989
Theimpactofsimple caranddrivervariables
in discriminatingbetween fastandslow
subgroups oftwo speedpopulations
LisbethHarms, GunillaRudander,RogerJohansson
andGunnarCarlsson
ReprintfromtheInternationalSymposiumonDriving
BehaviourinaSocialContext, Paris 16-18May 1989
dfvG
v Veg-och Traf/Ir-
Statens väg- och trafikinstitut (VT!) * 581 01 Linköping
Summary
Previous studies of individual variations in driving speed indicate that car and driver characteristics are important determinants of vehicle speed. This study investigates the importance of simple driver and car variables in discriminating between fast and slow drivers in two different speed populations. One population was selected and preclassified on the basis of drivers' speed behaviour on Swedish motorways (overtaken/overtaking). The other population included drivers' ratings of their maximum accepted speed on Swedish highways, reported to a questionnaire. The speed classes of the survey populations were based on the median of drivers' speed ratings. The relative importance of the variables driver age, driver sex, car age and weight-power ratio to the discrimination between the speed classes was evaluated using discriminant analysis.
The variable driver age was found to influence the discriminant functions of the two populations strongly, though the relative importance of this variable differed between the discriminant functions of the two populations. While the variable driver age was of crucial importance in the discriminant function developed on the basis of the survey population, driver age and car age were weighted equally in the discriminant function of the motor-way population.
The obtained results were related to the difference between the two populations due to the variation in sampling methods and variations in the methods of speed registration. The methodo-logical difference was found to have a minor influence on the efficiency with which the speed population could be classified.
2 Lisbeth Harms
Introduction
Individual variations of driving speed have been attributed to such simple driver characteristics as age and sex. Though de-viant results have been reported (Rothengatter & de Bruin, 1986) the main body of empirical evidence indicates that speeding is associated with the young driver and especially with the young male driver (Wasielewski, 1984, Cowley, 1983, Wasielewski & Evans, 1983). Young men with limited driving experience also rate their own ability to drive fast as better than the average driver's (Spolander, 1983) .
Car characteristics is another factor which has been found to influence individual variations of driving speed. Both newer and more powerful cars have been found to maintain higher speeds than older and less powerful ones (Wasielewski, 1984, Smeed,
1973) .
In general, these previous findings are consistent with the assumption that the younger the observed driver and the newer or more powerful the observed car the higher is the driving speed to be expected.
This study aimed at determining the relative importance of sim-ple driver and car variables in discriminating between fast and slow individuals in different speed populations.
According to the previous findings it may be assumed that car and driver factors are important general determinants of vehicle speed. Thus the influence of car and driver factors should be assumed to appear independent of the observed road types or speed limits. By the same argument it may be expected that the influence of car and driver factors should be found across a variety of research methods.
Characteristics of the two speed populations.
The study included two different speed populations initially collected for other research purposes. The methods used for sampling the populations were quite different, so was the methods of speed registration, and also the considered road types and speed limits differed.
Population 1.:;: The population included a total of 439 cars ob-served on Swedish motorways. An observer was seated in a car maintaining a constant driving speed of 110 km/h which is the
legal speed limit on Swedish motorways. The observer judged the age and the sex of drivers and reported the registration number of two classes of cars:
(a) cars that were overtaken by the observer, which implied that the speed of the overtaken car had been below the legal speed limit on motorways, and
(b) cars that overtook the observer and thereby had exceeded the legal speed limit.
The age of the drivers were classified by the observer into three age groups: young drivers (up to approx. 25 years), middle aged drivers (approx. 25-60 years) and old drivers (above approx. 60 years). Detailed car information based on the registration numbers of the observed cars were provided by the Swedish car register.
Population 2.: The population included a total of 1588 drivers, which had responded to a questionnaire concerning their general speed motives and speed preferences. The respondents included in this study had provided complete information about their age and sex and the age, weight and power of the car they normally used. Additionally the respondents had rated the maximum speed they would accept themselves to drive "on a 90-road (a highway with a speed limit of 90 km/h) in daylight with low traffic density". Thus both populations contained information about the drivers' sex and age and the weight, power and age of the car used by the driver. The variables weight and power were transformed to the variable weight-power ratio that has been found to be a reliable measure of car performance. The highest correlation between variables were found for weight-power ratio and car age; for the survey population this correlation was 0.30, for the motorway population it was 0.45.
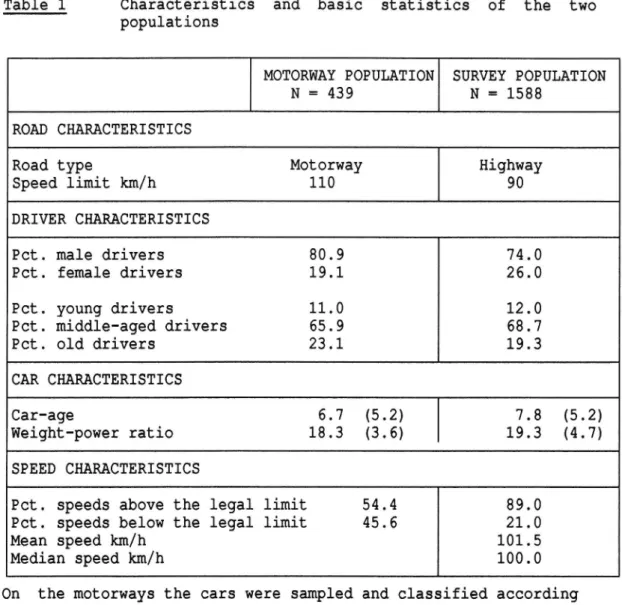
The basic statistics of the two populations (Table 1.) showed that the mean values of the variables in two samples were at the same level. The speed information, however, differed consider-ably due to the different sampling methods.
4 Lisbeth Harms
Table 1 Characteristics and basic statistics of the two populations
MOTORWAY POPULATION/ SURVEY POPULATION N = 439 N = 1588
ROAD CHARACTERISTICS
Road type Mot orway Highway Speed limit km/h 110 90 DRIVER CHARACTERISTICS
Pet. male drivers 80 . 9 74 . 0 Pet. female drivers 19.1 26.0 Pet. young drivers 11.0 12.0 Pet. middle-aged drivers 65 . 9 68 . 7 Pet. old drivers 23.1 19.3 CAR CHARACTERISTICS
Car-age 6.7 (5.2) 71.8 (5.2) Weight-power ratio 18.3 (3.6) 19.3 (4.7) SPEED CHARACTERISTICS
Pet. speeds above the legal limit 54 . 4 89.0 Pet. speeds below the legal limit 45 . 6 21.0 Mean speed km/h 101 .5 Median speed km/h 100 . 0 On the motorways the cars were sampled and classified according to their driving behaviour, either they overtook or they were overtaken. The overtaking cars exceeded the speed limit and were judged fast, the overtaken cars were below the legal speed limit and they were judged slow.
The drivers responding to the questionnaire estimated the high-est driving speed they were likely to accept when driving on a highway with a speed limit of 90 km/h. The drivers' ratings of their driving speed was typically given in a rounded form and were within the range 80-160 km/h. The median speed of 100 km/h was used for separating individuals in a slow and in a fast sub-group.
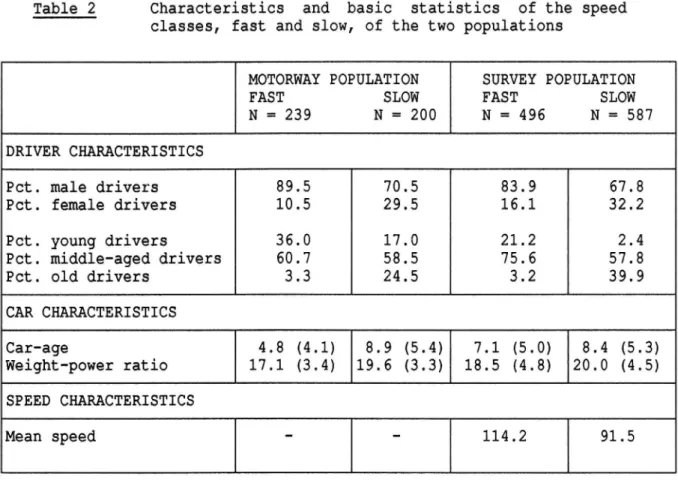
The difference between the speed classes of the two populations (Table 2.) showed that speed classes of the motorway population were more extreme than were the speed classes of the survey population.
Table 2 Characteristics
classes, fast and slow, of the two populations
and basic statistics of the speed
MOTORWAY POPULATION SURVEY POPULATION FAST SLOW FAST SLOW N = 239 N = 200 N = 496 N = 587 DRIVER CHARACTERISTICS
Pet. male drivers 89.5 70.5 $3,9 67.8 Pet. female drivers 10.5 29.5 16.1 32.2 Pet. young drivers 36.0 17.0 21 . 2 2 . 4 Pet. middle-aged drivers 60 . 7 58.5 75.6 57.8 Pet. old drivers 3.3 24 . 5 3 . 2 39.9 CAR CHARACTERISTICS Car-age 4.8 (4.1) 8.9 (5.4) 7.1 (5.0) 8.4 (5.3) Weight-power ratio 17.1 (3.4) [19.6 (3.3) 18.5 (4.8) |20.0 (4.5) SPEED CHARACTERISTICS Mean speed =- =- 114 . 2 91.5
In general the variable means for the two speed classes sup-ported the assumption that driving speed is influenced by both driver and car characteristics. The motorway population reflect-ed a more extreme difference between car variables of the speed consistent for both classes but the general tendency was
samples. This tendency was in accordance with the findings of previous authors that young drivers, male drivers, newer and more powerful cars tend to maintain higher driving speed than the average.
The differences in variable means between the speed classes, however, provide no information about the relative importance of driver and car variables in discriminating between the speed classes.
Discrimination between speed classes
The impact of each variable in discriminating between the two speed classes was estimated by developing a discriminant func-tion determining the standardised weight of each variable according to its relative contribution to the discrimination between speed classes. The discriminant function also served the
6 Lisbeth Harms
computation of a mean discriminant score (cutting score) used for the classification of observations in the speed class according to their discriminant scores.
The discrimination between speed classes was based on the dis-criminant function generated by the motorway population. The analysis aimed at determining whether the observations of the two different populations could be classified equally well with the same discriminant function.
Discrimination based on the discriminant function of the motorway population
The cars observed on motorways were randomly divided into two subsamples. One of the subsamples was used for generating the discriminant function. The mean discriminant score was used for the classification of the other subsample (the holdout sample) of the motorway population.
By this procedure the efficiency of the discriminant score in predicting the speed classes within the population was tested. The generality of the discriminant function was then tested by using the same discriminant function to predict the speed classes of the survey population.
Results
The standardised discriminant weights obtained for the four variables in the motorway population were:
Car age: 0.69, Weight-power ratio: 0.32, Driver age: 0.61, Driver sex: -0.48.
These weights indicated that the age of the car and the age of the driver were of almost equal importance and both more import-ant to the discrimination between the speed classes of the motorway population than were the weight-power ratio and the drivers' sex.
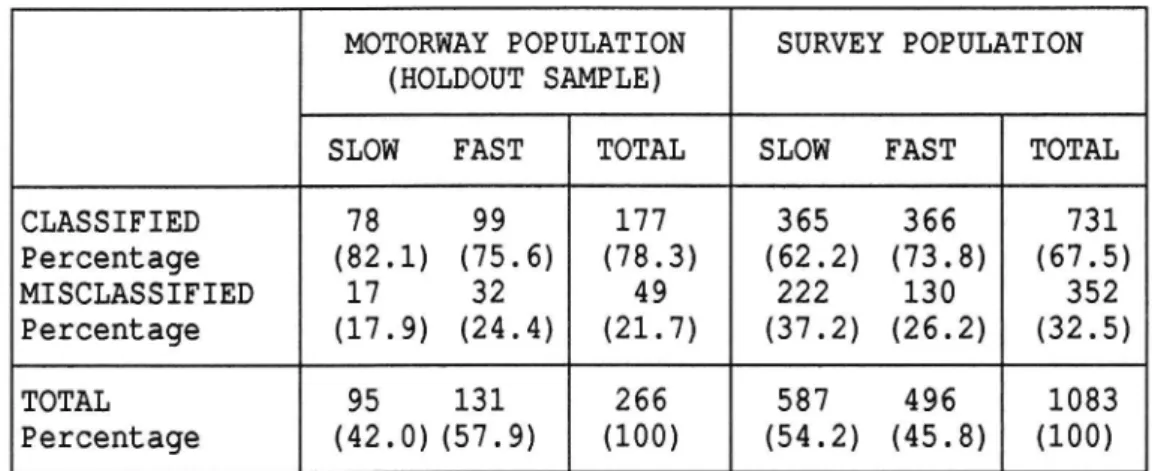
The obtained mean discriminant score used for classifying the observation in the holdout sample resulted in a total of 78.3 pet. correctly classified observations.
The mean discriminant score of the survey population was found to differ considerably from the mean score of the motorway population. The difference was accounted for by adjusting the
discriminant score to the mean score of the survey population. The classification of the survey population based on the adjust-ed mean score resultadjust-ed in a total of 67.5 pet. correctly classi-fied observations.
Table 3 Classification of the observations of the two popula-tions based on the mean discriminant score of the Motorway population
MOTORWAY POPULATION SURVEY POPULATION (HOLDOUT SAMPLE)
SLOW FAST TOTAL SLOW FAST TOTAL CLASSIFIED 78 99 177 365 366 731 Percentage (82.1) (75.6) (78.3) (62.2) (73.8) (67.5) MISCLASSIFIED 17 32 4 9 222 130 352 Percentage (17.9) (24.4) (21.7) (37.2) (26.2) (32.5) TOTAL 95 131 266 587 496 1083 Percentage (42.0) (57.9) (100) (54.2) (45.8) (100)
The finding that the efficiency of the classification based on the mean discriminant score of the motorway population differed for the two populations (y? = 11.01, p 2.001) indicated that the variation in the speed classes of the two populations could not be accounted for solely by the adjustment of the mean discriminant score.
Considering the differences associated with both the sampling and speed registration methods, substantial differences between the populations may be expected to influence the discriminant functions of the two populations. It is quite possible that drivers' ratings of their maximum speed depended more on the characteristics of the respondents than on their cars. The con-tribution of the car to the production of the speed observations on the motorways, however, is incontestable.
The basic difference between the speed registration methods then may result in different discriminant functions for the two populations. Consequently, it might be expected that the classification of the survey sample should be improved by using the discriminant function of this population to predict the speed classes.
8 Lisbeth Harms
Discrimination based on the discriminant function of the survey population
The survey sample was randomly divided into two subsamples the same way as was previously the motorway population. One of these subsamples was used for computing the discriminant function. The other subsample served the test of the discriminant score within the sample. In accordance with the previous analysis the gene-rality of the discriminant function was tested by applying the mean discriminant score on the other population (the motorway population) with due adjustment to the mean discriminant score of this population.
Results
The standardised discriminant weights obtained for the four variables were:
Car age= 0.19, Weigh-power ratio= 0.09 Driver age= 1.10 and Driver sex= -0.44.
These standardised discriminant weights indicate that the vari-able driver age was of crucial importance in discriminating between the speed classes of the survey populations. The drivers' sex was found to be less important and both the car variables ranged low.
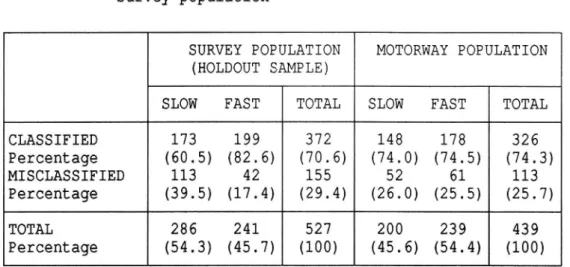
Table 4. shows the classification resulting from the application of the mean discriminant score on the two populations. According
Table 4 Classification of the observations of the two popula-tions based on the mean discriminant score of the Survey population
SURVEY POPULATION MOTORWAY POPULATION (HOLDOUT SAMPLE]
SLOW FAST TOTAL SLOW FAST TOTAL CLASSIFIED 173 199 372 148 178 326 Percentage (60.5) (82.6) (70.6) (74.0) (74.5) (74.3) MISCLASSIFIED 113 42 155 52 61 113 Percentage (39.5) (17.4) (29.4) (26.0) (25.5) (25.7) TOTAL 286 241 527 200 239 439 Percentage (54.3) (45.7)] (100) (45.6) (54.4) (100)
to Table 4. the discrimination between speed classes of the sur-vey populations was slightly improved, from 67.5 pot. to 70.6 pot., whereas a slight decrease was found for the classification of the motorway population, from 78.3 pot. to 74.3 pct. when compared to the corresponding classification of the two popula-tions based on the discriminant score of the motorway popula-tion.
The discriminant score of the survey population showed no difference in efficiency for the classification of observations of the two populations. The finding that 70.6 pot. of the survey population (holdout sample) and 74.3 pct. of the motorway popu-lation were classified correctly indicated that in general the discrimination between the speed classes of the motorway popula-tions was superior to the discrimination between the speed classes of the survey population regardless of the discriminant score used for the classification.
Final Discussion
In accordance with previous findings the variable driver age was found to have a strong impact on individual variations of driving speed.
The basic difference between the two populations due to the methodological variations, however, resulted in different discriminant functions. While driver age was the only variable of crucial importance in the discriminant function developed on the basis of the survey population, the discriminant function based on the motorway population weighted the two variables car age and driver age almost equally. Both discriminant functions were found to perform relativly well in discriminating between the speed classes of the two different populations.
The difference between the discriminant functions indicated that the impact of a driver's age on driving speed may vary in different speed populations.
The relative influence of driver age might depend on either the specific sampling method or the method of speed registration. It may be speculated whether the obtained results were due to the variations of speed registrations methods. Although in the sur-vey study the drivers had informed about the car they normally used, their ratings of their maximum accepted driving speed were
10 Lisbeth Harms
related solely to road characteristics. Thereby the drivers might have rated their maximum accepted speed independent of the characteristics of their car. On motorways the observations of car and driver was conducted simultaneously consequently also stronger influence of the car should be expected.
It is also possible that the impact of driver age on driving speed was influenced by the difference in sampling methods. The observations on motorways, it may be argued, represented more extreme speed differences between slow and fast observations than did the survey sample. The influence of the car then might be stronger for more extreme than for less extreme speed variations.
Finally all driving speeds included in this study were related to low traffic density and high road standards. It may be questioned to which extent the impact of driver age on driving speed would be influenced also by variations of road standards and traffic density.
References
Cowley, J.E. Characteristics of the speeding driver. Road Traffic Authority, Victoria. Report no.8, 1983.
Rothengatter, T. & R. de Bruin: The influence of drivers' atti-tudes and vehicle characteristics on speed choice on highways: Safety consequences. Int. Journal of Vehicle Design, pp. 135-144, 1986.
Smeed, R.J.: An examination of the results of some observations of driver behaviour. Conference Paper, Zurich, 1973
Spolander C.: (in Swedish) Drivers! assessment of their own driving ability. Swedish Road and Traffic Research Institute report nr 252, 1983.
Wasielewski P. & L. Evans: Do drivers of small cars take less risk in everyday driving. Research Publication, Transportation Research Department, 1983.
Wasielewski, P.: Speed as a measure of driver risk: Observed speeds versus driver and vehicle characteristics. Accident Analysis & Prevention vol 16 nr. 2 pp. 89-103, 1984
Acknowledgement
This study was conducted with grants from the Swedish Transport Research Council (TFB) .