Postprint
This is the accepted version of a paper published in Journal of Advances in Chemistry. This paper has
been peer-reviewed but does not include the final publisher proof-corrections or journal pagination.
Citation for the original published paper (version of record):
Sadeghi, M., Dorodian, M., Rezaei, M. (2013)
Synthesis and Characteristic of Precipitated Nano-Silica.
Journal of Advances in Chemistry, 6(1): 917-922
Access to the published version may require subscription.
N.B. When citing this work, cite the original published paper.
Permanent link to this version:
Synthesis and Characteristic of Precipitated Nano-Silica
1st M. Sadeghi, 2nd M. Dorodian
,3rd M.Rezaei
1st Sharif Nano Pigment Co. (SNP), institute of colorants, paints& coatings (ICPC), Technology development institute (ACECR), Tehran, Iran
mohammad.sadeghi@mdh.se
2ndTechnology development institute (ACECR), Tehran, Iran
mdourodian@gmail.com
3rd Sharif Nano Pigment Co. (SNP), institute of colorants, paints& coatings (ICPC)
Masoomeh.62@gmail.com
Abstract:
The reaction of precipitation of amorphous silicon dioxide from aqueous solution of sodium silicate and sulfuric acid has been studied. The factors affecting the precipitation process of the sodium silicate solution such as sodium silicate concentration and addition of anionic surfactant (sodium dodecyl sulfate, SDS) on particle size, size distribution and degree of agglomeration of the precipitated silica were examined. The precipitation of silica from the produced sodium silicate solution was carried out using sulfuric acid at pH 7. Scaning electron microscope (SEM), transmission electron microscope (TEM) and Dynamic light scattering (DLS) have been used for characterization of the produced nano-silica. The surface area of silica was tested by oil absorption method according to ASTM standard. Results showed that the particle size of the precipitated silica gel was decreased with increasing Na2SiO3 and SDS concentrations and Particle size of about 44nm can be achieved at 20% Na2SiO3 and 200ppm SDS. But with decreasing particle size, degree of agglomeration also increased.
Keywords:
Silica nanoparticles; precipitation; particle size; sole gel
Academic Discipline And Sub-Disciplines
Materials ScienceSUBJECT CLASSIFICATION
Chemistry Subject ClassificationTYPE (METHOD/APPROACH)
Experimental study-nano fildCouncil for Innovative Research
Peer Review Research Publishing System
Journal:
Journal of Advances in Chemistry
Vol. 6, No. 1
editor@cirworld.com
1. Introduction:
Producing of fine and uniform precipitated silica is of interest in scientific and technological point of view. Silica nano particles are used in wide range of application including filler in tires, catalyst, toothpaste, wet absorbent materials. Moreover, silica nano particles are used in many fields such as ceramics, chromatography, electronic substrates, thermal and electrical insulators, humidity sensors and optoelectronic devices [1-4].
Many investigator implemented sodium meta silicate and some kind of acid as reactive substances for sol-gel preparation of silica particles [5, 6]. Particle size and particle distribution are very important characteristic of precipitated silica during its usage. Among affective parameters, concentration of reactive substances has a great effect on the particle size and size distribution of precipitated silica. Controlling the particle size and distribution in sol precipitation continues to be a major concern in the production of advanced ceramics. According to the Bogush and Zukoski’s model [1, 4], which describes the particle growth of silica in sol precipitation, stable silica particles are formed and grown via the aggregation of primary particles that are nucleated in a supersaturated solution. Therefore, the particle size and distribution change significantly according to the solvent, solution pH, and reactant concentrations, all of which affect the nucleation and aggregation of the primary particles. A multi-modal particle size distribution can be obtained by modifying the particle nucleation and growth processes via varying the reactant concentrations. Surfactants are often applied to the sol-precipitation process to control the size and uniformity of silica particles. A uniform particle size originates from the molecular interaction with the surfactant provides the driving force for particle aggregation [7-9].
In this work, two factors affecting the precipitation process of the sodium silicate solution such as; sodium silicate concentration and addition of anionic surfactant (sodium dodecyl sulfate, SDS) on the particle size, size distribution and degree of agglomeration of the precipitated silica were studied.
2. Experimental procedure
Silica was obtained in precipitation reaction from aqueous solution of sodium metasilicate and Sulfuric acid. Sodium dodecyl sulfate (SDS) was used as a surfactant. The precipitation reaction takes place according to Eq.1.
Na2SiO3 + H2SO4 → SiO2.H2O + Na2SO 4 (1)
At first aqueous solutions of sodium metasilicate with 10, 15 and 20 (wt.%) concentrations of sodium metasilicate were prepared. Exact amount of SDS according to table.1 was added to each solution. Then the solution was heated up until the temperature 850C was reached. At the same time it was stirred with propeller at 500rpm to obtain a homogeneous solution. The precipitation of silica was carried out by sulfuric acid. The acid with 4% concentration was added gradually to the solution until pH10 was attained. Then acid with 1% concentration was added until pH7 was reached. The resulting suspension was mixed for additional one hour. The silica gel formed was washed with deionized water and dried. Drying was carried out with spray dryer (BUCHI Mini Spray Dryer B-191). Each experiment was carried out three times to eliminate probable mistakes. The surface area of the silica was measured by oil absorption method according to ASTM D 281-95 standard. Nine experiments were carried out in order to evaluate the effect of metasilicate and SDS concentrations on the particle size and size distribution of precipitated silica according to the table 1.
Table.1: mean particle size and oil absorption of SiO2 at different reactant concentration
Experiment number Meta silicate concentration (wt.%) SDS concentration (ppm) Mean particle size (nm) Standard deviation (nm) Oil absorption (gr oil/100gr silica) 1 10 0 1140 1220 42 2 10 100 1030 1130 79 3 10 200 850 690 83 4 15 0 1010 980 77 5 15 100 620 830 98 6 15 200 160 70 146 7 20 0 220 105 137 8 20 100 170 80 179 9 20 200 74 38 296
The produced silica was studied by scanning electron microscopy (SEM) and transmission electron microscopy (TEM) in order to obtain data on particle size, particle size distribution, particle shape and degree of agglomeration. Images obtained from electron microscopy were evaluated with image analyzer software and particle size and particle distribution of the particles were determined. For more precise measuring of particle size and particle distribution of silica particles which was obtained from optimum condition, dynamic light scattering (DLS) method was used.
3. Results:
Production of precipitated silica nano particles from sodium silicate solution with sulfuric acid at pH7 is according to the Eq No.1. The effect of two variables (sodium silicate concentration and SDS concentration) on the particle size of precipitated silica was studied and the results are presented in Table.1.
3.1 Effect of sodium silicate concentration
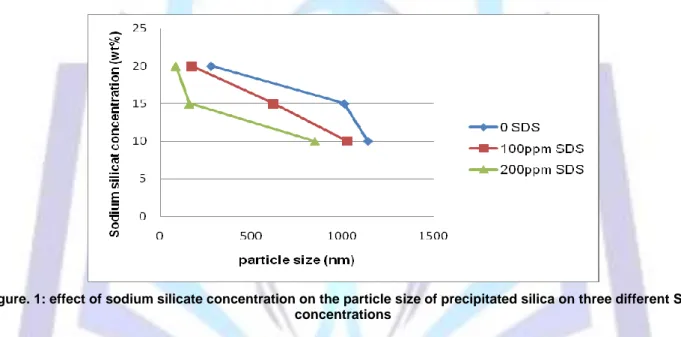
Fig.1 illustrates the effect of sodium silicate concentration on the particle size of precipitated silica at constant SDS concentrations. From this figure, the particle size of precipitated silica decreases with increasing of sodium silicate concentration at different concentrations of SDS. Results show that sodium silicate concentration has great effect on the precipitated silica size. With increasing concentration of sodium silicate from 10 (wt.%) to 20 (wt.%), the average size of precipitated silica decreases from 1030nmto 170nm at 100ppm SDS and from 850nm to 74nm at 200ppm SDS. The change in the particle size can be attributed to the change of the nucleation and growth rates of the produced silica particles. Increasing of sodium silicate concentration led to increase the nucleation rate of the formed silica particles which increase the fine particles as well as increasing growth rate of already silica particles.
Figure. 1: effect of sodium silicate concentration on the particle size of precipitated silica on three different SDS concentrations
Fig. 2 shows SEM images of precipitated silica with 10 (wt.%) and 20 (wt.%) concentrations of sodium silicate at constant 200ppm of SDS. From this figure, it can be seen that particle size of silica deceases with increasing metasilicate concentration. Agglomeration of silica particles produced at 20 (wt.%) metasilicate and 200 ppm SDS is observed in this figure.
Figure.2: image of precipitated silica with a) 10 (wt.%) concentration and b) 20 (wt.%) concentration of sodium silicate at constant 200ppm SDS
3.2 Effect of SDS concentration:
Fig.3 indicates the effect of SDS concentration on the particle size of precipitated silica. It can be observed that SDS concentration has significant effect on the particle size of precipitated silica at constant sodium silicate and sulfuric acid concentrations. For example the mean size of the silica particles decreases from 220nm to 74nm with increasing of SDS concentration from 0 to 200ppm at constant 20 (wt.%) concentration of sodium silicate.
According to the theory of homogeneous nucleation, the nucleation rate increased as the interfacial surface tension decreased. As the surfactant dramatically lower the surface tension, their presence in solution strongly increases the nucleation rate, and the particle size decreased. This means that SDS, as surfactant, is playing an important role in modifying the size of the particles. Addition of SDS surfactant increases the nucleation rate and increases the growth rate through networking of formed nuclei of the produced silica particles. High nucleation rate means that a high number of formed nuclei are obtained. These nuclei have relatively low chance to grow to large particles compared to lower number of formed nuclei which grow under the same conditions. However, at high surfactant concentration, the surfactant molecules forming micelles, therefore, high attraction force was obtained.
Figure.3: effect of SDS concentration on the particle size of precipitated silica
3.3. Characteristic of produced precipitated silica:
Fig. 4 represented XRD analysis of the produced silica. It observed that the produced silica was amorphous.
Figure. 4: XRD analysis of the produced silica
The building block of silica is the SiO4 tetrahedron, four oxygen atoms at the corners of a regular tetrahedron with a silicon ion at the central cavity or centroid. The oxygen ion is so larger than the Si4+ ion that the four oxygen atoms of a SiO4 unit are in mutual contact and the silicon ion is said to occupy a tetrahedral hole. In amorphous silica, the bulk structure is determined by random packing of [SiO4]4− units, which results in a nonperiodic structure [5]. Fig. 5 shows DLS analysis of
precipitated silica. As can be seen from this graph, particle sizes are between 20nm to 110nm and most of the particle sizes are between 37nm to 58nm. The Average size of the particles is 44nm.
Figure.5: particle size distribution graph of precipitated silica obtained by DLS analysis
There is a difference between this value and the value of experiment No.9 in table.1. The reason of difference between these two values is that the methods of measuring particle size are different in each case. Because DLS analysis is more precise than image analysis results, the last value which obtained from DLS is more reliable.
X-Ray fluorescence showed that the produced silica had high purity with minor amounts of Na2O, K2O, Al2O3, and Fe2O3 (Table 2).
Table 2: XRF analysis of produced silica
Component Percentage (%) SiO2 99.3 Al2O3 0.44 Fe2O3 0.06 Na2O 0.02 CaO 0.15 K2O 0.03
4. Conclusions
Silica nano particles were produced by reaction of sodium meta silicate with sulfuric acid at pH7. Results are summarized as:
1 - Particle size of precipitated silica decreased with increasing of sodium silicate and SDS concentrations. 2 - Particle size of 44nm was achieved at 20%Na2SiO3 and 200ppm SDS.
3 - With decreasing the size of silica particles degree of agglomeration and uniform dispersity of silica particle increased. 4 - The produced silica had the following specifications; 99.3% purity, amorphous with narrow size distribution.
5. Acknowledgment
Authors wish to thank the Sharif Nano Pigment Co. (SNP) for their immense support and supply of raw retreading compounds. Also, special thanks to the members of laboratories of the institute of colorants, paints& coatings (ICPC) for their cooperation in this work.
6. References
[1] Bogush G H, Tracy M A, Zukoski C F. 1988 Preparation of monodisperse silica particles: Control of size and mass fraction. J Non-Cryst Solids; 104: 95–106.
[2] Kaushik P, Rajasekar R, Kang D J, Zhang Z X, Samir K Pl, Chapal K D, Kim J K. 2010 Effect of fillers on Natural Rubber/ High Styrene Rubber blends with nano silica Morphology and Wear. Materials and Design; 31:677-686. [3] Davies G L, Barry A, Gunko Y K. 2009 Preparation and size optimisation of silica nanoparticles using statistical
analyses. Chemical Physics Letters ; 468 : 239–244.
[4] Bogush G H, Zukoski C F. 1991 Studies of the Kinetics of the Precipitation of Uniform Silica Particles through the Hydrolysis and Condensation of Silicon Alkoxides. J Colloid Interface Sci; 142: 19–34.
[5] Hessien M M, Rashad M M, Zaky R R, Abdel-Aal E A, El-Barawy K A. 2009 Controlling the synthesis conditions for silica nanosphere from semi-burned rice straw. Materials Science and Engineering B; 162:14–21.
[6] Li X, Zhi Cao, Zhang Z, Dang H. 2006 Surface-modification in situ of nano-SiO2 and its structure and tribological properties. Applied Surface Science; 252: 7856–7861.
[7] Arriagada F J, ] Osseo-Asare K. 1992 Phase and dispersion stability effects in the synthesis of silica nanoparticles in a non-ionic reverse microemulsion. Colloids and Surfaces; 69:105-115.
[8] Osseo-Asare K, Arriagada F J. 1990 Preparation of SiO2 nanoparticles in a non-ionic reverse micellar system. J Colloids and Surfaces; 50: 321–339.
[9] Yamauchi H, Ishikawa T, Kondo S. 1989 Surface characterization of ultramicro spherical particles of silica prepared by w/o microemulsion method. Colloids and Surfaces; 37: 71-80.