Engineering Structures 231 (2021) 111765
Available online 23 January 2021
0141-0296/© 2021 The Authors. Published by Elsevier Ltd. This is an open access article under the CC BY-NC-ND license (http://creativecommons.org/licenses/by-nc-nd/4.0/).
Full scale finite element modelling and analysis of the 17th-century warship
vasa: A methodological approach and preliminary results
R. Afshar
a,*, N. Alavyoon
a, A. Ahlgren
b, E.K. Gamstedt
a aDivision of Applied Mechanics, Department of Materials Science and Engineering, SE-75101 Uppsala, Sweden bSwedish National Maritime and Transport Museums, the Vasa Museum, Stockholm, SwedenA R T I C L E I N F O Keywords:
Finite element modelling Cultural heritage Wooden structure Numerical model
A B S T R A C T
Aging wooden structures in cultural heritage will inevitably need an improved support. A sensible design ne-cessitates a numerical model of the structure to estimate stresses and displacements in order to evaluate a support design. In the present work a full-scale finite-element model of the 17th-century warship Vasa has been devel-oped. Experiences from this exercise may be of use in making choices in the development of numerical models for other complex wooden structures of significance in cultural heritage.
A geometrical model of the ship was provided by the museum as a wireframe model, consisting of only lines, points and curves. It was developed based on geodetic measurements using a total station and hand measure-ments of details with tapes and rules. From this wireframe model, a three-dimensional model comprising solid bodies for solid-like parts (i.e. the three-layer main hull and keel), surfaces for the shell-like components (deck planks) and lines for beam-like constituents (deck beams) was developed. This geometric model was then im-ported into finite-element software ANSYS, for further development of the stiffeners (knees, riders), pillars and masts as one-dimensional elements, adjustment of the correct location of deck beams and, finally, structural analyses of the entire ship.
Since only the deformed geometry of the ship is known, the stresses and displacements were determined as a result of the self-weight and boundary conditions at support contacts only. The stresses in the three-layer main hull are lower than those in the other members. The displacements are determined from the reference state with zero gravity to the situation where the self-weight and the reaction forces from the support structure give rise to stresses and additional deformations.
According to the geodetical measurements, visual observations and calculation of the centre of mass distri-bution, the maximum movement of the ship is at the stern. The displacements from the finite-element model are in general agreement with the observations, with the more pronounced displacement field towards the heavier stern of the ship. In addition, the highest stresses at the keel, the three-layer main hull and pillars in the orlop and storage decks appear to be at the stern in the numerical model.
1. Introduction
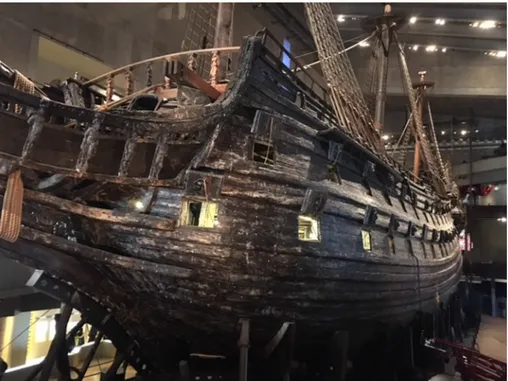
The 17th-century warship Vasa, shown in Fig. 1, is the largest wooden ship salvaged from the seabed and conserved. The ship sank in Stockholm harbour on its maiden voyage in 1628. After being salvaged in 1961, the ship underwent a pioneering conservation program for 26 years. Since 1990, the ship has been on display to the public at the Vasa Museum, which has since become the most visited maritime museum in the world [1]. Vasa is a monumental structure. It is the equivalent of a seven-story building. It is estimated to weigh between 800 and 1200
tonnes. The length of the ship is 69 m, including the bowsprit, its height at the stern is 19.4 m and its maximum width is 11.4 m [1]. Currently, it suffers from increasing deformation over time, caused by creep in the wood members, time-dependent deformation of joints and damage accumulation due to chemical degradation and the softening effect from polyethylene glycol (PEG) impregnation [2]. Vasa, currently, sits on a steel support rig of 18 pairs of cradles connected by large I-beams. Wooden wedges between the cradles and the hull must be adjusted periodically in order to provide good contact and even support. The weight of the ship is therefore concentrated at point loads, which has * Corresponding author.
E-mail address: reza.afshar@angstrom.uu.se (R. Afshar).
Contents lists available at ScienceDirect
Engineering Structures
journal homepage: www.elsevier.com/locate/engstructhttps://doi.org/10.1016/j.engstruct.2020.111765
resulted in the sagging of the weakened wood structure between the cradles and the crushing of the keel. Therefore, an objective set by the Vasa Museum as part of a larger project to secure the long-term stability of the structure was to use the mechanical and chemical data of the construction material, which is primarily oak (Quercus robur and Q. petraea), to create a full-scale three-dimensional (3D) finite element (FE) model of the entire ship as an analytical tool to be used in the design of an improved support structure.
There are few full-scale tests regarding preservation of cultural heritage structures, in particular those made of timber [3–10]. The finite-element (FE) modelling has been the overwhelmingly preferred method of analysis since it has become a generally available technique [11]. This also includes modelling the design of new improved support structures for historical cultural heritage constructions,where direct experimental testing is generally not possible [8].
FE modelling has been used before to analyse historical structures in cultural heritage. Testing and FE modelling of a replica can be useful to estimate the joint stiffness if the valuable structure itself is not available for mechanical testing. One example related to the present work is the FE model of a section of Vasa, which was developed to be compared with experimental tests performed on a full scale replica of a hull section containing representative joints [3]. Three independent loading condi-tions were therefore investigated, namely bending-compression, rota-tion and in-plane shear. The normal penalty stiffness was used for calibration of the FE model with regard to the experimental results [3]. Another example is the correlation and calibration between experi-mental test and FE analysis of a full scale wooden replica of a building by comparison of both eigenmodes and acceleration levels performed by Lourenço [8]. By performing a parametric evaluation of a range of properties, it was shown that the material properties of wooden beams have the largest influence on the dynamic behaviour of the finite element (FE) model.
Considering the full scale modelling of museum ships, a three- dimensional model (beam and link elements) of the entire Ebe schooner-brig as well as a two-dimensional model (plane elements) of the ship’s cross-section was developed by Invernizzi et al.[7]. Due to limited knowledge of the material and its state of conservation, the stiffness reduction of the material is adopted for the determination of the
displacements. As a result, considering the discontinuities of the planks in the three-layer main hull, the Young’s modulus of the beam elements involved in the hull was reduced significantly compared to that of the original timber. In addition, by taking the rheological behaviour of the timber into account, the magnitude of maximum displacements was in agreement with the measured value [7].
Structural analysis of HMS Victory has been performed by Fenton and Fowles [12] to assess the ship’s current structural stability. By using laser scanning followed by a number of modelling steps on a macro-scopic scale, deflections and stresses were determined. The predicted deflections were order of magnitude smaller than those observed, especially in the lower three-layer main hull planking. Observation of the stress outputs, however, showed that the ship was not in danger as the stress levels in the critical elements were well within acceptable limits in spite of the large deflections. In general, the analysis showed that the movement was mainly associated with the large deflection of the planking between the cradle supports. As a result, the need to improve the support system was emphasised [12].
A numerical modelling procedure, suitable for historic composite shell-like structures, is used by Stoyanov et al. [4] to analyse the structural behaviour of the 19th-century clipper ship Cutty Sark and her response to different load and new support conditions, various treat-ments and interventions. The full-scale ship structure is represented as a shell with in-plane (membrane) and bending (plate) stiffness co-efficients, calculated independently and based on the actual nature of the mixed iron and wood construction. By using the entire model of the ship, stresses in the iron frames of the hull and in the deck beams were calculated. The results were used to specify the critical structural regions of the ship and their interaction with the new steel support structure. Furthermore, some experimental tests by building a prototype panel representing the composite nature of the hull have been carried out. The panel is subjected to a concentrated transverse force, while fixed at the four corners. The deflection of the panel along one of its edges, where a number of strain gauges were installed, has been recorded and compared with the equivalent FE model. The average relative error between the model and the experiment for the deflection at the location of the eight strain gauges was 1.5% [4].
Considering all the above numerical models, the fact that
idealization is a part of any FE model development is evident. However, including certain details which better represent the real structure will contribute to a much more accurate model. In particular, in a wooden ship, the asymmetric geometry of the structure, the complex construc-tion, stiffeners inside the vessel, its joints, as well as the anisotropic material properties all can significantly affect the results of time dependent stress/deformation analysis.
In this study, a full-scale model of Vasa was developed to assess its current and future structural stability as well as to provide a tool for designing an improved support structure. Compared with previous studies of FE models of museum ships, the present work considers the geometry of the ship in greater detail, including the asymmetry of port and starboard sides, and uses a variety of specific element types for the different components of the hull. To the best of our knowledge, the developed FE model is currently one of the most detailed models yet constructed of a large wooden cultural heritage structure. Stress and deformation analyses can be carried out within practical timeframes using commercial FE software and a conventional workstation dedicated for computations. In the following sections, first the computer aided design (CAD) model of the ship will be explained, then, the development of the FE model will be discussed in detail. Finally, the results and validation process will be presented.
2. CAD model of the ship
The basic structure of the hull consists of a backbone (keel, stem, sternpost and transom), crossed by a large number of multi-component frames. Each frame consists of up to seven timbers, which are not fastened to each other. The central elements, the floor timbers, are clamped to the keel by the keelson, a heavy timber parallel to the keel on top of the frames. Planking on the outside of the frames and ceiling (interior planking) on the inside are fastened together through the frames by tens of thousands of treenails (wooden pegs), with some nails used at the ends of planks. Four full decks plus two partial decks at the stern are carried on beams. Beams are locked into the ceiling at their ends by positive joinery and reinforced by a complex internal structure of riders and knees, which effectively duplicate the framing on the inside of the ceiling. The beams of the two lower decks are supported at the centreline by vertical timbers, pillars, standing on the beam below or a rider. This internal structure, which helped to distribute the heavy deck loads of the ship’s 64 bronze cannon, was fastened to the main hull structure by approximately 6,000 iron bolts. Decks are pierced by a number of hatches to provide access. In all, the hull comprises thousands of separate timbers held together by tens of thousands of wooden and iron fasteners. A section of the ship showing the different structural members is found in Fig. 2.
During the restoration of the ship in the 1960 s and 1970 s, the original wrought-iron bolts and nails, which had all corroded away, were replaced with new material: mild steel for the bolts and stainless- steel screws for the nails. Several parts of the ship were reinforced with steel sub frames, notably a large framework to carry the upper transom, a beam in the stern castle to carry the mizzenmast, and a steel grid in the end of the beakhead (the long triangular platform at the bow). In the 21st century, steel construction props were added at the centreline under the beams of the upper gundeck and upper deck to carry some of their weight.
After the ship was moved into the current building, the lower masts were stepped and their standing rigging reconstructed in modern rope of hemp. The foremast and mainmast do not rest on the hull directly, but in fixtures which pass through the keel, while the mizzenmast stands on the beam noted above. The ends of the beam are bolted into the timbers at the sides of the ship. Each mast has a number of shrouds leading aft and to each side, as well as single stay leading forward. The bowsprit over-hangs the bow, and is an attachment point for the stays leading forward from the foremast and mainmast.
A wireframe model, consisting of lines, points and curves to describe
the geometry of the ship, has been provided by the Vasa Museum. It defined the edges and joints of all of the component timbers of the hull, together with a large number of sections across the exterior and the locations of more than 5,000 of the bolts holding the hull together. It was developed from geodetic measurements using a total station and hand measurement of details. From this wireframe model, a 3D model comprising solid bodies for solid-like parts (i.e. main hull and keel), surfaces for the shell-like components (deck planks) and lines for beam- like constituents (deck beams) has been developed in PTC Creo Para-metric 3.0 M060. This section briefly describes the process of creating the CAD model used for development of the FE model.
Initially, cross-sections were defined using the main deck beams as well as the beams from the stern superstructure as references, where planes were created, as shown in Fig. 3 (a). Splines were defined on the planes, which were put on points where the main hull of the wireframe model intersects with the planes. Only the visible interior and exterior surfaces were included in the model, i.e. the inner face of the ceiling and the exterior face of the planking. The three-layer main hull structure was then created by extrusion of the closed splines at each cross-section, as shown in Fig. 3 (b).
In order to define the three-layer main hull structure, onboard measurements were performed to obtain approximate thicknesses of the frames, ceiling and planking, since this was not captured by the wire-frame model as illustrated in Fig. 4. The measurements inside the ship were taken from the gun ports on the lower and upper gun decks, and near the railings on the main (or weather) deck. On the storage decks (the orlop and hold) the measurements were taken from holes in the main hull, near the keel, which had been made in the 1970 s for the ventilation system.
Due to the low height of the orlop as well as a lack of gun ports or holes from which to measure elements, only the thickness of the ceiling could be measured. However, the dimensions of the bolts in the futtocks have been documented and their lengths could be used to estimate the thickness of timbers even though some level of inaccuracy was expected since the bolts did not always pierce the main hull in a direction normal to the main hull.
The thicknesses were averaged and offsets of the splines were created, which were adjusted according to the averaged measurements of each layer at each deck in order to have smooth cross sections, and thus avoid wrinkling of the surface, which can be a source of error in
Wale Deck plank Stringer Three-layer mail hull Waterway Futtock rider Deck beam Pillars Rider Keel kKnee
Fig. 3. Modelling approach for CAD model of the entire ship; (a) vertical planes at the main deck; (b) the three-layer main hull created by extrusion of the closed splines at each cross-section.
Frame Planking
Ceiling
Fig. 4. Ceiling, planking and frame at a gun port.
meshing the volume. This improves the mesh quality and simplifies cutting of the volumes prior to the mesh generation. The sections were then extruded towards the adjacent cross-sections using the Blend op-tion in Creo (also known as loft in other CAD software) in two separate files, one for the frame and one for the ceiling and planking, in order to have the volumes separated. They were then brought together into an assembly file, as shown in Fig. 3 (b), before exporting as an initial graphics exchange specification (IGES) file into the FE software Ansys Mechanical APDL 18.2. In addition, the cross-section of each deck beam, deck plank, pillar, rider, etc. was measured at different locations on the ship and averaged values were defined in the FE model.
3. Finite element model
The geometric model, developed in Creo parametric, was imported into the finite-element software Ansys, for further development of the stiffening components (knees, riders), pillars, masts, etc. as one dimen-sional (1D) elements. Adjustment was made of the correct location of deck beams and finally structural analyses of the entire ship was carried out (see Fig. 5).
The purpose of the FE model of the entire ship is to capture the response of the ship to the current and potential future support solu-tions. The model allows the loading conditions at the global level (i.e. in the sections of the entire ship such as main hull, decks, keel, columns, etc) to be estimated, as well as interactions between different sections of the ship, and the reaction forces in contact areas of supports. The three main reasons why a detailed geometrical model of the ship was needed for the FE model are: First, the main load on the ship is the self-weight of the components, which depends on their volume and density. Second, the ship is markedly asymmetrical when comparing the port and star-board sides, which means that load distribution of the components must be addressed accurately. This is particularly important in the stern re-gion, where maximum movement of the ship has been observed. Third, the thickness of the main hull varies in all cross-sections along the length of the ship. Therefore, a range of information sources on the ship, including the wireframe model, on-board measurements, drawings, etc. was used to develop the model as accurately as possible. A longitudinal
cross-section of the ship, comparing the FE model with the drawings provided by Vasa Museum is shown in Fig. 6.
In the following sections, relevant information is presented regarding the finite element model developed in Ansys for the structural me-chanics simulations. A brief introduction of the material properties used is presented, followed by the definitions of various elements, and the boundary conditions for the supporting cradle.
3.1. Material properties
The creep properties of the PEG-impregnated archaeological wood material have only been scantly investigated despite their importance to long-term dimensional stability. The stiffness characterization of timber is challenging due to its inherent anisotropy, time dependent response, moisture sensitivity and variation between, and within, samples [13]. In addition, the Vasa oak has a unique nature due to factors such as aging, chemical degradation, PEG content etc. The waterlogged Vasa oak has been impregnated with PEG to prevent cracking and deformation during drying. Both the aging [14] and the PEG impregnation [15,16] have affected the mechanical properties [13]. Hoffmann [17] performed creep and relaxation bending experiments on wooden planks from PEG- impregnated oak wood from the Bremer Cog ship and compared with sound seasoned oak wood. The effects of moisture content, temperature and PEG on creep behaviour of Vasa oak have investigated by Vorobyev et al. [18]. It was shown that the variable ambient conditions have a higher impact on the moisture content in wood with higher PEG con-tents. For the Vasa oak loaded in the T and R directions, the creep behaviour is dominated by the effect of annual fluctuations in moisture and temperature. The creep behaviour in the L direction of Vasa oak show a considerable scatter for the stresses between 15% and 30% of its compression yield strength.
Considering these challenges in finding representative time- dependent material properties of the Vasa oak, the elastic properties were used in the FE model to evaluate and compare different support structures.
Timber can be regarded as a cylindrical orthotropic material on the macroscale due to the circumferential orientation of the annual rings.
The orthotropic material properties of the Vasa oak were taken from Vorobyev et al. [19] as given in Table 1. Due to limitation of mechanical testing of elements in the ship, which leads to the risk of damaging the structure, the material samples were extracted from pieces removed for ventilation shafts at the bottom of ship. The density is given in [20]. There is a significant natural variation in wood stiffness, mainly due to density and fibre orientation [21] but also the local variation in PEG content, which effectively acts as a softening plasticizer [20]. Implicitly, local moisture content and temperature influence the elastic properties, but since the museum has a well-controlled stable climate, these effects are not accounted for here. The local variation of the wood stiffness is also not accounted for, as the elastic properties chosen for the FE sim-ulations are considered to be representative average values for Vasa wood in general.
Below follows a description of the material models used in the FE model as well as a brief explanation of simplifications made for certain parts of the ship. The material (or grain) directions in a wooden block are shown in Fig. 7. Here, we only use elastic material properties to analyse the static behaviour of the ship. Ongoing work to predict future deformation and load redistributions is based on experimental creep data for Vasa wood, and will be reported later.
3.1.1. Local coordinate systems
Local coordinate systems for the elements need to be related to the polar coordinate system inherent in wood material. The fibre direction in the main load-bearing members (beams, planks, pillars etc.) is ori-ented along their length. Locally, this corresponds to the x-direction in the elements. For 1D elements used in the model, such as beam and link elements, the x-direction corresponds to the L direction, since these types of elements can really only be made with their axis parallel to the grain. In 2D elements (shell), the in-plane y-direction corresponds to the T direction. Visual observations of planks and beams show that the preferred sawing direction was along the LT plane, with the R direction being normal to the largest surface, providing the most cost-effective use of the material. For 3D elements, the z-direction therefore corresponds to the R direction of Vasa oak. The local coordinates consistently follow the orientation of the components.
Isotropic material models were used for the steel beam under the mizzenmast and the steel props under the beams. The elastic properties of the metal were acquired from [22] as well as those of the hemp ropes,
used to reconstruct the missing rigging. Since the horizontal ropes in the rigging, such as the ratlines connecting the shrouds, were not included in the model (they have no structural function), the overall density of the shrouds was increased to account for their weight.
3.2. Choice of the elements
Due to geometrical complexity, CPU constraint and time limitation, choosing adequate element types for different structural members in the ship was essential. Therefore, several validation tests were performed to help choose sufficiently accurate, yet computationally efficient ele-ments, in particular for the main hull of the ship.
In [7,12], entire ships were modelled using 1D beam elements. Although beam elements are suitable for the separate planks in the ship and have the advantage of computational efficiency, they have some disadvantages. First, not all members carry mainly uniaxial stress, but can have non-negligible stresses in 2D or even 3D. Second, it is an arduous task to define all of the components and corresponding sections as 1D elements. Third, the definition of the connection between the members is very difficult. An alternative is to use shell elements, which is a common practice to model thin to moderately thick plates. Considering ship structure, the shell element was used to model the main hull of Cutty Sark in Stoyanov et al. [4]. However, the use of classical thin shell elements is not the most suitable choice for the Vasa main hull, since there is a thickness variation in the main hull and the model needs to discriminate between the effects of an inner and outer support structure. According to the Ansys documentation [23], solid shell element gives a more accurate prediction for the case of thick shells (3 < L/t < 20, L: smaller side; t: thickness), compared to shell elements, where the accuracy is governed by the first order shear deformation theory (usually referred to as Mindlin-Reissner shell theory). According to this theory, the transverse shear strain is assumed to remain constant through the thickness [24]. In Vasa’s case, the main hull is in the thick shell range. Solid shell element has 8 nodes with three degrees of freedom (DOF) at each node, i.e. translation in 3 directions. It is nor-mally used for laminated shells or sandwich structures. The validation tests, with Vasa input parameters, showed that for sandwich thick plates with orthotropic layers and medium core-to-face stiffness ratios (1/14), results from solid and solid shell elements (three elements through the thickness) are in agreement, but shell elements provides notably more flexible stiffness results compared with the more accurate elements (solid and solid shell elements). In addition, the computational time is comparable to shell elements, when only one element is used through the thickness. At least three elements through the thickness should be defined to obtain more accurate transverse shear stresses and avoid excessively stiff results. This is because of the shape functions needed to represent the transverse shear stresses through the thickness.
The entire model was defined using a combination of line (1D), area (2D) and volume (3D) elements, namely beam and link, shell, solid shell and 3D solid elements, which are shown as an exploded view in Fig. 8. Multi-point constraints (MPC) were also used for rigid beams and contacts.
Solid shell elements of the main hull were used to account for the variation in main hull thickness. In contrast to regular shell elements, the solid shell elements allow investigation of the influence of an inner or outer support structure, owing to the out-of-plane functionality. Beam elements were used to model the members with high aspect ratios, such as deck beams, masts, keelson, columns, stiffeners and most of the beakhead. The beam elements were placed along the centre line of the physical beams in the geometric model. Effectively, this means an offset
Table 1
Orthotropic material properties of Vasa oak [19].
EL [GPa] ET [GPa] ER [GPa] GLT [GPa] GTR [GPa] GLR [GPa] υLT υTR υLR
6.75 0.35 0.60 0.33 0.14 0.62 0.69 0.30 0.37
Tangential (y, T) Longitudinal (x, L)
Radial (z, R)
Fiber direction
Fig. 7. Material (or grain) directions in wood: L, T, R stands for longitudinal, tangential and radial directions, respectively, denoted as x, y and z-direction for the local coordinate systems used in the FE model.
from the original location of the beams along the top surface of the deck planks. A similar approach to offset the beam elements has been used in [12]. Shells were used for parts where one dimension was significantly smaller than the other two, such as deck planks, wales, chainwales, and parts of the main hull where the three-layer main hull structure was not applicable (i.e. largely in the lighter structures of the stern castle). The different element types, together with examples of assigned parts are summarized in Table 2. The current FE model is comprised of more than 160 000 elements and about 202 000 nodes. With current state-of-the- art workstations, this allows for acceptable computational times. 3.3. Effect of treenails and gaps between layers in the main hull
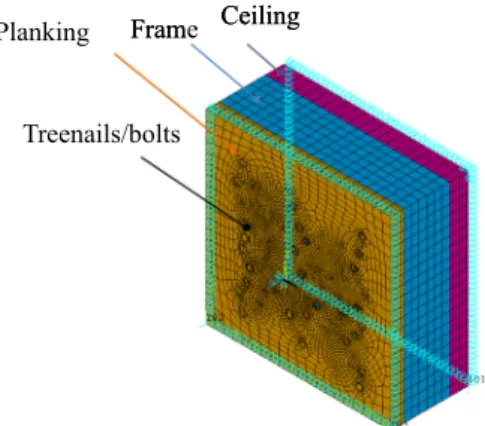
The main hull of the ship is a three-layer structure (planking, frames and ceiling) connected by a combination of original wooden treenails (about 35 mm in diameter), a few nails and occasional bolts (Fig. 9). A simplified homogenized model, as shown in Fig. 10, is needed for the main hull, since the details of the three layers and individual treenails cannot be included in the full-scale model. In this section, the procedure to account for the effect of treenails on the bending stiffness of the main hull is described. First the three-layer model, which is a simply sup-ported plate under uniform out-of-plane pressure, is explained. This model was used to investigate the effect of the treenails’ density, which has been found to vary in different parts of the main hull. Also, some of
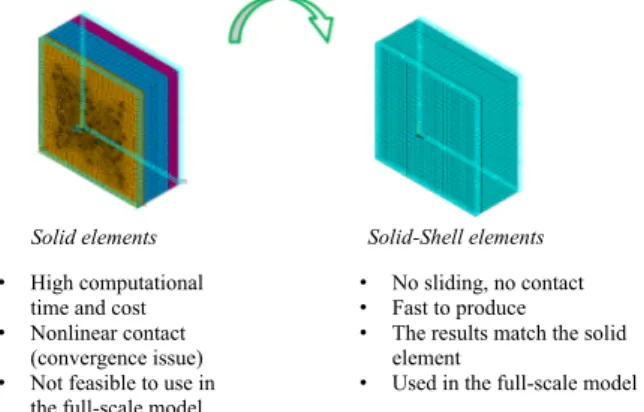
the treenails have been broken or distorted during the salvage and drying process, and therefore do not carry much load. A comparison between a detailed model (3D solid elements) and a simplified model (solid shell elements), depicted in Fig. 10, is then presented, in order to identify a suitable simplified description of the main hull’s behaviour.
As shown in Fig. 10, a detailed model of the three-layer main hull can be described as a sandwich structure with layers not attached to one another, although connected with the wooden treenails represented by 3D solid elements. Nonlinear contact is defined between different layers and at the interface between treenails and the main hull. The boundary condition was set to a simply supported quadratic plate under uniform pressure in the normal direction of the plate. The symmetry of the model is considered in the simulations. The average treenail density of the Vasa main hull is about 30 treenails/m2, exemplified in Fig. 10. Convergence issues arose with treenails too close to the boundaries, which is why
Fig. 8. Exploded view of element types chosen for various parts of the ship. The multi-point constraint elements such as rigid beams and contacts are not included.
Table 2
Element types and assigned parts.
Element type Assigned parts
Solid shell Three-layer main hull (planking, frames and ceiling) 3D Solid Keel
Shell Deck planks, wales, galleries, shelf clamps, transommain hull Beam Deck beams, beakhead, pillars, masts and various stiffeners Rigid beams Supporting metal wires at the stern and beakhead
Ceiling
Ceiling
Frame
Fram
Planking
Treenails/bolts
Fig. 9. The three-layer model used for sensitivity analysis of the treenail distribution.
there are fewer treenails along the boundaries. The effects of treenail distribution within reasonable configurations have been investigated, and were found to have only limited impact [25].
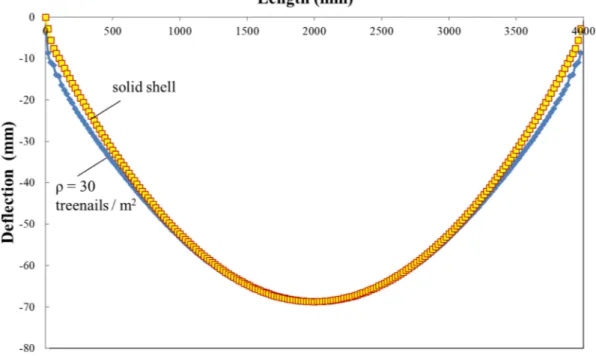
Since the details of treenails, nonlinear contact and sliding layers were not feasible for the entire main hull model for computational reasons, a simplified model with perfect stress transfer between the layers and excluding the treenails was tested using solid shell elements, and was implemented to model the main hull of the ship (see Fig. 10). In this way, the effect of treenail density on the deflection of strains of the two models can be compared (Fig. 11). The solid shell element model shows a stiffer behaviour compared with the solid element model pre-dictions. This behaviour is expected, since limited sliding between the layers was allowed by a nonlinear contact definition in the solid model. In addition, the treenail density has a direct effect on the plate deflec-tion. The current estimation is that there are ~ 30 treenails/m2 from a number of internal surfaces where treenail ends or holes are visible. Should future examinations show that the density is substantially lower and differs from place to place, the results shown in Fig. 11 indicate that the bending behaviour is affected, will need to be modified in the full- scale model.
In order to improve the solid shell model, the out-of-plane shear moduli, i.e. GTR and GLR (in local coordinates Gzy and Gzx, respectively) are scaled down by a scale factor β to fit with the more accurate solid element model (ρ =30 treenails/m2):
G*zy=βGzy (1)
G*zx=βGzx (2)
where G*
zy and G*zx are the scaled out-of-plane shear moduli of the equivalent solid shell model to fit the maximum mid-point displace-ment. The value of β = 0.40 was found to provide the closest match between the modified solid shell element and the solid element models. With this scale factor, the deflection of the plate and the strain in different directions are compared for both solid and solid shell models and found to be in good agreement except when close to the boundaries. The deflection comparison of the solid model and solid shell model is shown in Fig. 12. The bending stiffness is virtually the same, and it was therefore decided to account for the combination of lack of stress transfer between layers and presence of treenails by reducing the shear moduli of the original oak material given in [13] by a factor β = 0.40. This stiffness adjustment was not only applied to the main hull, but also to the timbers at deck beams and deck planks, which visually show significant degradation such as large cracks compared with other parts of the ship.
3.4. Effects of gaps between the planks in the main hull
Just like the treenails and gaps between the main hull layers (e.g. ceiling, frame and planking), the gaps between the planks in the indi-vidual layers, caused by drying and shrinkage of the timbers, will affect the stiffness of the main hull. The gaps mean that the planks are not bonded to one another. The mechanical implication is that there is no load transfer between the planks rather than normal compressive loading when the planks are in direct contact. Additionally, the frame members are not continuous and as a result there are some large gaps in certain parts of the ship. In order to address the effect of gaps between the planks on the rigidity of the main hull, a detailed solid model of a
Fig. 10. Homogenization of the effect of treenails on bending stiffness of the Vasa main hull comparing a detailed model (3D solid elements) and simplified model (solid shell elements).
representative section of the main hull, based on the full scale replica model [3], was tested under loads in three directions and compared with the simplified solid shell model (see Fig. 13). This geometry is repre-sentative for the main hull and with another configuration has been compared with experimental data [3]. Therefore, it is the preferred structure in fitting a simplified and more efficient model (using solid shell elements) to a more detailed one, comprised of solid element. Similar to the previous section, the idea is to scale down some of the relevant stiffness parameters of the solid shell model to obtain better agreement between the two models.
The three loading modes illustrated in Fig. 13 were simulated, with coupled nodes at the boundaries. The maximum displacements of the two models were then compared within the linear regime. Then, considering the structure of the main hull, the elastic moduli that had any significant influence on the displacements were adjusted in the solid-shell element model to give the same overall displacement as in the more refined solid element model. For the case of ceiling and planking, every other row of elements was selected, and their in-plane shear
modulus, Gxy (corresponding to GLT) and transverse modulus Ey (cor-responding to ET) were reduced by 0.03 and 0.30, respectively, to represent the gap between the planks. The row of elements was oriented along the planks, and the reduction is made on every other row to roughly represent the distribution of gaps between planks. For the case of the frame (FR), only in-plane shear modulus Gxy is reduced by a factor 0.42 in all the selected elements. The missing planks in the frame are taken into account by unselecting the corresponding elements. Using the above scale factors, the difference in displacements between the solid element model and simplified solid-shell element model is reduced to a minimum. The relative difference is as small as 0.01% in shear loading along the x-axis (see Fig. 13), 2.7% in compressive loading along the z- axis and 1.5% in rotational loading along the y-axis.
It is worth mentioning that, for the case of the Vasa hull, the non- uniform thickness of the hull, makes implementing the conventional computational homogenization approach, where the macroscopical properties can be homogenized by using a representative volume element, difficult. In addition, considering the orthotropy of the material
Fig. 12. Deflection comparison of the solid model and the solid shell model.
[E
L, E
R, E
T, G
LT, G
LR, G
TR, LT,
TR,
LR]
Solid model Solid-shell model x y zFig. 13. Comparison of a solid model main hull with an equivalent solid shell model for the main hull. The red arrows at the top of each model show the three different loading directions. (For interpretation of the references to colour in this figure legend, the reader is referred to the web version of this article.)
(which means nine independent properties), non-uniform multi-layer geometry of the hull, as well as different loading conditions leads to a multi-dimensional optimization problem. The solution for such a prob-lem, if not impossible, is very challenging. Therefore, the approach was to consider the more prominent type of loading, i.e. bending, as a loading case with a simplified geometry of the hull to investigate the effect of treenails and gaps between layers in the main hull (Fig. 10). To study the effects of gaps between the planks in the main hull, three loads in three orthogonal directions based on the real geometry of the hull are considered (Fig. 13). In term of stiffness properties, the focus was put mainly on the corresponding shear properties, because of type of loading, geometry (such as gaps between planks) and fibre direction of each layer. For example, for the case of bending loading, out-of-plane shear properties (GTR and GLR) were the most sensitive parameters to the homogenization problem. Therefore, only those parameters are reduced. For the case of effect of gaps, due to the geometry and fibre direction of each layer, the in-plane shear modulus (GLT) as well as transverse modulus (ET) were reduced.
3.5. Boundary conditions
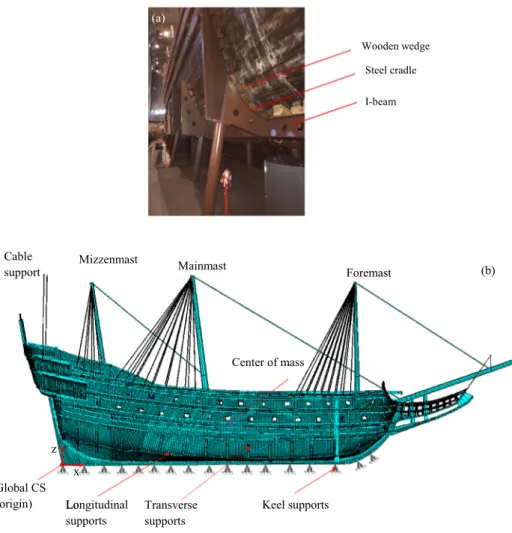
The support from the present cradles underneath the ship give rise to boundary conditions in terms of displacement. In evaluating the effects of new support structures, it is the boundary conditions that form the input in the calculations. Vasa currently sits on a steel support rig composed of 18 pairs of cradles as shown in Fig. 14 (a). They are con-nected by large I-beams. There are wooden wedges between the cradles and the main hull to distribute the load more evenly over the contact area. The current cradles with wedge packages create a pressure against
the hull sides similar to the pressure that the water applies to the ship, though localized to the wide cradle surfaces. Therefore, the distribution of the pressure from the wedge packages differs from how the water would distribute the pressure. The heights of the cradles’ end are at about the same height as the waterline of the ship and the pressure from the wedge packages also compresses the hull sides of the ship.
The present supports were defined by modelling the wooden wedges between the main hull and the current support as link elements. This means that the support is not rigid, but locally elastic. The link elements only take compression loads, which avoid negative reaction forces (tensile loads) at the support locations. In Fig. 14 (b), the boundary conditions for the current support of the ship are depicted.
Before imposing the constraints, the nodal coordinate systems (CS) were rotated to align with the surface normal to the outer planking. This rotates the z-direction to be normal to the surface of the main hull and to the normal of each cradle contact area. The same rotations were also performed for the bow. The positions of the current support elements were determined on-site with a hand-held laser measurement device. The position of the supports in the longitudinal direction and that of the innermost point of the transverse support were measured in relation to the keel. The number of planks between the supports and the lowest wales served as reference lines for the upper part of the support when importing the lines for the wales in the wireframe model to Ansys. These measurements were then used to define the boundary conditions on the nodes of the planking. One should note that the accuracy of the supports’ positions in the FE model was mainly limited by two factors: the element size of 200 mm for the main hull and inaccuracies in the measured data due to misalignment of the laser distance measuring tool.
Keel supports Transverse supports Longitudinal supports x z Lo Global CS (origin) Foremast Mainmast Mizzenmast Cable support Center of mass (a) (b) Steel cradle I-beam Wooden wedge
3.6. Centre of mass and total mass calculations
The asymmetry of the ship between the port and starboard sides is evident from the wireframe model, which is based on geodetical mea-surements. The ship geometry is shown in Fig. 15. Especially at the stern and the bow, there is a clear twisting towards the port side. This asymmetry makes the ship lean increasingly towards the port side [2]. A calculation of the centre of mass (CM) along the length of the ship is very essential when it comes to the discussion of uprighting the ship. Therefore, the ship was split up into 20 different slices along the ship as shown in Fig. 15(a). For each separate slice, the location of the CM was calculated.
The absolute weight of the ship is important as it is the self-weight that gives rise to the stresses which control the observed creep de-formations over time [18]. An improved support structure should be designed to mitigate these stresses in order to reduce the risk of irre-versible deformation. The weight can be estimated form the total vol-ume and density of the material. The geometrical model gives the total volume of the ship of 912 m3. This agrees relatively well with volume measurements in [24], which provide the total wood volume of about 925 m3.
According to [1,26,27] the total weight of the Vasa ship is between 772 and 1200 tonnes. These estimations were mainly based on Archi-medes’ principle, i.e. the weight of the ship equals the mass of the dis-placed water, which was estimated when the ship was salvaged and placed in a dock. Based on those different methods, the estimation of the weight lies between 800 and 1200 tonnes. The method of weight calculation in [24] was by manual calculation of the volume of each component and assumption of average density of 800 kg/m3 for all of the timber, which led to total weight of 762 tonnes.
The density has been determined for various components, and a large variation was found, ranging from about 713 kg/m3 (see Table 3 in [20]) to 922 kg/m3 (see Table 2 in [13]). There is limited information
available on how the density varies in the oak timber in different parts of the ship, due to differential wood degradation and diffusion of the conservation material Therefore, an average constant density of 800 kg/ m3 is assumed, representing an estimated average PEG content and average type of oak material [20,26]. The mass of the ship then becomes about 730 tonnes. By adding the equivalent load from the gun ports (4.6 tonnes) and gallery (5.4 tonnes), the total weight of the ship according to the present model is about 740 tonnes. Since the weight has not been measured directly, but appraised from estimations of the total volume and density, the accuracy of the estimate should be taken with caution. Considering the geometrical complexity and details such as the hand rails at the main deck, capstans and pump which are excluded in the model, the weight of 800–900 tonnes should be a reasonable approxi-mation at this stage.
4. Results and discussions
4.1. Centre of mass change along the ship
As a reference point, the centre point of the lower edge of the after end of the keel was chosen as the origin for the global coordinate system, as shown in Fig. 14. The x-direction lies horizontally along the keel, and the z-direction is vertical. The coordinates (x, y, z) of the CM of the entire ship with respect to this coordinate system are: CM (21198 mm, 77 mm, 5788 mm). This point is shown in the xz-plane in Fig. 14. The y coor-dinate of the CM in sections along the ship, with a fitted quadratic
(b)
(a)
(c)
port
starboard
bow
aft
y xFig. 15. (a) Overhead view showing 20 different zones used for CM calculation. (b) The corresponding deviation of the CM in the y-direction. (c) Ship main hull positions from geodetic measurements starting in year 2000 (dashed grey mesh) and ending in year 2012 (solid red line), where the relative displacements are magnified × 200. (For interpretation of the references to colour in this figure legend, the reader is referred to the web version of this article.)
Table 3
Strength values of the Vasa oak in different directions.
fL [MPa]
[14] [31] fT [MPa] f[31] R [MPa] [30] fLT [MPa] f[30] TR [MPa] f[30] LR [MPa]
trendline, is shown in Fig. 15 (b). The high gradients specifically at the stern and bow indicate an effective torsional load on the ship, which can give rise to a twist since the current support is symmetrical with respect to port and starboard. In fact, the geodetic measurement of fixed posi-tions on the main hull from 2000 to 2012 qualitatively show the same tendency, i.e. a higher tilt towards the port side in the stern and bow. The main hull meshes in Fig. 15(c) show this tilt to port from the initial geometry in grey to the final position in solid red lines. In addition to the geodetic measurements on the main hull, the inclinations of all the three masts have been calculated. The CM of three masts, the fore-, the main- and the mizzenmast- as shown in Fig. 14 (a), have deviations of 117 mm, 164 mm and 310 mm, respectively, towards the port side (in y- direction).
4.2. Stress and displacement distributions
In this section, the global stresses and displacement distributions of the entire ship are studied. Normally, such FE analyses are performed based on an undeformed body by applying boundary conditions in terms of prescribed loads and displacements. In the present case, the boundary conditions in terms of load stem from the self-weight and those in terms of displacement come from the link elements underneath the ship (see boundary conditions section). Since the undeformed geometry is not known (i.e. in the hypothetical absence of gravity), the chosen geometry is that from the wireframe model, described previously, which is based on geodetic measurements and laser scanning in 2008–2011. The stresses and displacements presented in this section are a result of the self-weight only. Considering all of stresses such as residual stresses from drying, relaxation variation in moisture content and temperature in material modelling, especially to use it for a large and complex structure like Vasa in very challenging task. Fortunately, the temperature and relative humidity inside the museum are constant after installation of a new climate-control system at the museum in 2004. The relative hu-midity varies between 51 and 59% and temperature change is between 18 and 20 ◦C.
Although the FE model is based on the already deformed geometry of the ship and limited to self-weight loads, the estimated stress distribu-tion is considered sufficient to quantitatively compare and rank candi-dates of new support solutions. One possible criterion for a good support structure is to relieve highly stressed regions and distribute loads more evenly [12]. Another criterion can be to retain dimensional stability by minimizing the displacements caused by the self-weight under the same conditions as for the stress analysis.
In the present work, the first aim of the stress analysis was to identify regions of high stress concentration and determine the stress state of different key members in the ship such as the main hull, deck beams, pillars, keel, and deck planks. In this paper only the current support is studied. Although von Mises stresses have been used for stress analyses of wooden ships in the absence of anisotropic strength values [12], these direction independent effective stresses are not very suitable for wood materials to describe the severity of a multiaxial stress state. Instead, one can formulate a stress function, which accounts for the pronounced anisotropic nature of wood and the difference in tension and compres-sion stress limits [28]. Given the stress state, the risk of failure, either by yielding or brittle fracture, can be described by a stress-based failure criterion function. For anisoptropic materials like wood, a balance be-tween the available experimental strength values and the physical ad-equacy of the criterion is necessary. In the present case, this compromise suggests the function for the maximum stress criterion to quantify the significance of the given stress state. More accurate higher-order criteria require the determination of interaction terms between stresses which can be difficult or even impossible to identify [29]. The maximum stress criterion function ξ can be expressed as
ξ = max (⃒⃒ ⃒ ⃒σfL L ⃒ ⃒ ⃒ ⃒, ⃒ ⃒ ⃒ ⃒σfT T ⃒ ⃒ ⃒ ⃒, ⃒ ⃒ ⃒ ⃒σfR R ⃒ ⃒ ⃒ ⃒, ⃒ ⃒ ⃒ ⃒σfLT LT ⃒ ⃒ ⃒ ⃒, ⃒ ⃒ ⃒ ⃒σfLR LR ⃒ ⃒ ⃒ ⃒, ⃒ ⃒ ⃒ ⃒σfTR TR ⃒ ⃒ ⃒ ⃒ ) (3) where: σL≥0→fL=fL,t;σL<0→fL=fL,c σT≥0→fT=fT,t;σT<0→fT=fT,c σR≥0→fR=fR,t;σR<0→fR=fR,c
where σi and fi (i = L, T or R) are the normal stress and corresponding normal strength in each orthogonal direction of the wood, σij and fij (i and j = L, T or R) are the shear stress and corresponding shear strengths of the wood . The stress function ξ = 0 means no stress and hence no risk of failure, and ξ = 1 means that a stress component has attained its limit value leading to failure. Values of this function account for the overall failure risk considering all loading directions simultaneously, and gives a fair representation in order to identify regions with higher risks of creep, yielding or cracking. It is worth noting that the tensile strengths are assumed to be compressive ones. This is a reasonable assumption for the case of Vasa, where the majority of normal loads are in compression, due to gravitational forces.
The global stress analysis provides information on which stress state is generally closest to its limit value, and is therefore of particular importance in characterisation of the mechanical behaviour of the ship. For the Vasa FE model, τTR is closest to its limit value, relatively speaking. Accurate shear testing in TR is in principle more important than testing other directions which have a lower criterion function ξ. In general, shear properties of wood are neglected, compared with more easily determined tensile and compressive properties along the main material axes. The strength of the Vasa oak in different directions is given in Table 3. Fewer data points are available for tensile values compared with those in compression. Due to the lack of tensile data, it is simply assumed that the tensile strength is the same as the compressive strength. The impact of the simplification is however considered to be limited since compression is the predominant stress state. Due to lack of shear strength data of the Vasa oak, the data is taken from another material in [30], where the strengths in the three normal directions were close to that of the Vasa oak.
The maximum stress criterion [23], which is a suitable criterion for orthotropic material, is used to find the critical zones in the ship, as shown in Fig. 16. In the maximum stress criterion, the ratios of the actual stresses to the failure stresses are compared in the local coordinate system. The maximum elastic displacements from self-weight only are relatively small compared to observed creep displacements.
According to the geodetical measurements, exemplified in Fig. 15(c), in accordance with the CM distribution, as seen in Fig. 15(a), and even visual observation of the ship, the maximum movement of the ship is at the stern. Compaction of the keel, indentation of the main hull at the support locations and bulging deformation between the supports have been observed. The results from the FE model are partly in agreement with observations, showing maximum stress function values at the keel, support locations and at the stern, as shown in Fig. 16.
0 0.01 0.02 0.03 0.04 0.05 0.06 0.07 0.08 0.10 Fig. 16. Critical zones with high values of ξ according to maximum stress criterion in Eq. (3).
In order to demonstrate the variation of stresses in the large com-ponents of the ship, the radial stress in the ceiling and planking (only solid shell elements) is selected and shown in terms of cumulative dis-tribution function in Fig. 17. It can be seen that the stress distribution is relatively uniform with an upper tail for the stress concentrations. The outliers in this tail should be interpreted with care, since they are local stresses sensitive to mesh refinement, type of element, structural im-perfections, etc. As a general measure of stress risk, it is then more advisable to focus on average stress levels or the stress at some upper percentile for high risk zones, say at 98%.
As an example, the average (50%) and 98% of the cumulative dis-tribution of nodal stresses are selected to calculate the stress ratios in different directions (ξ L, ξ T, ξ R, ξ LT, ξ TR and ξ LR) for the ceiling and planking (only solid shell elements). These are given in Table 4.
It can be seen from Table 4 that the radial stress (R), shear stress in TR direction (rolling shear) and tangential (T) stress have the highest stress ratios followed by longitudinal (L) direction, longitudinal-radial (LR) and longitudinal-tangential (LT) direction. This emphasizes, in particular, the relative importance of the material properties in trans-verse directions (R and T) as well as rolling shear (TR) properties of Vasa oak.
In order to show the effect of self-weight on displacement of different components of the ship, a transverse cross-section at the midpoint of the ship is depicted in Fig. 18, showing the displacement in a vertical di-rection (z-didi-rection).
It can be noted from Fig. 18 that the maximum vertical deflections are at the mid-span of the deck planks (between the vertical columns and the main hull). The deck beams also have small deflection compared to their length. The higher displacement distribution of the main hull is towards the port side.
4.3. Solutions for an improved support structure
In order to design a novel support structure, which can distribute the loads (both internal and external loads) more evenly and minimize the deformation of the ship, further thorough structural analyses are required. The results presented in Section 4.2 indicate the critical zones of the hull using the maximum stress criterion as well as the
displacement distribution of the ship using the current support structure. The results of mass distribution along the ship is important information in in taking measures to possibly rotate the ship in with a more sym-metric weight distribution. It should be noted that the assumption of linear elastic material properties of wood is a limitation, when it comes to actual load distribution of loads in Vasa.
Nevertheless, considering the current support structure, which made of 18 steel cradles (see Fig. 14), their location is not optimal considering the stiffeners inside the ship, such as knees, rider futtocks and stringers shown in Fig. 2. In addition, it does not support the bottom of the ship properly, since it does not extend all the way towards the keel of the ship. Therefore, an improved external support structure should be placed along the location of the corresponding stiffeners such that the heavy weight of those stiffeners be distributed more evenly and trans-ferred more directly to the cradles. Also, the increase of the number of cradles leads to lower the reaction force on each cradle and subsequently a more even distribution of the loads with reduced stress concentrations. The full-scale FE model gave the possibility to test different support concepts in terms of number of cradles, the height of the contact surfaces of the support, i.e. where they stop along the hull of the ship, the length of the contact surfaces, i.e. how far the supports extend at the bottom of the ship. The model also makes it possible to investigate the effect of internal support structures. The proposed ideas were implemented to number of selected cradles (the 9 pairs of cradles at the middle of the ship). The results of the different concept scenarios were compared both qualitatively and quantitatively. Focus is place on the statistical distri-bution of global displacements and stresses rather than absolute local values, which risk being imprecise due to discretization. The total re-action forces at selected cradles as well as some locations of the selected
Fig. 17. Cumulative distribution function of radial stresses. Table 4
Maximum and average stress function ratios in different directions.
Stress function in different direction ξ L ξ T ξ R ξ LT ξ TR ξ LR 50% of cumulative distribution 0.0019 0.0018 0.0022 0.0014 0.0022 0.0011 98% of cumulative distribution 0.0065 0.0086 0.014 0.0051 0.0096 0.0053
cradles are compared for different support structures (see Fig. 19). In the following the reaction forces from three different concept designs (Concept 1, Concept 2A and 2B) are compared with those from current support. The difference between Concept 1 and 2 is that in Concept 2 both internal and external support systems are considered.
In the case of Concept 2B, the total reaction forces decrease (10–30%, depending on the support) and become more evenly distributed
compared with Concept 2A. The relative lower stresses due to its in-ternal support structure would lead to lower creep deformation over time. In addition, considering the asymmetry of the ship and its incli-nation towards port side, the extended external support of Concept 2B holds the ship better laterally. Hence, Concept 2B was selected for further analysis, by extending it to all of the cradles. Some preliminary results in term of critical zones based on the maximum stress criteria for
Port
Starboard
Fig. 18. A transverse cross-section at the middle of the ship, showing the displacement in the vertical direction (z-direction; units in mm).
the new support are presented in Fig. 20.
A closer examination, the preliminary results in Fig. 20 show more evenly distributed stresses in the new support. This was expected, as the results of concept 2B showed similar patterns. However, more quanti-tative comparisons are required by closer examination of critical areas of the ship, as well as calculation reaction forces, resultant moments at the location of the cradles for both support structures.
4.4. Assessment of reliability of the FE model
It is usually unacceptable to risk to load heritage structure me-chanically for the purpose of validation. Other, more qualitative methods are then the only option to provide confidence in the numerical model.
To date, the following observations can be made in support of the model:
•Geodetic measurements (from 2000 to 2012) show higher displace-ments in the stern directed towards the port side. This is confirmed by calculation of CM profile along the ship, which at the stern is more inclined towards the port side. The calculated displacements caused by the self-weight have the same direction, especially in the stern. •The weight of the ship derived from the FE model agrees well with
previous calculations/estimations. Some of the geometrical details of the ship (such as hand rails at the weather deck, pumps and parts of rigging) have been excluded.
•Qualitatively, the stress distribution follows engineering intuition, with higher stresses in the bottom of the stern and support locations which are more heavily loaded from the self-weight of the ship. •It can be mentioned that some quantitative measurements are
ongoing, which we hope to report later. Care needs to be taken to ascertain that only elastic and reversible deformations take place. Certain supporting steel struts have been removed temporarily, whereupon the resulting deck beam deflections have been measured. On replacing the steel support, the reaction force needed to push the beam back to original shape was measured. Also, displacements caused by contact pressure applied to the main hull were measured. Preliminary calculations show that the calculated and measured
displacements were in the same order of magnitude both for the deck beams and the main hull section.
5. Conclusions
A full-scale finite-element model of the 17th-century ship Vasa has been developed with the purpose to compare and rank potential future support solutions. The design and choice of elements have been pre-sented, based on engineering arguments, as a compromise between computational efficiency and accuracy of the model. Some of the key conclusions drawn from this experience are:
• The location of the centre of mass in sections along the length of the ship shows a tendency towards the port side, especially at the stern. This lean to port has also been observed in the calculated displace-ments and in geodetical measuredisplace-ments.
• According to the geodetical measurements, centre-of-mass distribu-tion and visual observadistribu-tion at the Vasa Museum, the maximum movement of the ship is at the stern. The results from the FE model are in agreement with the observations, showing a clear tendency of displacement distribution towards the stern
• The critical zones appear to be at the support locations, keel, bottom of the main hull and vertical pillars at the orlop and storage decks in the stern. In these zones the stress components are relatively closer to their limit values, compared with other zones in the ship. • The radial stress, shear stress in TR direction (rolling shear) and
tangential (T) stress have the highest stress ratios. This emphasizes the relative importance of the material properties in transverse di-rections (R and T) as well as the rolling shear (TR) properties of the Vasa oak.
Although this paper describes a method to develop a FE model spe-cifically for Vasa, it is hoped that useful ideas and procedures can be adapted to suit other wooden structures in need of improved support. In particular, the geometrical modelling approach for a large structure by using a wire frame or 3D scanned data, and making cross-sections to define splines and subsequently desired areas and volumes provide a valid method to obtain a CAD model. Also, the computational cost can
Fig. 20. Comparison of critical zones based on the maximum stress criterion function for the case of current support and the new support: (a) current support (side view), (b) current support (bottom view), (c) new support (side view), and (d) new support (bottom view).
be reduced by considering the dimensionality in different components (1D beam, 2D shell, or 3D solid) when selecting the element type. It was found that using a combination of line, area and volume elements pro-vided a realistic physical representation of the structure while keeping the computational time to tolerable levels.
CRediT authorship contribution statement
R. Afshar: Conceptualization, Methodology, Writing - review &
editing. N. Alavyoon: Data curation, Formal analysis. A. Ahlgren: Conceptualization, Methodology. E.K. Gamstedt: Writing - review & editing.
Declaration of Competing Interest
The authors declare that they have no known competing financial interests or personal relationships that could have appeared to influence the work reported in this paper.
Acknowledgements
Financial support from the National Maritime Museums of Sweden, Formas, Vinnova and the Swedish Research Council is gratefully acknowledged. The authors would like to thank Dr. Fred Hocker, the head of research at the Vasa Museum for providing the wire frame model of Vasa as well as contributing to technical description of the ship and Mrs. Emma Hocker, the former conservator at the Vasa Museum for language editing of the manuscript. Also, thanks to Mr. Michael Olofsson for his contribution in improving the finite element model.
Appendix A. Supplementary material
Supplementary data to this article can be found online at https://doi. org/10.1016/j.engstruct.2020.111765.
References
[1] Hocker E. Maintaining a stable environment: Vasa’s New climate-control system. J Preservat Technol 2010;41:3–9.
[2] van Dijk NP, Gamstedt EK, Bjurhager I. Monitoring archaeological wooden structures: Non-contact measurement systems and interpretation as average strain fields. J Cult Heritage 2016;17:102–13. https://doi.org/10.1016/j.
culher.2015.03.011.
[3] Afshar R, van Dijk NP, Bjurhager I, Gamstedt EK. Comparison of experimental testing and finite element modelling of a replica of a section of the Vasa warship to identify the behaviour of structural joints. Eng Struct 2017;147:62–76. [4] Stoyanov S, Mason P, Bailey C. Smeared shell modelling approach for structural
analysis of heritage composite structures – An application to the Cutty Sark conservation. Comput Struct 2010;88:649–63. https://doi.org/10.1016/j. compstruc.2010.02.005.
[5] Chen Z, Zhu E, Lam F, Pan J. Structural performance of Dou-Gong brackets of Yingxian Wood Pagoda under vertical load – An experimental study. Eng Struct 2014;80:274–88. https://doi.org/10.1016/j.engstruct.2014.09.013.
[6] Pizzo B, Gavioli M, Lauriola MP. Evaluation of a design approach to the on-site structural repair of decayed old timber end beams. Eng Struct 2013;48:611–22.
https://doi.org/10.1016/j.engstruct.2012.09.036.
[7] Invernizzi S, Bertolini-Cestari C, Fioravanti M, Chiabrera E. Numerical Modeling and Assessment of the Ebe Schooner-Brig. Int J Arch Heritage 2012;6:453–77.
https://doi.org/10.1080/15583058.2011.582534.
[8] Lourenço PB. Analysis of historical constructions: from thrust-lines to advanced simulations. Historical Construct 2001:7–9.
[9] D’Ayala D, Riggio M. Assessment of Historical Timber Structures: Select Papers from the Second International Conference on Structural Health Assessment of Timber Structures (SHATIS13). International Journal of Architectural Heritage 2015;9:639–40. https://doi.org/10.1080/15583058.2015.1041356. [10] Lyu M, Zhu X, Yang Q. Connection stiffness identification of historic timber
buildings using Temperature-based sensitivity analysis. Eng Struct 2017;131: 180–91. https://doi.org/10.1016/j.engstruct.2016.11.012.
[11] Nelson T, Wang E. Reliable FE-Modeling with ANSYS. ANSYS Web Source 2004. [12] Fenton RF, Fowles RJ. “HMS Victory: Modelling and structural analysis: how this
contributes to the conservation of Nelson’s famous flagship. London: UK; 2014. [13] Vorobyev A, Arnould O, Laux D, Longo R, van DNP, Gamstedt EK. Characterisation
of cubic oak specimens from the Vasa ship and recent wood by means of quasi- static loading and resonance ultrasound spectroscopy (RUS). Holzforschung 2015; 70:457–465. https://doi.org/10.1515/hf-2015-0073.
[14] Bjurhager I, Halonen H, Lindfors E-L, Iversen T, Almkvist G, Gamstedt EK, et al. State of degradation in archeological oak from the 17th century Vasa ship: substantial strength loss correlates with reduction in (holo)cellulose molecular weight. Biomacromolecules 2012;13:2521–7. https://doi.org/10.1021/ bm3007456.
[15] Bjurhager I, Ljungdahl J, Wallstr¨om L, Gamstedt EK, Berglund LA. Towards improved understanding of PEG-impregnated waterlogged archaeological wood: A model study on recent oak. Holzforschung 2010;64. https://doi.org/10.1515/ hf.2010.024.
[16] Ljungdahl J, Berglund LA. Transverse mechanical behaviour and moisture absorption of waterlogged archaeological wood from the Vasa ship. Holzforschung 2007;61:279–84. https://doi.org/10.1515/HF.2007.048.
[17] Hoffmann P. On the long-term visco-elastic behaviour of polyethylene glycol (PEG) impregnated archaeological oak wood. Holzforschung 2010;64:725–8. https://doi. org/10.1515/hf.2010.082.
[18] Vorobyev A, van Dijk NP, Kristofer GE. Orthotropic creep in polyethylene glycol impregnated archaeological oak from the Vasa ship. Mech Time-Depend Mater 2019;23:35–52. https://doi.org/10.1007/s11043-018-9382-3.
[19] Vorobyev A. Static and time-dependent mechanical behaviour of preserved archaeological wood : Case studies of the seventeenth century warship. Vasa. 2017. [20] Vorobyev A, Almkvist G, van DNP, Gamstedt EK. Relations of density, polyethylene
glycol treatment and moisture content with stiffness properties of Vasa oak samples. Holzforschung 2017;71:327–335. https://doi.org/10.1515/hf-2016- 0202.
[21] Bodig J, Jayne BA. Mechanics of Wood and Wood Composites. Krieger Publishing Company 1993.
[22] Mechanics of Materials 6th Edition - By (Ferdinand P. Beer & E. Russell Johnston, Jr & John T. Dewolf & David F. Mazurek)|Ahmed M. Karim - Academia.edu n.d. (accessed January 22, 2019). http://www.academia.edu/30804966/Mechan ics_of_Materials_6th_Edition_-_By_Ferdinand_P._Beer_and_E._Russell_Johnston_Jr_an d_John_T._Dewolf_and_David_F._Mazurek_.
[23] Ansys Inc. Ansys 18 user guide 2018.
[24] Reissner E. On the Theory of Bending of Elastic Plates. J Math Phys 1944;23: 184–91. https://doi.org/10.1002/sapm1944231184.
[25] Luari E. Sensitivity analysis of the dowel distribution on the Vasa hull. Padova University; 2015. Master thesis.
[26] Lindberg J. Massf¨ordelningsanalys av skeppet Vasa. Stockholm, Sweden: Vasamuseet; 2008.
[27] Hocker F. Personal communication 2019.
[28] Konopka D, Gebhardt C, Kaliske M. Numerical modelling of wooden structures. J Cult Heritage 2017;27:S93–102. https://doi.org/10.1016/j.culher.2015.09.008. [29] Moses DM, Prion HGL. Anisotropic plasticity and the notched wood shear block. (Wood Engineering). Forest Products Journal 2002. (accessed January 28, 2019).
http://link.galegroup.com/apps/doc/A88578497/AONE?sid=googlescholar. [30] Pencik J. Modelling of Experimental Tests of Wooden Specimens from Scots Pine
(Pinus sylvestris) with the Help of Anisotropic Plasticity Material Model. DRVNA INDUSTRIJA 2015;66:27–33. https://doi.org/10.5552/drind.2015.1362. [31] Ljungdahl J, Berglund LA, Burman M. Transverse anisotropy of compressive failure
in European oak – a digital speckle photography study. Holzforschung 2006;60: 190–5. https://doi.org/10.1515/HF.2006.031.