Norwegian railways adapted
for higher train speeds
track aspects of tilting trains
Paper presented at the 2nd International conference '
Railway Engineering -99, May 25-26, 1999,
Commonwealth Institute, London, United Kingdom
_, Björn Kufver, WI and
Hallstein Gåsemyr, Jernbaneverket, Norway
Swedish National Road and
, Transport Research Institute
VTI särtryck 319 - 1999
Norwegian railways adapted
for higher train speeds
- track aspects of tilting trains
Paper presented at the 2nd International conference
Railway Engineering -99, May 25 26, 1999,
Commonwealth Institute, London, United Kingdom
Björn Kufver, VTI and
Hallstein Gåsemyr, Jernbaneverket, Norway
SWQÅFSÄ? ' Sää Cover: Non/vegian EMU for
NORWEGIAN RAILWAYS ADAPTED FOR HIGHER TRAIN SPEEDS
- TRACK ASPECTS OF TILTING TRAINS
B. Kufver H. Gåsemyr
VTI Railway Systems Jernbaneverket
SE 581 95 Linköping N OO48 Oslo
Sweden Norway
KEYWORDS: Alignment, Tilting trains, Track irregularities, Track stability, Track standards.
ABSTRACT
High speed curving is essential for fast train services in the mountainous country of Norway. During
1993 and 1996, successful trials with the X2 (XZOOO) and VT610 (Pendolino) tilting trainsets were
carried out, and measured track forces were found to be acceptable. As a result of these positive results, the decision was made to acquire tilting trains.
Safety related work, such as widening and renewal of the ballast bed in order to increase track stability is being carried out. Presignalling distances are being increased in order to match braking distances. Other measures consist of reducing track irregularities and adjusting superelevation ramps and transition curves that do not coincide.
Although tilting trains may run faster on curves than conventional trains, it is clear that the ride comfort in such trains can be improved through minor changes to the existing alignment and cant. It is also wise to consider specific aspects of tilting when designing realignments and new lines. A new approach has been used when analysing a complete set of track standards for tilting trains, in order to ensure that these standards provide reasonable and practical guidance for track engineers.
INTRODUCTION
The track is a component in the railway system that often is binding for permissible train speeds. Using tilting trains, the restrictiveness of small curve radii is reduced. The track geometry may still be binding, but on a higher speed level than for non-tilting trains. At the same time, the standard and condition of track superstructure and ballast must also meet the requirements set by higher train speeds.
This paper provides a background to the Norwegian tilting train project and presents an overview of measures which Jembaneverket has introduced for generally increased train speeds and for ensuring that wheel/track-forces do not exceed acceptable values in high speed curving, Phase I.
The paper is focused on Phase II, a study performed by VTI on behalf of Jernbaneverket, where track geometry standards were analysed with respect to passenger comfort and specific aspects of tilting. Finally, the paper presents ideas about future studies considering tilt technology and its practical application, Phase III.
BACKGROUND TO THE NORWEGLAN TILTING TRAIN PROJECT
As the rail network in Norway contains many curves, there has long been an interest in high speed curving (Serigstad & Potter, 1995). The possibility of operating with tilting trains was investigated as early as 1973, and in 1981 special express trains were put into service. These trains, consisting of class El 17 locomotives and B7 coaches with a low centre of mass and stiff suspension to reduce sway when curving, can run through curves at a speed approximately 10% higher than conventional trains. The B7 coaches were prepared for active tilt technology, but due to various technological problems, such as
unreliable components in the tilt system and high track forces from the class El 17 locomotive at increased curving speeds, the tilt technology was not implemented for revenue service.
During 1993, trials with the Swedish class X2 and German class VT610 tilting trains were carried out in Norway. Wheel/track forces were measured with instrumented wheelsets and were found acceptable.
In 1996, an X2 trainset was hired from the Swedish State Railways (SJ) and used in revenue service on
the Oslo-Kristiansand main line. Before starting the service, track stability was measured with a Swedish test vehicle. These measurements confirmed that the track could carry lateral loads according to the criterion of Prud hommes. During revenue service with the X2 trainset, surveys of passengers
judgement of comfort, service, etc. were conducted. Vibration levels in the trainset (ride index, WZ)
were measured and found satisfactory.
Further measurements were conducted on the track. The angles of attack of the wheelsets were measured on curves to investigate the radial steering capability of the bogies. Also, the relative displacements between rails and sleepers were measured in order to investigate the roll behaviour of the rails and risk of fatigue of the rail fasteners at high cant deficiencies. (Track components were S49 rails and Pandrol PR 341A fasteners combined with 5 mm EVA plastic rail pad, or Pandrol e1877 fasteners combined with 10 mm studded rubber rail pads. The heaviest vehicle was the X2 power car with a mass of 73000 kg but with the mass centre located as low as 1.33 m above the track plane.)
The results of the trials in 1996 were positive and it was decided to acquire 28 tilting trainsets for Norway. The 16 EMUs for the Oslo-Gardermoen Airport line have a maximum speed of 210 km/h and one of these trainsets has been equipped with active tilt technology. Another 16 EMUs and 11 DMUs,
with a maximum speed of 160 km/h, have been ordered and will be put into traffic on main lines where
the present maximum speed is 130 km/h for conventional and express trains.
PHASE I - INFRASTRUCTURE FOR GENERALLY INCREASED TRAIN SPEEDS
The introduction of tilting trains in Norway is intended to enable increased train speeds without large and expensive improvements to the existing infrastructure. However, increasing train speeds requires certain measures to be taken. The most obvious is perhaps that presignalling distances must be increased and that sight distances for road traffic must be extended at unmanned level crossings. At train speeds within the interval 130-160 km/h, all level crossings will be supplied with remote controlled barriers. The number of level crossings will be reduced by merging with adjacent crossings or by replacement of bridges or culverts. On the Oslo-Gardermoen Airport line, where train speeds exceed 160 km/h, no level crossings will be accepted.
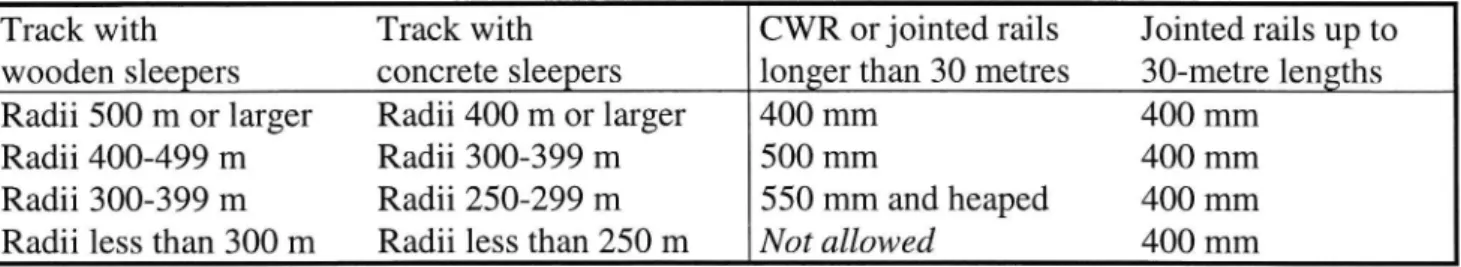
Ballast cleaning will be performed on certain sections of the track and the ballast shoulders will be
improved. Normally, the width of the shoulders should be 400 mm, but for CWR tracks the width should be increased to 500-550 mm where curve radii are small, and in certain cases the shoulders should be
heaped 100 mm above the top of the sleepers, see Table 1.
Table 1. Width of ballast shoulders as a function of track superstructure and curve radii. (Source: Gasemyr 1999).
Track with Track with CWR or jointed rails Jointed rails up to
wooden sleepers concrete sleepers longer than 30 metres 30-metre lengths
Radii 500 m or larger Radii 400 m or larger 400 mm 400 mm
Radii 400-499 m Radii 300-399 m 500 mm 400 mm
Radii 300-399 m Radii 250-299 m 550 mm and heaped 400 mm
Precast concrete bridges with ballasted track will replace steel bridges with lengths up to 8.5 metres. The track quality (level of track irregularities) will be improved and a new standard will be applied for tracks with a permissible speed higher than 140 km/h. Special attention will be paid to long wave misalignments (up to 100 metres).
In Norway, there exist superelevation ramps that do not coincide with transition curves, since these are too short to give an acceptable cant gradient. Such ramps will be adjusted either by a lengthening of the transition curve or by a reduction of the cant in the adjacent circular curve.
On the single track lines, a number of partial twin tracks will be built in order to enable the predicted
increased traffic volume when the tilting trains are introduced.
PHASE II - TRACK GEOMETRY AND COMFORT ASPECTS OF TILTING TRAINS
Before Phase H was initiated, successful test trials were conducted with the X2 tilting trainsets from
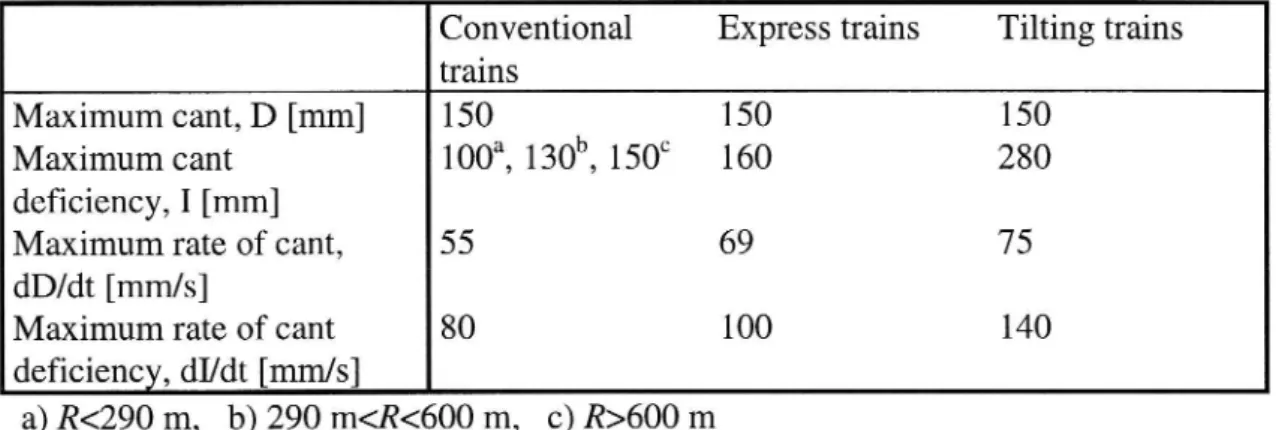
Sweden and the VT610 from Germany. The test trials included high speed curving with more than 300 mm of cant deficiency, and a preliminary track standard was drafted, see Table 2.
Table 2. Certain track limits in Norway. (Source: Gasemyr & Kufver, 1999).
Conventional Express trains Tilting trains
trains
Maximum cant, D [mm] 150 150 150
Maximum cant
1003, 130", 150C 160
280
deficiency, I [mm]
Maximum rate of cant, 55 69 75 dD/dt [mm/s]
Maximum rate of cant 80 100 140 deficiency, dI/dt [mm/s]
a) R<290 m, b) 290 m5R5600 m, c) R>600 m
According to the test trials, the wheel/track forces will be acceptable if the curves do not contain large track irregularities. Hence, Phase II focused on other aspects than wheel/rail forces. The following topics were studied:
1. Consequences for conventional trains when applying the track standards
2. Analysis of passenger comfort in the tilting trains and comparisons with comfort in other trains 3. An overall judgement and a recommendation for handling con icting requirements on the track The last point may be specified further: Are the track standards reasonable from the comfort point of view? Will the track standards provide sufficient guidance for track engineers so that, at a predefined train speed, a reasonable track geometry (combination of curve radii, lengths of transition curves, amount of cant) is achieved? With a predefined track geometry, will the resulting permissible train speed be reasonable or should it be decreased (alternatively increased)?
Consequences for conventional trains potential conflicts between different categories of trains
This part of the study was conducted with the same method as an earlier study of Swedish track
standards (Kufver, 1995). There is a potential conflict between fast trains and slow freight trains when
choosing cant for circular curves. With the exception of the Oslo-Gardermoen Airport Line, the highest permissible speed in Norway is 160 km/h and the smallest curve radius for this speed is R=703 m when maximum cant D=150 mm is used. The cant deficiency will be I=280 mm for tilting trains running through the curve at a speed of 160 km/h. For a slow freight train at a speed of 80 km/h, the cant excess will be 43 mm, which must be considered a very modest value. At larger curve radii than R=703 m, the
difference between equilibrium cant for tilting trains (at 160 km/h) and slow freight trains is reduced and the necessity for cant and cant excess is also reduced. For smaller curve radii, the maximum cant is still
D=150 mm and the equilibrium cant increases and cant excess decreases for slow freight trains. The conclusion is that cant excess for freight trains will not be a binding restriction for the operation of tilting trains.
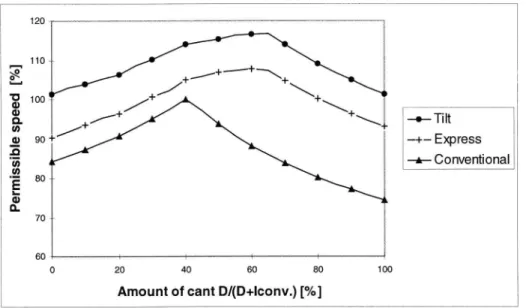
However, conflicting requirements will occur in the case of short and very short transition curves. The definition of a very short transition curve is that the limit for rate of cant dD/dt and the limit for rate of cant deficiency dI/dt are binding for permissible train speed. The definition of a short transition curve is that either the limit for rate of cant dD/dt or the limit for rate of cant deficiency dI/dt combined with either the limit for cant D or limit for cant deficiency I are binding. (For a long transition curve, the limit for cant D and limit for cant deficiency I, i.e. the conditions applying to the circular curve, are binding.) Figure 1 shows permissible train speeds for the three categories of Norwegian trains as
functions of the amount of cant on a very short transition curve, with limits as shown in Table 2
&" C 3 o. o Tilt U) 3 + Express .a . 'ö'»U) + Conventional E I-cu n. 70 60 r , . . 0 20 40 60 80 1 00
Amount of cant D/(D+Iconv.) [%]
Figure l. Permissible speeds for the three categories of trains (expressed in
per cent of the highest possible train speed for conventional trains) as a function of cant (expressed in per cent of equilibrium cant for
conven-tional trains) on a very short transition curve. (Source: Kufver, l998b).
A number of observations may be made in Figure 1. For conventional trains, optimal cant, i.e. the amount of cant that maximises permissible train speed, is approximately 40% (of equilibrium cant). This percentage may also easily be calculated with data from Table 2. At a lower cant, the permissible train speed will be bound by the permissible rate of cant deficiency dI/dt alone, while a margin exists for rate of cant dD/dt. At a cant higher than 40% of equilibrium cant, the situation is the contrary.
Express trains and tilting trains may run through the short transition curves at higher speeds than conventional trains, which is obvious from the data in Table 2. In Figure 1, it can be seen that optimal
cant is higher for these two categories of trains. When choosing cant, there is a con ict between the
desire for high permissible speeds of both conventional and tilting trains. In order to avoid unnecessary
speed restrictions for conventional trains (including freight trains), it is recommended to optimise the
cant for conventional trains rather than tilting trains, even though the permissible speed for tilting trains is thereby not quite as high as would otherwise be possible. (The limit for rate of cant dD/dt for express
trains and tilting trains, shown in Table 2, should therefore not be binding.)
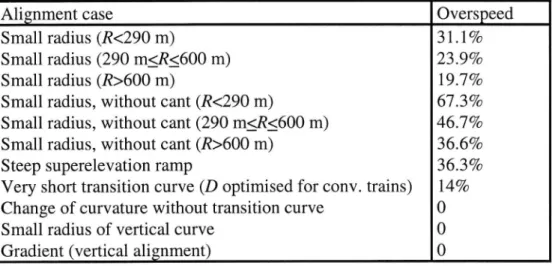
The permissible overspeeds for tilting trains have been systematically calculated and analysed for 22 different alignment cases. Table 3 shows examples of these.
Table 3. Examples of permissible overspeeds for tilting trains in Norway. (Source: Kufver, 1998b).
Alignment case Overspeed
Small radius (R<290 m) 31.1% Small radius (290 nggöOO m) 23.9% Small radius (R>600 m) 19.7% Small radius, without cant (R<290 m) 67.3% Small radius, without cant (290 m5R5600 m) 46.7% Small radius, without cant (R>600 m) 36.6%
Steep superelevation ramp 36.3%
Very short transition curve (D optimised for conv. trains) 14%
Change of curvature without transition curve 0
Small radius of vertical curve 0
Gradient (vertical alignment) 0
Principles for analysis of comfort in tilting trains
Here, passenger comfort or discomfort is related to the disturbances perceived when the vehicle body is moving in an uncomfortable way. Other aspects of comfort, such as seat standards, air quality, noise level, etc., are not taken into consideration. Since the focus is on high speed curving, the high frequency vibrations (f>2 Hz), which are present both on straight track and on curves, are also excluded. This leaves mainly quasi-static lateral acceleration, lateral jerk and roll motions to be analysed.
It is preferable to aggregate the in uence of these physical quantities into an overall comfort quantity, since measures to reduce one of the physical quantities often result in an increase in another quantity. With a single overall comfort quantity, it will be possible to judge whether or not the net effect is an
improvement. An investigation (Kufver, 1997b) shows that PCT functions, originally derived by British
Rail Research/ABA Technology (Harborough, 1986), offer the most reasonable way of quantifying instantaneous discomfort when running through curves. The PCT functions, comprising one function for seated passengers and another for standing, take into account lateral acceleration, lateral jerk and roll velocity, and show the percentage of passengers perceiving the ride as uncomfortable. However, a small percentage of passengers in tilting trains are also affected by motion sickness, which is believed to be a cumulative effect of vehicle reactions on a number of curves. The contribution of different physical quantities to motion sickness remains unclear (Förstberg & Ledin, 1996), but published results from Japan (Koyanagi, 1985), (Ohno, 1996) and Sweden (Förstberg, 1996) indicate that the in uence of roll velocity and/or roll acceleration is important. In Japan, a limit for roll velocity (5 degrees/s, later changed to 0.1 radian/s) and a limit for roll acceleration (15 degrees/S2, later changed to 0.3 radians/S2) have been
The magnitudes of the various physical quantities should be calculated for the vehicle floor. In a recent study (Kufver, 1997c) it was found that differences between the physical quantities in the vehicle floor and those in the track plane are mainly explained by the roll behaviour of the vehicle. An effective roll factor may be defined, expressing the ratio between the lateral acceleration in the vehicle floor and the lateral acceleration in the track plane. This effective roll factor is in the range 1.2-1.4 for conventional vehicles and below unity for tilting trains. During Phase H, no data on other vehicle characteristics for the Norwegian tilting trains, such as masses, springs and dampers, were available. Hence, the vehicle model in the study contained only one degree of freedom; rolling. It was mainly assumed that rolling was in perfect phase with lateral acceleration in the track plane, but additional calculations were made for the first vehicle in the trainset, with an assumed delay of 0.2 seconds in roll behaviour. Using this simple model, the roll velocity, but not the roll acceleration, may be estimated. The simple vehicle model leads to underestimation of the physical quantities (lateral acceleration, lateral jerk, roll velocity), but since different types of vehicles were compared, it was assumed that this underestimation is approximately the same for the compared alternatives.
In summary, PCT was used to quantify instantaneous discomfort, while the risk of motion sickness was
judged with the physical quantity roll velocity.
The assumed application of the track standards (Table 2) is that quantities in the track geometry (radii, lengths of transition curves and cant) should be chosen to maximise the permissible speeds of conventional trains. The following sections investigate whether such track geometries lead to the best possible comfort in tilting trains, or whether other track geometries are justified in order to improve the comfort in these trains.
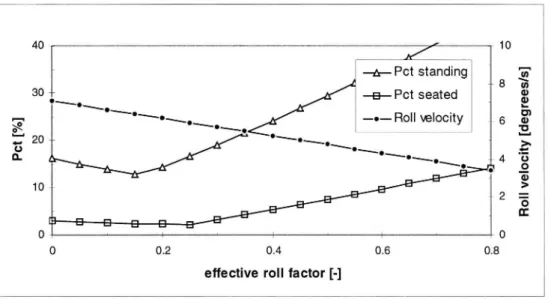
Choice of cant for a predefined horizontal alignment and choice of compensation ratio in the tilt systems The first level in the comfort analysis is the choice of cant and the choice of compensation ratio in the tilt systems (i.e. the choice of effective roll factor). For passengers, it is of no importance whether the track is superelevated or the train tilts in relation to the track. Hence the effective roll factor was used as an independent variable in the analysis. Figure 2 shows PCT for both seated and standing passengers, together with roll velocity for a case where cant has been chosen to maximise the permissible speed for conventional trains. 40 , 10 1/ - _A Pct standing A -- 8 30 ;; E Pct seated \'\.\ . _ .N'X-x. ...._ Roll velocuy __ e &. Pct [% ] l\ ) O Ro ll ve lo ci ty [d eg re es /s ] O 0.2 0.4 0.6 0.8
effective roll factor [-]
Figure 2. Passenger comfort expressed in PCT and roll velocity for a tilting train running
through a curve at a speed of 155 km/h. Radius is R=665 m, cant is D=150 mm and lengths of transition curves are Lt=99 m. (Source: Kufver, 1998b).
In Figure 2, it can be seen that the best effective roll factor with respect to PCT is in the range 0. 15 025,
corresponding to a compensation ratio of 75-85%. However, the roll velocity reaches 6.5 degrees per second for such high levels of compensation ratio, that, according to Koyanagi (1985) and Förstberg (1996), they may lead to motion sickness among sensitive passengers. In Norway, the tilt systems are designed for a compensation ratio of 55% (effective roll factor 0.45), which leads to roll velocities up to approximately 5.5 degrees per second. This may be regarded as a compromise between contradicting desires. Several horizontal alignments have been studied and the conclusions are similar.
The track standards cannot be changed without increasing either PCT or roll velocity.
Choice of horizontal alignment in a predefined terrain corridor
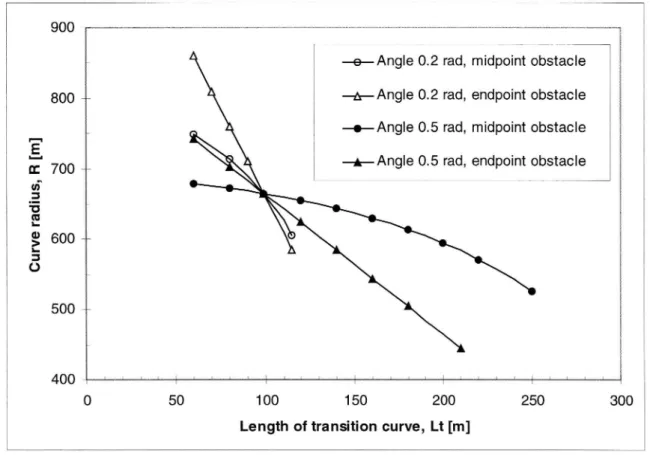
This part of the study analysed whether or not the alignments maximising the permissible speeds of conventional trains result in the best possible comfort in tilting trains. Four different terrain corridors for single curves were defined and analysed using procedures described in Kufver (1997a), Kufver (1997c) and Kufver (1998a). The terrain corridors are described by the angle between two straight lines to be connected by the curve, and the longitudinal position of a binding obstacle. In all four cases, the binding obstacle was placed to enable the combination of curve radius R=665 m and transition lengths Lt=99 m, see Figure 3. These are the smallest radius and the correspondingly shortest transition curve for a permissible speed of 130 km/h for conventional trains. The obstacles are placed either in the middle of the circular portion of the curve or in the adjacent tangential track (a turnout that should remain straight). All deviations from this R/Lt combination lead to a lower permissible speed than 130 km/h for conventional trains (if the track remains within the defined corridor and does not require the obstacles to be removed).
900
e Angle 0.2 rad, midpoint obstacle
800 __ A Ang|e 0.2 rad, endpoint obstacle
+Ang|e 0.5 rad, midpoint obstacle
?
.
a: 700 __ +Angle 0.5rad, endpomt obstacle m E 1: E g 600 = 0 500 400*'"i"'*l""i*"'l"*ll 0 50 1 00 1 50 200 250 300
Length of transition curve, Lt [m]
Figure 3. Possible combinations of curve radius R and lengths of transition curves Lt
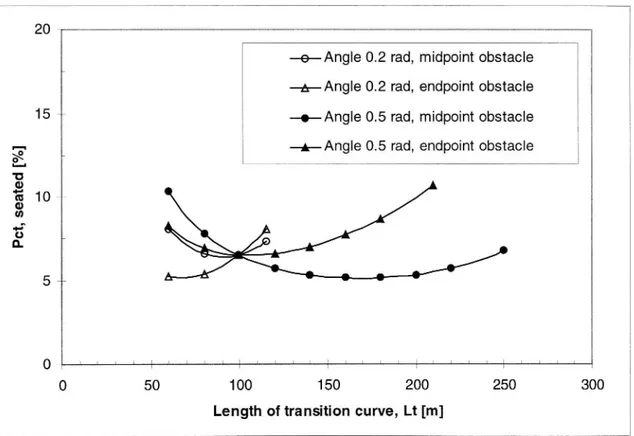
The resulting PCT values for seated passengers in a tilting train running through the curves at a speed of 155 km/h are shown in Figure 4. (At R=665 m and Lt=99 m, the cant deficiency is 1:276 mm, the rate of cant deficiency is dI/dt=120 mm/s and the rate of cant is dD/dt=65 mm/s.)
20
e Angle 0.2 rad, midpoint obstacle A Angle 0.2 rad, endpoint obstacle
15 +Angle 0.5 rad, midpoint obstacle
1;- +Angle 0.5 rad, endpoint obstacle
O 'o 3en 10 CD (» 5 n. 5__ 0 1 0 50 1 00 1 50 200 250 300
Length of transition curve, Lt [m]
Figure 4. Passenger comfort expressed in PCT (seated passengers) for a tilting train running
through curves at a speed of 155 km/h. The different horizontal alignments are
defined in Figure 3. (Sources: Kufver, 1998b and Gåsemyr & Kufver, 1999).
On short transition curves, discomfort is caused mainly by high levels of lateral jerk and roll velocity, while on long transition curves, discomfort is caused mainly by a high level of lateral acceleration. In two of the cases, the lowest discomfort is achieved with transition length Lt=99 m, which is optimal for conventional trains. In the third case, a slightly lower PCT value is achieved with a shorter transition curve and in the fourth case with a longer transition curve. As an overall judgement, it may be concluded that the track standards, applied with the de ned speed-maximisation approach, lead to almost the best possible ride comfort for the Norwegian tilting trains.
Additional calculations were made for cases where the terrain corridor allows margins for permissible speed. The same terrain corridors as in Figure 3 were used, but the tilting train runs through the curves at a lower speed than 155 km/h. The aim was to analyse whether or not lower PCT values were achieved with other transition lengths than Lt=99 m. The diagram curves, corresponding to those in Figure 3, were reduced but PCT minima were still found at approximately Lt=99 m. Hence, as long as PCT is used as object function, margins for planned maximum permissible speed do not justify an abandonment of the speed-maximisation approach.
Another limit that was analysed was the minimum distance between transition curves and superelevation ramps. This limit was chosen to correspond to 0.9 seconds running time. No independent criteria for analysing the relevance and suitability of this limit have been found, but it corresponds to the limit used
in Sweden and is less restrictive compared to most railway companies, according to a state-of the-art
report from UIC (1998).
Choice of permissible speed for tilting trains in Norway
In order to analyse whether the permissible speed for tilting trains in Norway will be reasonable or
whether the speed ought to be decreased (alternatively increased), comparisons were made with other
categories of trains in Norway and with different categories of trains in Sweden. A summary of the Swedish track standards is shown in Table 4.
Table 4. Certain track limits in Sweden. (Source: Kufver, 1998b).
Conventional Express trains (B) Tilting trains (S)
trains (A)
Maximum cant, D [mm] 150 150 150 Maximum cant 100 150 245 deficiency, I [mm]
Maximum rate of cant, 46 55 69 dD/dt [mm/s]
Maximum rate of cant 46 55 79
deficiency, dI/dt [mm/s]
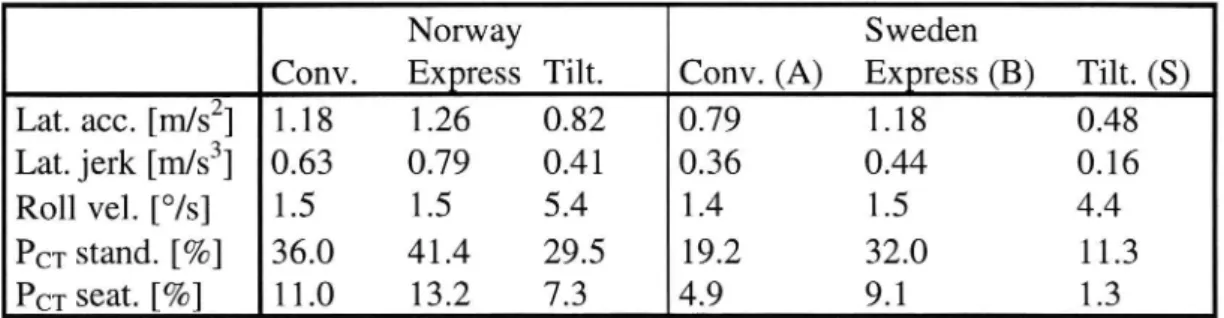
Table 5 shows the physical quantities related to passenger comfort and the resulting PCT values for the worst possible cases. The Norwegian and Swedish tilting trains have an effective roll factor of 0.55 and 0.28, respectively. Other train categories are assumed to have an effective roll factor of 1.2.
Table 5. Resulting physical quantities and passenger comfort PCT for the worst case for
different train categories in Norway and Sweden. (Source: Kufver, 1998b).
Norway Sweden
Conv. Express Tilt. Conv. (A) Express (B) Tilt. (S)
Lat. acc. [rn/sz] 1.18 1.26 0.82 0.79 1.18 0.48
Lat. jerk [m/s3] 0.63
0.79
0.41
0.36
0.44
0.16
Roll vel. [O/s] 1.5 1.5 5.4 1.4 1.5 4.4
PCT stand. [%] 36.0 41.4 29.5 19.2 32.0 11.3
PCT seat. [%] 11.0 13.2 7.3 4.9 9.1 1.3
Table 5 shows that the lateral acceleration and lateral jerk will be lower in the Norwegian tilting trains compared both with other categories of trains in Norway and trains of category B in Sweden (trains with high quality running gear, but without tilt mechanisms). The roll velocity will be higher than in any other category of train. Aggregating these quantities into PCT shows that instantaneous discomfort (PCT) will be lower for Norwegian tilting trains than for Norwegian conventional and express trains. However, the high roll velocities may lead to tendencies to motion sickness among sensitive passengers. For the first
vehicle in a tilting trainset, with a 0.2 seconds delay in tilt operation, PCT will be 1-2% higher compared
Conclusions from Phase II
The conclusions from Phase II are that the Norwegian tilting trains will have a reasonable compensation ratio for Norwegian tracks and that the Norwegian track standards applied with the speed-maximisation approach will guide track engineers to a reasonable balancing of contradicting desires when choosing alignment and cant. It is also concluded that the permissible speed for tilting trains will be reasonable. PHASE III - FUTURE STUDIES CONSIDERING TRACK ASPECTS OF TILTING TRAINS
The major uncertainty in the Norwegian tilt project is the risk of motion sickness. Due to short transition curves, the roll motions will be more severe in tilting trains in Norway compared to tilting trains in Sweden.
It is also desirable to find methods for quantifying the commercial value of improved passenger comfort in terms of PCT. Jernbaneverket and the VTI plan to participate in a coming UIC study of passenger comfort.
Another area that merits special attention is the in uence of track irregularities (track quality) on passenger comfort as well as wheel/track forces.
REFERENCES
Förstberg, J., (1996), Motion-related comfort levels in trains - A study on human response to different tilt control strategies for a high speed train. TRITA-FKT Report I 996:4I , KTH, Stockholm.
Förstberg, J. & Ledin, T., (1996), Discomfort caused by low frequency motions - A literature survey of hypotheses and possible causes of motion sickness. VTI Meddelande 8OZA, Linköping.
Gåsemyr, H., (1999), Norwegian case study: Upgrading the permanent way for the introduction of tilting trains. Proceedings: Infrastructure maintenance & renewal 99, 8-11 February 1999, AiC, London. Gåsemyr, H. & Kufver, B., (1999), Norwegians adapt tracks for tilting trains. International Railway
Journal, 39 (1): 26 27.
Harborough, PR., (1986), Passenger comfort during high speed curving - analysis and conclusions. BRR TR DOS 018, British Rail Research/AEA Technology, Derby.
Koyanagi, S., (1985), Ride quality evaluation of a pendulum car. QR ofRTRI, 26 (3): 89 92.
Kufver, B., (1995), Tillåtna hastighetsöverskridanden för tåg av kategori B och kategori S, som funktion
av spårets geometriska form (Permissible overspeeds for trains with radial steering bogies and for tilting trains, considering the track geometry, published in Swedish only). VTI Notat 30-1 995, Linköping. Kufver, B., (1997a), Mathematical description of railway alignments and some preliminary comparative studies. VTI Rapport 4ZOA, Linköping/TRITA-FKT Report I 997:30, KTH, Stockholm.
Kufver, B., (1997b), Methods for evaluation of ride comfort as a function of vehicle reactions caused by
railway alignment. VTI Rapport 4ZIA, Linköping/TRITA-FKT Report I997:3I , KTH, Stockholm.
Kufver, B., (1997c), Optimisation of single horizontal curves in railway alignment. VTI Rapport 424A,
Linköping/TRITA-FKT Report I 997:45, KTH, Stockholm.
Kufver, B., (1998a), Realigning railways in track renewals methods and objectives. Proceedings:
Railway Engineering - 98, 10 July 1998, London: 53-57. ISBN 0-947644 37-7.
Kufver, B., (1998b), Spårgeometri för korglutningståg i Norge (Track geometry for tilting trains in Norway, published in Swedish only). VTI Notat 67-1998, Linköping.
Ohno, H., (1996), What aspect is needed for a better understanding of tilt sickness? QR of RTRI,
37 (1): 9 13.
Serigstad, K. & Potter, T.J., (1995), Tilting trains and computer simulation in Norway. Rail Engineering International, (1): 15-20.
UIC, (1998), First report on tilting train technology - The state of the art, Paris.