EVERSAFE
Everyday Safety for Electric Vehicles
Driver and vehicle behaviour to power train failures
in electric vehicles – experimental results of field
and simulator studies
Deliverable No. 2.1
Work Package No. 2
Work Package Title Vehicle stability and driver response
Editor Isabel Neuman
(isabel.neumann@psychologie.tu-chemnitz.de)
Authors Peter Cocron, Isabel Neumann, Maria Kreußlein, Marta
Pereira, Daniel Wanner, Lars Drugge, Maxim Bierbach, Bruno Augusto
Status Final
Reviewed and approved for submission
Marcus Wisch (03/09/2014)
An ERA-Net collaborative project. Work programme:Electromobility +
Document History Table
Version
List of abbreviations
ANOVA Analysis of variance
ANCOVA Analysis of covariance
BASt Federal Highway Research Institute (Bundesanstalt für Straßenwesen)
CG Control group
ci Left wheel hub motor failure in a left curve (curve inward)
CI Confidence interval
co Right wheel hub motor in a left curve (curve outward)
d Cohen’s measure of sample effect size for comparing two sample means
df Degrees of freedom
DRS Disturbance rating scale
ESS Energy storage system
EV Electric vehicle
EVERSAFE Everyday Safety for Electric Vehicles
e.g. Exempli gratia
etc. Et cetera
EG Experimental group
f Cohens´s f: measure for effect sizefor ANOVA
F F-Value
ICE Internal combustion engine
i.e. Id est
km Kilometre
KTH Royal Institute of Technology, Stockholm
M Mean
Max Maximum
Min Minimum
NASA-TLX Task load index of the National Aeronautics and Space Administration
P Probability
RB Regenerative braking
RMANOVA Repeated-measures analysis of variance
RMANCOVA Repeated-measures analysis of covariance
s Seconds
SD Standard deviation
si Left wheel hub motor failure on a straight (straight inward)
tACC Accelerator pedal reaction time
tSW Steering wheel reaction time
TUC Technische Universität Chemnitz
VTI Swedish National Road and Transport Research Institute
WHM Wheel hub motor
φ Pitch angle of vehicle
𝜂𝑝2 Measure of strength of partial Relationship
Δ Delta
Φ Measure of association in contingency tables
Table of Contents
Everyday Safety for Electric Vehicles ... 1
Document History Table ... 2
List of abbreviations ... 3
List of Tables ... 6
List of Figures ... 8
EXECUTIVE SUMMARY ... 11
1. Introduction ... 13
1.1 Wheel hub motors ... 13
1.2 Regenerative braking ... 14
1.3 Objectives ... 14
2. Definition of power train failure conditions affecting vehicle stability ... 15
2.1 Wheel hub motor failures ... 15
2.2 Regenerative braking failure... 17
3. Implementation of failure conditions ... 18
3.1 Simulator study ... 18
3.2 Field studies with modified electric vehicle ... 18
3.2.1 Field study wheel hub motor ... 18
3.2.2 Field study regenerative braking ... 19
4. Wheel hub motor failures: simulator study ... 20
4.1 Research objectives ... 20
4.2 Method ... 20
4.2.1 Preparations ... 21
4.2.2 Sample ... 21
4.2.3 Procedure ... 22
4.3 Results of the simulator study on wheel hub motor failures ... 24
4.3.1 Subjective data ... 24 4.3.1.1 Failure perception ... 24 4.3.1.2 Expectancy ... 25 4.3.1.3 Perceived risk ... 26 4.3.1.4 Perceived stress ... 26 4.3.1.5 Controllability ... 27 4.3.1.6 Subjective workload ... 29
4.3.1.7 Summary of subjective data ... 30
4.3.2 Objective data ... 31
4.3.2.1 Conventions ... 31
4.3.2.2 Straight inward failure ... 32
4.3.2.3 Curve inward failure ... 35
4.3.2.4 Curve outward failure ... 39
4.3.2.5 Summary of objective data ... 43
4.4 Conclusion and discussion ... 43
4.4.1 Subjective data ... 43
4.4.2 Effect of failure position and curvature ... 44
4.4.3 Objective data ... 44
4.4.4 Implications ... 45
5. Field study I: wheel hub motor failures ... 46
5.2 Method ... 46
5.2.1 Sample ... 46
5.2.2 Test vehicle ... 47
5.2.3 Procedure ... 48
5.2.4 Data collection ... 49
5.3 Results of the field study on wheel hub motor failures ... 50
5.3.1 Subjective data ... 50 5.3.1.1 Failure perception ... 50 5.3.1.2 Perceived risk ... 51 5.3.1.3 Perceived stress ... 52 5.3.1.4 Controllability ... 53 5.3.1.5 Subjective workload ... 55
5.3.1.6 Summary subjective data ... 56
5.3.2 Objective data ... 57
5.3.2.1 Conventions ... 57
5.3.2.2 Straight failure ... 57
5.3.2.3 Curve inward failure ... 62
5.3.2.4 Curve outward failure ... 67
5.3.2.5 Summary results objective data ... 71
5.4 Conclusion and discussion ... 72
6. Field study II: Regenerative braking failure ... 74
6.1 Research objectives ... 74 6.2 Method ... 74 6.2.1 Test vehicle ... 74 6.2.2 Test track ... 75 6.2.3 Sample ... 75 6.2.4 Procedure ... 76 6.2.4.1 Part I ... 76 6.2.4.2 Part II ... 77
6.3 Results of the regenerative braking failure study ... 79
6.3.1 Subjective data ... 79 6.3.1.1 Failure notice/perception ... 79 6.3.1.2 Perceived risk ... 79 6.3.1.3 Perceived stress ... 81 6.3.1.4 Controllability ... 83 6.3.1.5 Subjective workload ... 86
6.3.1.6 Summary of subjective data ... 88
6.3.2 Objective data ... 88
6.3.2.1 Conventions ... 88
6.3.2.2 Accelerator pedal behaviour ... 89
6.3.2.3 Brake pedal behaviour ... 91
6.3.2.4 Steering behaviour ... 92
6.3.2.5 Lateral acceleration ... 94
6.3.2.6 Reaction times ... 97
6.3.2.7 Vehicle and driver behaviour... 98
6.3.2.8 Summary objective data ... 99
6.4 Conclusion and discussion ... 100
7. Final discussion ... 101
7.1 Future research ... 101
List of Tables
Table 1. Overview of conducted driving studies within work package 2 of EVERSAFE. ... 15
Table 2. Failure conditions of the simulator trials. ... 16
Table 3. Failure conditions of the field study with WHM failures. ... 16
Table 4. RB failure conditions. ... 17
Table 5. Manipulated order for the simulator study on WHM failures. ... 21
Table 6. Variables which were assessed with questionnaires. ... 24
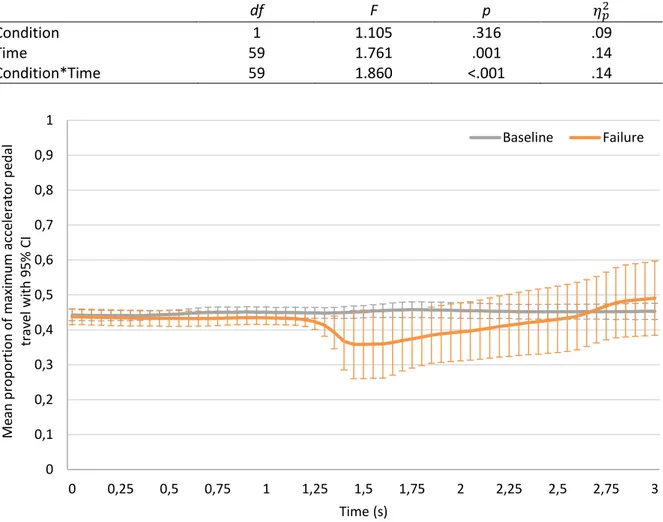
Table 7. Results of repeated-measures ANCOVA for a comparison of baseline and failure for si accelerator pedal behaviour (covariate = initial accelerator pedal behaviour). ... 32
Table 8. Results of repeated-measures ANCOVA for a comparison of baseline and failure si driving (covariate = initial steering wheel angle). ... 33
Table 9. Accelerator pedal and steering wheel driver reaction times for failure condition si. ... 34
Table 10. Results of repeated-measures ANCOVA for a comparison of baseline and failure ci accelerator pedal behaviour (covariate = initial accelerator pedal behaviour). ... 35
Table 11. Results of repeated-measures ANCOVA for a comparison of baseline and failure ci driving (covariate = initial steering wheel angel). ... 36
Table 12. Accelerator pedal and steering wheel driver reaction times for failure condition ci. ... 37
Table 13. Results of repeated-measures ANCOVA for a comparison of baseline and failure co accelerator pedal behaviour (covariate = initial accelerator pedal behaviour). ... 39
Table 14. Results of repeated-measures ANCOVA for a comparison of baseline and failure co driving (covariate = initial steering wheel angle). ... 40
Table 15. Accelerator pedal and steering wheel driver reaction times for failure conditions co. ... 41
Table 16. Accelerator pedal and steering wheel driver reaction times for the three failure conditions in the simulator study. ... 43
Table 17. Sociodemographic data for control and experimental group (N = 51). ... 47
Table 18. Different orders implemented for failure activation. ... 48
Table 19. Failure perception of the first failure for each failure type. ... 51
Table 20. Results of RMANCOVA regarding accelerator pedal behaviour for si failure (covariate = initial accelerator pedal behaviour). ... 57
Table 21. Results of RMANCOVA regarding brake pedal behaviour for si failure (covariate = initial brake pedal behaviour). ... 58
Table 22. Results of RMANCOVA regarding steering behaviour for si failure (covariate = initial steering wheel angle). ... 59
Table 23. Reaction times for accelerator pedal position and steering wheel angle of si. ... 60
Table 24. Results of RMANCOVA regarding accelerator pedal behaviour for ci failure (covariate = initial accelerator pedal behaviour). ... 62
Table 25. Results of RMANCOVA regarding brake pedal behaviour for ci failure (covariate = initial brake pedal behaviour). ... 63
Table 26. Results of RMANCOVA regarding steering behaviour for ci failure (covariate = initial steering wheel angle). ... 64
Table 27. Reaction times for accelerator pedal position and steering wheel angle of ci. ... 65
Table 28. Results of RMANCOVA regarding accelerator pedal behaviour for co failure (covariate = initial accelerator pedal behaviour). ... 68
Table 29. Results of RMANCOVA regarding brake pedal behaviour for co failure (covariate = initial brake pedal behaviour). ... 68
Table 30. Results of RMANCOVA regarding steering behaviour for co failure (covariate = initial steering wheel angle). ... 69
Table 31. Reaction times for accelerator pedal position and steering wheel angle of co. ... 70
Table 32. Reaction times for accelerator pedal position and steering wheel angle of the three failures during the field study. ... 72
Table 33. Sociodemographic data for control and experimental group. ... 76 Table 34. Overview of test runs and failure activation. ... 78 Table 35. Number of participants who noticed the RB failure. ... 79 Table 36. Results of RMANCOVA regarding accelerator pedal usage (covariate = initial accelerator
pedal pressure). ... 89
Table 37. Brake pedal usage in baseline and during failure activation (Δ 5 bar = brake reaction). ... 91 Table 38. Results of RMANCOVA regarding brake pedal usage when RB failure was active (covariate = initial brake pedal pressure). ... 91 Table 39. Results of RMANCOVA regarding steering behaviour (covariate = initial steering wheel angle, 0-4 sec, 10 Hz). ... 92 Table 40. Results of RMANCOVA regarding steering behaviour (braking vs. no braking participants,
covariate = initial steering wheel angle, 0-4 sec). ... 94
Table 41. Results of RMANCOVA regarding lateral acceleration (covariate = initial lateral acceleration, 0-4 sec, 10 Hz). ... 95 Table 42. Results of RMANCOVA regarding lateral acceleration comparing braking and not braking participants (covariate = initial lateral acceleration, 0-4 sec, 20 Hz.) ... 96 Table 43. Brake pedal reaction times for the RB study. ... 97
List of Figures
Figure 1. Torque characteristics of an electrical machine. ... 16
Figure 2. Implementation of auxiliary brake system on the rear axle of the Mitsubishi iMiEV. ... 19
Figure 3. Driver cabin of the VTI moving base driving simulator. ... 21
Figure 4. Level of education for the sample. ... 22
Figure 5. Screenshot of the video that was shown to the participants. ... 23
Figure 6. Procedure of the simulator experiment. ... 23
Figure 7. Frequency of acknowledged unusual events. ... 25
Figure 8. Frequency of expectancy ratings over different failure types (1 – “not expected at all” to 5 – “totally expected“). ... 25
Figure 9. Evaluation of risk (1 – “not risky at all” to 5 – “very risky”) in baseline and failure conditions for the different failure types (si, ci, co). ... 26
Figure 10. Evaluation of stress (1 – “no stress” to 5 – “high stress”) in baseline and failure conditions for the different failure types (si, ci, co). ... 27
Figure 11. Evaluation of control (1 - “driver has full control” to 10 - “driver has no control”) in baseline and failure conditions for the different failure types (si, ci, co). ... 28
Figure 12. Disturbance Rating Scale (Neukum & Krüger, 2003). ... 28
Figure 13. Evaluation of disturbance (0 – “not noticeable” to 10 – “not controllable”) in failure conditions for the different failure types (si, ci, co)... 29
Figure 14. Item for the subscale mental demand for the NASA-TLX (Hart & Staveland, 1988). ... 29
Figure 15. Workload scores in baseline and failure conditions for the different failure types (si, ci, co). ... 30
Figure 16. Vehicle trajectory after the activation of the different failure types (Green line represents normal trajectory. Red line represents possible trajectory under failure conditions without the intervention of the driver.). Left: si, middle: ci, right: co. ... 31
Figure 17. Proportion of maximum accelerator pedal travel for baseline and 3 seconds failure activation period for si WHM failures. ... 32
Figure 18. Steering wheel for baseline and 3 seconds failure activation period for si WHM failures. . 33
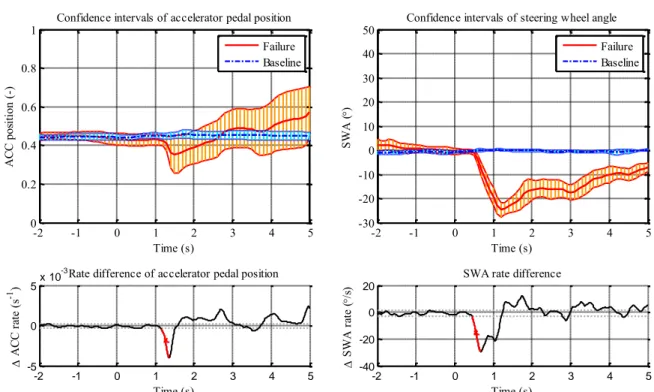
Figure 19. Accelerator pedal and steering angle input for baseline and si and their rate difference with failure activation at t = 0 s. ... 34
Figure 20. Vehicle responses of baseline (blue) and failure condition si (red) with failure activation at t = 0 s (black line) and the reaction times (black dashed lines). ... 35
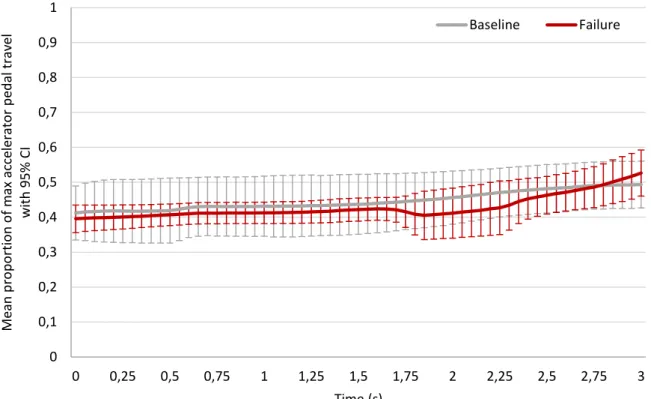
Figure 21. Proportion of maximum accelerator pedal travel baseline and 3 seconds failure activation period for ci WHM failures... 36
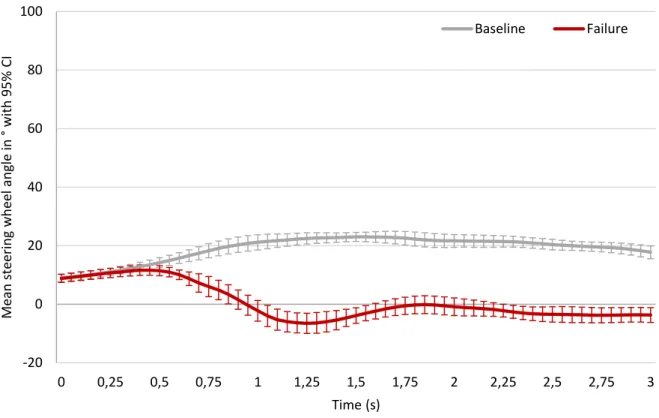
Figure 22. Steering wheel angle for baseline and 3 seconds failure activation period for ci WHM failures. ... 37
Figure 23. Accelerator pedal and steering angle input for baseline and ci and their rate difference with failure activation at t = 0 s. ... 38
Figure 24. Vehicle responses of baseline (blue) and failure condition ci (red) with failure activation at t = 0 s (black line) and the reaction times (black dashed lines). ... 39
Figure 25. Proportion of maximum accelerator pedal travel for baseline and 3 seconds failure activation period for co WHM failures. ... 40
Figure 26. Steering wheel angle for baseline and 3 seconds failure activation period for co WHM failures. ... 41
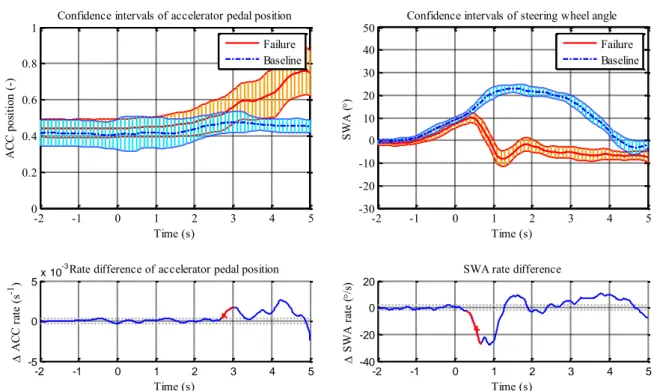
Figure 27. Accelerator pedal and steering angle input for baseline and co and their rate difference with failure activation at t = 0 s. Red lines represent reaction bands, red star markers highlight mean reaction time of each parameter and dash-dotted grey lines represent baseline thresholds. ... 42
Figure 28. Vehicle responses of baseline (blue) and failure condition co (red) with failure activation at t = 0 s (black line) and the reaction times (black dashed lines). ... 43
Figure 30. Test track. ... 48
Figure 31. Procedure of test track study I on WHM failures. ... 49
Figure 32. Perspectives recorded with the camera system. Upper left = control box to check brake pressure, upper right = driver, lower left = foot well, lower right = frontal view... 50
Figure 33. Evaluation of risk (1 - “not risky at all” to 5 -“very risky”) for baseline condition and during WHM failure activation (si, ci, co). ... 52
Figure 34. Evaluation of stress (1 - “no stress at all” to 5 - “very high stress”) for baseline condition and during WHM failure activation (si, ci, co). ... 53
Figure 35. Evaluation of lack of control (1 - “full control” to 10 - “no control”) for baseline condition and during WHM failure activation (si, ci, co). ... 54
Figure 36. Subjective disturbance (1 - “no disturbance” to 10 - “vehicle not under control”) during WHM failure activation (si, ci, co). ... 55
Figure 37. Subjective workload for baseline condition and while WHM failure activation (si, ci, co). 56 Figure 38. Proportion of maximum accelerator pedal travel for baseline and failure conditions and while first second of failure activation for si WHM failure. ... 58
Figure 39. Brake pedal pressure for baseline condition and while the first second of failure activation for si WHM failure. ... 59
Figure 40. Steering wheel angle for baseline condition and while first second of failure activation for si WHM failure. ... 60
Figure 41. Accelerator pedal and steering angle input for baseline and si and their rate difference with failure activation at t = 0 s. ... 61
Figure 42. Vehicle responses of baseline (blue) and failure condition si (red) with failure activation at t = 0 s (black line) and the reaction times (black dashed lines). ... 62
Figure 43. Proportion of maximum accelerator pedal travel for baseline condition and while first 3 seconds of failure activation for ci WHM failure. ... 63
Figure 44. Brake pedal pressure for baseline condition and while first 3 seconds of failure activation for ci WHM failure. ... 64
Figure 45. Steering wheel angle for baseline condition and while first 3 seconds of failure activation for ci WHM failure. ... 65
Figure 46. Accelerator pedal and steering angle input for baseline and ci and their rate difference with failure activation at t = 0 s. ... 66
Figure 47. Vehicle responses of baseline (blue) and failure condition ci (red) with failure activation at t = 0 s (black line) and the reaction times (black dashed lines). ... 67
Figure 48. Proportion of maximum accelerator pedal travel for baseline condition and while first 3 seconds of failure activation for co WHM failure. ... 68
Figure 49. Brake pedal pressure for baseline condition and while first 3 seconds of failure activation for co WHM failure. ... 69
Figure 50. Steering wheel angle for baseline condition and while first 3 seconds of failure activation for co WHM failure. ... 70
Figure 51. Accelerator pedal and steering angle input for baseline and co and their rate difference with failure activation at t = 0 s. ... 71
Figure 52. Vehicle responses of baseline (blue) and failure condition co (red) with failure activation at t = 0 s (black line) and the reaction times (black dashed lines). ... 72
Figure 53. Camera Perspectives recorded with the system. Upper left = control box to check brake pressure, upper right = speedometer, lower left = foot well, lower right = frontal view. ... 74
Figure 54. Preparation of the test track. ... 75
Figure 55. Route for the familiarisation drive. ... 77
Figure 56. Aerial view of the test track at Jahnsdorf airport. ... 78
Figure 57. Procedure of field study II on RB failure. ... 78
Figure 58. Evaluation of risk (1 – “not risky at all” to 5 – “very risky”) in baseline and failure conditions for the different groups (info and no info) including all subjects. ... 80
Figure 59. Evaluation of risk (1 – “not risky at all” to 5 – “very risky”) in baseline and failure conditions for the different groups (info and no info) including only subjects noticing the failure. ... 81 Figure 60. Evaluation of stress (1 – “no stress at all” to 5 – “very high stress”) in baseline and failure conditions for the different groups (info and no info) including all subjects. ... 82 Figure 61. Evaluation of stress (1 – “no stress at all” to 5 – “very high stress”) in baseline and failure conditions for the different groups (info and no info) including only subjects noticing the failure. ... 83 Figure 62. Evaluation of control (1 - “driver has full control” to 10 - “driver has no control”) in baseline and failure condition for the different groups (info and no info) including all subjects. ... 84 Figure 63. Evaluation of control (1 - “driver has full control” to 10 - “driver has no control”) in baseline and failure condition for the different groups (info and no info) including only subjects noticing the failure. ... 85 Figure 64. Evaluation of disturbance (0 – “driver has full control” to 10 - “driver has no control”) in failure condition for the different groups (info and no info). ... 86 Figure 65. Workload scores in baseline and failure conditions for the different groups (info and no info) including all subjects... 87 Figure 66. Workload scores in baseline and failure conditions for the different groups (info and no info) including only subjects noticing the failure. ... 88 Figure 67. Proportion of maximum accelerator pedal travel for baseline and a 4 seconds period after failure activation for the different groups (info and no info). ... 90 Figure 68. Proportion of maximum accelerator pedal travel for baseline and a 4 seconds period after failure activation for the different groups (info and no info). ... 90 Figure 69. Brake pressure (bar) in failure condition over a 4 seconds period after failure activation of braking (N = 19) and not braking participants (N = 23) and individual braking behaviour of braking participants marked in grey. ... 92 Figure 70. Evaluation of steering behaviour (degree) in baseline condition over a 4 seconds period after failure activation for the different groups (info and no info). ... 93 Figure 71. Evaluation of steering behaviour (degree) in failure condition over a 4 seconds period after failure activation in round 1 for the different groups (info and no info). ... 93 Figure 72. Evaluation of steering behaviour (degree) in failure condition in round 1 for braking and not braking participants. ... 94
Figure 73. Evaluation of lateral acceleration (m/s2) in baseline condition over a 4 seconds period
after failure activation for the different groups (info and no info). ... 95
Figure 74. Evaluation of lateral acceleration (m/s2) in failure condition in round 1 over a 4 seconds
period after failure activation for the different groups (info and no info). ... 96
Figure 75. Evaluation of lateral acceleration (m/s2) in failure condition over a 4 seconds period after
failure activation in round 1 for braking and not braking participants. ... 97 Figure 76. Drivers using the brake pedal during RB failure. ... 98
Figure 77. Vehicle behaviour for a RB failure without prior knowledge of the failure. Baseline (blue),
failure condition (red) with failure activation at t = 0 s. ... 98 Figure 78. Vehicle behaviour for a RB failure with prior knowledge of the failure. Baseline (blue), failure condition (red) with failure activation at t = 0 s. ... 99
EXECUTIVE SUMMARY
New electric power trains can be subject to different failures when compared to those arising in conventional vehicles. The objectives for active safety investigations within the EVERSAFE project (work package 2) were to address vehicle stability under these failure conditions and the driver response to relevant types of failures. Failure conditions that affect the vehicle stability are believed to be significantly different from today’s conventional internal combustion engine cars, and may potentially be a substantial safety problem if not treated in a correct manner. To study these effects, two examples of system failures and their consequences on the driver response and vehicle stability were investigated with the help of three studies.
The first two studies investigated a failure of wheel hub motors (WHMs), an emerging technology among the future generation of electric vehicles (EV). The main benefits of a WHM are its controllability, high efficiency, high power density and low weight. However, the direct connection to the wheel comes along with the potential disadvantage in case a failure occurs in the system. Therefore, those WHM failures are to be analysed in this study. A possible failure with severe consequences to the driving task could be a constant brake torque applied to one of the wheels, which leads to a sudden yaw torque and subsequently to a deviation from the desired path of driving. As a consequence, a compensatory control action by the driver is necessary. The impact of this failure of WHMs on the drivers was assessed twofold in the EVERSAFE project. On the one hand a driving simulator study investigated the impact of WHM failures under high speed conditions (110 km/h). On the other hand these failures were investigated in a test track study at lower speeds (30 km/h). Both studies examined the following three manoeuvres: a failure while straight line driving as well as two failures while driving in a curve, i.e. on the inner and the outer rear wheel respectively. Drivers were asked to evaluate the failure situation regarding perceived stress, risk, lack of control, workload and disturbance. Furthermore, objective data collected via the data logger (steering wheel angle, accelerator pedal travel, brake pressure, speed, yaw rate, longitudinal and lateral acceleration) contributed to shed light on the driver response and vehicle stability. The results of the subjective ratings of both studies revealed a low to medium level of perceived failure severity for all tested failures. It can be concluded from the outcomes of the simulator study, that WHM failures at speeds of 110km/h are rated more stressful, risky, disturbing and demanding than driving without an occurring failure. With regard to the test track study these differences occurred only for the straight inward failure. Comparing the subjective evaluations in the simulator and the field study, it can be assumed that failures are perceived as more severe at higher than at lower speeds. The simulator study showed steering as the main reaction to all failures. Regarding the test track study a steering reaction was only detected for the curve inward failure. Consequently, the outcomes of the subjective evaluations of the simulator study and driving data of both studies lead to the assumption that the curve inward failure is the most severe amongst the failures tested here. As participants in both studies used the accelerator pedal during failure activation, regardless of failure type, it could be concluded that drivers try to overrule the deceleration triggered by the failure at low as well as at high speeds. Whether this was an effect of the instruction to maintain a steady speed should be clarified by further research. Generally speaking, results of both studies showed that humans can compensate WHM failures well, at least for the specific settings of the studies. However, further research is needed to investigate if and how these conclusions are applicable, for instance, in case of a higher workload of the driver (e.g., in more complex driving situations).
The third study conducted within the active safety focus of the EVERSAFE project examined a failure of the regenerative braking (RB) system. The latter is a system designed to convert kinetic energy to chemical energy stored in the energy storage system (i.e. battery) while the vehicle decelerates. In the tested configuration this energy recapture is triggered via the accelerator pedal and therefore decelerates the car whenever the driver releases that actuator. In case the RB system fails to operate properly, hazardous situations might occur because the driver expects a deceleration of the car which is inexistent due to the failure. In order to study the effects of a RB failure on driver
behaviour and perception as well as on vehicle stability, a test track study was conducted. Similar to the WHM failure testing, the failure situation was evaluated with the help of subjective ratings (stress, risk, lack of control, disturbance, workload) and data logger records (steering wheel angle, accelerator pedal travel, brake pedal pressure, speed, yaw rate, longitudinal and lateral acceleration). The RB failure was implemented during a deceleration manoeuvre when entering a curve at a speed of about 50 km/h. Whereas half of the participants were informed that a RB failure might occur, the other half was not informed. Results revealed that only about 50% of the subjects noticed the RB failure, but compensation efforts were manageable. Although the situation was rated more risky than solely driving on a road, the RB failure did not induce more stress or workload. Informing people about an upcoming failure yielded a higher frequency of mild braking manoeuvres. It is important to note that failure of RB system will incur in higher vehicle speeds than the ones originally expected by the driver under normal circumstances. Depending on the road conditions (e.g., wet/icy surface) or even the road geometry (e.g., curve driving) the unexpected high velocity might even lead to vehicle instability thus compromising the safety of the occupants as well as the general traffic flow. These aspects should be considered in future research.
1. INTRODUCTION
Electric power trains can be subject to different types of failures when compared to those arising in conventional vehicles. Failure conditions that affect vehicle stability are believed to be significantly different from today’s conventional internal combustion engine (ICE) vehicles, and may potentially be a substantial safety problem if not treated in a correct manner (Jonasson & Wallmark, 2008). As part of the active safety investigations performed in EVERSAFE the vehicle stability and driver response were analysed for these specific types of power train failures. To study these effects, two examples of system failures – both of them unique for EVs – and their implications on the driver and the driving task were investigated. A power train failure due to a failure condition of a wheel hub motor (WHM) is one condition addressed within EVERSAFE. The second one is the effect of a regenerative braking (RB) system failure.
Several studies investigated the impact of system failures on the driver with focus on ICE vehicles and it is therefore important to connect the running work with previous research. For example, studies at Darmstadt and Würzburg University (Wesp, 2011; Neukum, Ufer, Paulig, & Krüger, 2008) investigated the connection between steering actuator failures, vehicle dynamics and driver behaviour for active front-wheel steering and rear-wheel steering systems. While the problem itself is not transferable, the methodologies developed within these research projects can also be applied to the research questions posed here.
1.1 Wheel hub motors
WHMs are presented as one alternative to conventional vehicle drivelines for the propulsion of electric vehicles (EVs). These are characterized by a high energy density and efficiency as well as low weight when compared to the current propulsion systems. WHMs have several advantages. Improved control of the wheel torques, increased flexibility of vehicle design due to small packaging, integration of RB as well as weight and cost reductions due to elimination of mechanical components like transmission, differential, drive shafts are some of them. One known disadvantage is the higher unsprung mass, which leads to reduced vehicle handling and comfort performance. Another potential disadvantage is the effect of a failure in the system. This can act directly on the wheel and is therefore to be analysed in this study (Borchardt, Kasper, & Heinemann, 2012).
As a new technology, the consequences of potential failures are still not well defined. These can possibly affect vehicle stability in ways not comparable to failures in common ICE vehicles. For example, a possible WHM failure could be represented by a constant brake torque applied to only one of the wheels. This would lead to a sudden yaw torque and a necessary control action by the driver to compensate for this unexpected vehicle behaviour. The impact of this and other possible failures of WHMs on the driver and vehicle stability were assessed in this work.
Little work has been published on the topic of WHMs and their impact on vehicle safety. Three studies (Jonasson & Wallmark, 2007; Euchler, Bonitz, Mitte, & Geyer, 2010; Wanner, Drugge & Stensson Trigell, 2014) investigated the vehicle behaviour due to WHM failures, but solely with open-loop simulations. In all studies the interaction with the driver was ignored, which could indeed help to stabilise a vehicle, but also worsen the situation.
1.2 Regenerative braking
A main characteristic of EVs is their RB system, which is designed to convert kinetic energy into chemical energy stored in the energy storage system (i.e. batteries) while the vehicle decelerates. As a consequence, energy can be saved and vehicle emissions can be reduced (Clarke, Muneer, & Cullinane, 2010). Generally, the system can be triggered via accelerator pedal, brake pedal or both pedals. Depending on the intensity of the drag torque, the deceleration caused by RB considerably affects the driving task. Previous studies revealed that drivers quickly adapt to driving with a RB system which is triggered via accelerator pedal (Cocron et al., 2013; Witzlack, Cocron, & Krems, 2014; Schmitz, Maag, Jagiellowicz, & Hanig, 2013). As a consequence drivers also learn to rely on the deceleration caused by the RB system. If an accelerator pedal triggered RB system fails to operate when the driver expects deceleration, or if additional braking torque is needed for intense braking manoeuvres, this can lead to hazardous situations in traffic. The driver needs to quickly overtake the action originally executed by the vehicle, i.e. the deceleration of the car (takeover situations).
1.3 Objectives
This deliverable focuses on failures in the electric propulsion system that will affect the vehicle behaviour, thus require an intervention by the driver and consequently impair traffic safety. The work is initiated by the identification of diverse propulsion failures that lead to stability problems. As the driver is a key component for traffic safety, it is of great importance to study the driver behaviour during vehicle failures. Hence, the reaction of the driver to the failure mode was investigated in three experiments:
Study 1: WHM failures tested in a simulator Study 2: WHM failures tested on a test track Study 3: RB failures tested on a test track
Field tests enable a close to real setting while simulator tests enable high repeatability as well as the possibility to simulate extreme and, in real life, dangerous settings. The main objective of work package 2 of the EVERSAFE project was to analyse driver reactions to different failure conditions in an EV that influence vehicle stability. Requirements for vehicle stability under failure conditions were derived and delivered.
2. DEFINITION OF POWER TRAIN FAILURE CONDITIONS AFFECTING
VEHICLE STABILITY
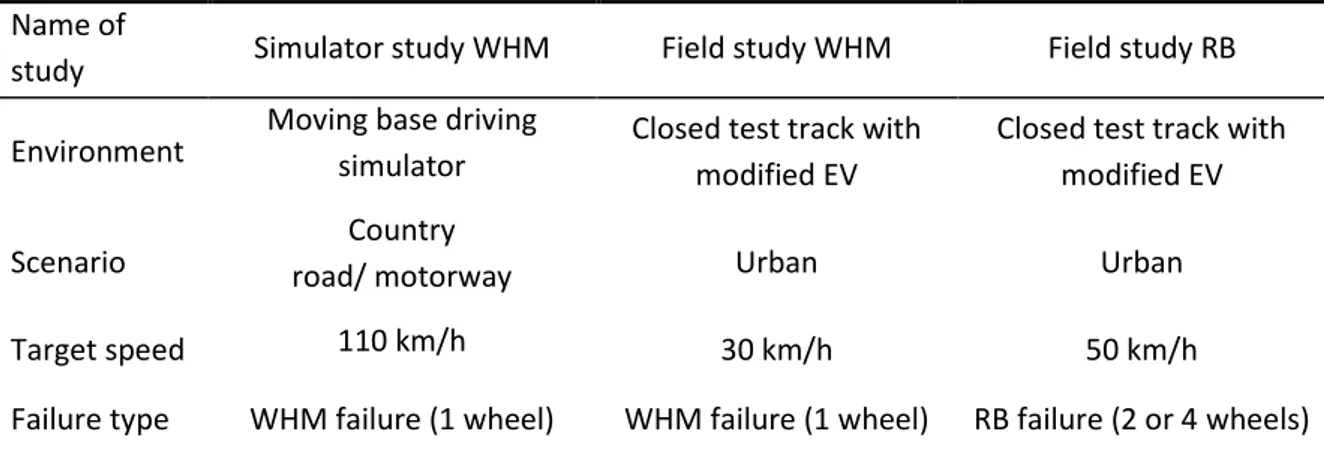
This section describes the different failure conditions implemented and tested in the conducted experiments at the moving base driving simulator as well as in the modified electric vehicle (EV) on the test track. As a main objective, each failure condition had to have a distinct influence on the vehicle stability during normal driving. Three different scenarios and appropriate failure conditions were defined based on work done within work package 4 of the EVERSAFE project (problem identification and assessment; Häring & Kanat, 2013). High speed manoeuvres were exclusively tested in the driving simulator, while urban speed manoeuvres were merely allocated to the experiments on the test track with the EV. The failure conditions were separated into failures that represent wheel hub motor (WHM) failures, thus occurring on one of the four wheels, and a regenerative braking (RB) failure. Table 1 gives an overview of the different studies that were conducted in work package 2.
Table 1. Overview of conducted driving studies within work package 2 of EVERSAFE. Name of
study Simulator study WHM Field study WHM Field study RB
Environment Moving base driving simulator Closed test track with
modified EV
Closed test track with modified EV
Scenario road/ motorway Country Urban Urban
Target speed 110 km/h 30 km/h 50 km/h
Failure type WHM failure (1 wheel) WHM failure (1 wheel) RB failure (2 or 4 wheels)
2.1 Wheel hub motor failures
Failures in the power train affecting drivability were determined. As most considered failure conditions occur in or have an effect on the WHM, in this document the term WHM failure is used for all power train failures that lead to a failure condition on one of the four wheels. These failure conditions, for instance no torque on one of the four wheels, act in different ways on the vehicle stability. The different types of electrical faults in the power train of an EV that lead to WHM failures were collected and classified into various failure conditions according to Wanner et al. (2014). The two failure modes that were selected are an inverter shutdown and a three-phase balanced short circuit. They were selected mainly because of their strong influence on the wheel torque when occurring at certain speeds. Both these conditions induce a brake torque applied to the wheel under consideration, which can incur disastrous circumstances for vehicle stability.
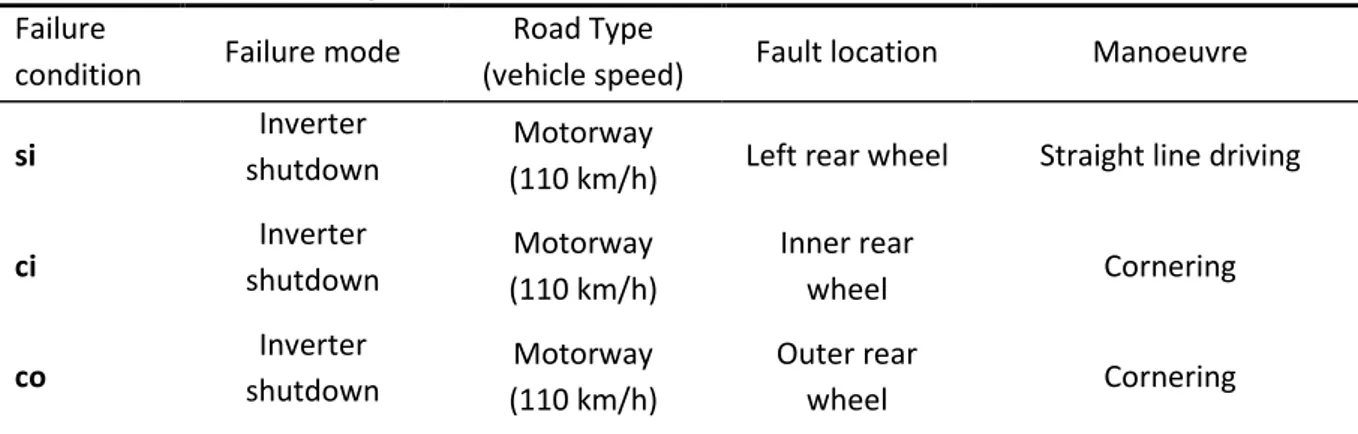
In the simulator study, the failure conditions (Table 2) were chosen according to the motorway speed of 110 km/h. The selected failure mode for this study was an inverter shutdown. This failure mode occurs when the gate signal for the power transistor device vanishes. There are several reasons that initiate an inverter shutdown, for instance a signal-cable breakdown or a loss of power to the control circuit. This failure serves mainly as protection circuit of the inverter in the event of an over-current or over-heating condition. Thus, it is a failure that is internally triggered, if such an abnormal situation is detected and is one of the more common sources for a failure. If it occurs in the field-weakening range, the WHM delivers a speed dependent braking torque. The field weakening range is defined as the working area of the electrical machine above its nominal speed. In this area, the inverter will produce a magnetic field counteracting the natural magnetic field of the
permanent magnets of the electrical machine. This helps the machine to turn faster than the nominal speed at the cost of less torque development. If the inverter shuts down during the field-weakening, the suppression of the natural magnetic field disappears and the electrical machine develops a speed-dependent braking torque (Wanner et al., 2014), see Figure 1.
Table 2. Failure conditions of the simulator trials. Failure
condition Failure mode
Road Type
(vehicle speed) Fault location Manoeuvre
si shutdown Inverter Motorway
(110 km/h) Left rear wheel Straight line driving
ci shutdown Inverter Motorway
(110 km/h)
Inner rear
wheel Cornering
co shutdown Inverter Motorway
(110 km/h)
Outer rear
wheel Cornering
For the field study on WHM failures, three failure conditions (Table 3) were selected based on the same speed and one failure mode with a high influence on the vehicle behaviour. This failure mode represents a short circuit in the WHM, which can occur due to bad isolation of the windings inside the connection box or inside the active parts of the WHM. Note that an inverter shutdown at low speeds does not create a brake torque, and thus another failure mode with a high impact is selected. Table 3. Failure conditions of the field study with WHM failures.
Failure
condition Failure mode
Road Type
(vehicle speed) Fault location Manoeuvre
si
Short circuit in
WHM Urban (30 km/h) Left rear wheel Straight line driving
ci Short circuit in WHM Urban (30 km/h) Inner rear wheel Cornering
co Short circuit in WHM Urban (30 km/h) Outer rear
wheel Cornering
Figure 1. Torque characteristics of an electrical
2.2 Regenerative braking failure
One key property of EVs is their RB system to recapture kinetic energy in deceleration manoeuvres. Depending on the vehicle type, the deceleration caused by RB considerably affects the driving task. The main goal of this study is to investigate the safety implications of the failure of such a system. It is questioned how the vehicle and the driver react if the deceleration caused by a RB system is missing in a failure condition. Results from past studies on user behaviour with EVs conducted by Cocron et al. (2013) indicate that drivers learn to drive with the system quickly and adapt their driving accordingly.
The RB failure was only implemented in the field study as the effect of the failure was considered to be minor, when compared to the WHM failures, and therefore its characteristics were hardly reproducible in the same way in the simulator. Table 4 summarises the failure conditions for the RB failure.
Table 4. RB failure conditions. Failure
condition Failure mode
Road Type
(vehicle speed) Fault location Manoeuvre
3. IMPLEMENTATION OF FAILURE CONDITIONS
After the failure conditions were determined, they were simulated in a virtual environment to specify the braking torque for each failure mode. The simulations and failure mode definitions were conducted at the Royal Institute of Technology (KTH). The resulting brake torques were implemented in the vehicle model and the experimental vehicle respectively.
3.1 Simulator study
The simulator experiment focused on wheel hub motor (WHM) failures, as introduced previously in section 2.1. From the range of failures in this category, the ones with higher potential impact on vehicle stability were selected. These can be represented by the application of a sudden braking torque on the wheel under consideration. The exact value of braking torque was selected based on the results of vehicle dynamics simulations (Wanner et al., 2014) and the nature of the failure. An instant braking torque of 540 Nm that acts directly on one of the rear wheels was implemented in these trials. The test drivers in the Swedish National Road and Transport Research Institute (VTI) driving simulator experienced the failure in three different situations. These are presented in Table 2 and were selected based on driving conditions in terms of road positioning and geometry. All failure conditions were implemented identically. Each test subject was attributed a set of locations on the road where the failures should occur. Once arriving at said positions, the braking torque of the failure was filtered by a first order filter, with a time constant of 0.04 seconds, and applied to the target wheel. At the same time the propulsion torque active on the failure affected wheel, was set to zero and remained so until the failure simulation period is complete.
The failure condition lasted 3 seconds. After this interval, the braking torque of the failure was linearly scaled down during another 3 seconds until it reached zero. Finally, once the failure torque had been removed, propulsion and external braking torques were reapplied to the wheel. Application of the latter was done during a 3 seconds interval where they were linearly scaled up until the signals reached their original values.
After completion of the procedure described above, the vehicle dynamics model returned to nominal driving conditions and was ready to receive new failure requests.
3.2 Field studies with modified electric vehicle
For both field studies, an electric vehicle (EV; Mitsubishi iMiEV) was modified by the Federal Highway Research Institute (BASt) to conduct experiments with WHM failures as well as regenerative braking (RB) failures. The car was equipped with a microprocessor controlled auxiliary brake system, which can be seen in Figure 2. Activated by a remote control, this auxiliary brake system applied brake pressure to one or both brakes at the rear axle independent from the regular brake system with its brake pedal position.
3.2.1 Field study wheel hub motor
In the field study investigating WHM failures conducted by Technische Universität Chemnitz (TUC), the determined brake torque was implemented with an auxiliary brake system on the rear axle. It was possible to choose on which wheel (left, right or both) the failure should occur. The auxiliary brake system delivered a maximum brake pressure of 80 bar during the failure activation to one wheel. Within 0.25 seconds after failure activation, the brake pressure was linearly increasing to
60 bar. Thereafter, the brake pressure increased slower until the maximum was reached. After a period of 4 seconds, the additional applied brake pressure was released to regain normal conditions.
3.2.2 Field study regenerative braking
Within the field study regarding RB failure conducted by TUC, the effect of a RB brake force loss was analysed. Technically the standard equipment of the test vehicle contains a high RB (mode B), a normal RB (mode D) and a low RB (mode C). For the study on the test track mode C (with low deceleration due to RB) was chosen and in parallel the regular high deceleration of mode B was achieved by applying corresponding brake force on both rear wheels by the auxiliary brake system. To activate the failure (loss of high RB force) the artificial RB was suspended via remote control. Figure 2 illustrates the implementation of the auxiliary brakes system.
Figure 2. Implementation of auxiliary brake system on the rear axle of the Mitsubishi iMiEV.
Controller
Auxiliary brake system
4. WHEEL HUB MOTOR FAILURES: SIMULATOR STUDY
4.1 Research objectives
In the present experiment, the influence of failure modes in wheel hub motors (WHMs) on driver response and vehicle stability was investigated with a driving simulator study at the Swedish National Road and Transport Research Institute (VTI) in Gothenburg. The purpose of this research was the investigation of driver reactions and evaluations following the occurrence of a WHM failure, because this event might cause instability of the car (Wanner, 2013). Safety implications are a fundamental factor in the evaluation of electric vehicles (EVs) and shall be derived from this research (Cocron et al., 2011). Considering that a WHM is a new concept and failures in accordingly equipped vehicles occur unexpectedly, it is of highest importance to analyse driver reactions and evaluations in order to estimate ramifications for traffic safety. Consequences of these failures on vehicle dynamics are discussed by Wanner (2013), but the human factor is still unclear. It is conceivable that a driver might not be able to handle and hence not control the car after such an incident. As there are hardly any EVs on the market equipped with WHMs, yet, and solely little research regarding the human factor perspective (Kreußlein, 2013), this study will help to shed light on driver evaluation as well as human reactions to unexpected and expected WHM failures.
4.2 Method
The simulator experiment was implemented by using a within-subject design. Failure type (straight inward (si) vs. curve inward (ci) vs. curve outward (co)) and experience (Block 1 vs. Block 2) were introduced as within factors. Hence, the following effects were examined:
a) anticipating a failure (unexpected vs. expected) and b) three different WHM failures.
Failures on the rear wheels of the vehicles were tested. The following three failures were investigated:
1. WHM failure on the left rear side during straight line driving (straight inward = si), 2. WHM failure on the left rear wheel during a left curve (curve inward = ci) and 3. WHM failure on the right rear wheel during a left curve (curve outward = co).
Anticipation was operationalised by two test blocks. Each subject experienced all failures in each test block. Subjects were not informed about an upcoming failure before the first test block. Subsequently, the first failure in the first test block was definitely unexpected. After having experienced the first failure subjects most likely expected more failures to come. All failures in the second test block were expected because subjects received information about the occurrence of the failures before the second test block, but they did not know on which wheel and when they would occur while the simulation. In order to minimize carry over effects and to analyse the influence of diverse unexpected failure types, different orders of failure presentation were arranged by using a Latin square as suggested by Sedlmeier & Renkewitz (2013), which can be seen in Table 5. The combination of two of the six orders resulted in three groups subjects were randomly assigned to before the beginning of the experiment. Gender and age were balanced across groups. The order of failure presentation was counterbalanced across subjects. This grouping made it possible that every failure occurred at least once as the first failure.
Table 5. Manipulated order for the simulator study on WHM failures.
Order 1 Order 2 Order 3
Block 1 si, co, ci ci, co, si co, ci, si
Block 2 ci, si, co co, si, ci si, ci, co
4.2.1 Preparations
An English online version of almost all questionnaires was arranged via the LimeSurvey software (LimeSurvey Project Team, 2012). Furthermore, a Swedish translation of the questionnaires was compiled in order to clarify possible problems in understanding the English items.
A badge was placed outside the vehicle door in order to create the illusion of an EV (Figure 3). Further, the vehicle dynamics model was changed to that of an EV, in particular towards a Mitsubishi iMiEV. The sounds in the simulator were also adapted to better match those of a vehicle with an electric powertrain.
Figure 3. Driver cabin of the VTI moving base driving simulator.
4.2.2 Sample
In total, 53 subjects were invited to take part in the driving simulator study. Out of these, 43 subjects accepted the invitation for participation. Two subjects were excluded from the dataset due to simulator problems and simulator sickness, which led to a complete dataset for 41 participants. Subjects were 42.12 years in average (SD = 10.88, Min = 25, Max = 59) and held their driving licences for an average of 23.44 years (SD = 11.26, Min = 7, Max = 44). The sample comprised 12 females (29 %) and 29 males (71 %), which were balanced across the different orders. Mean mileage amounted 17385.4 km a year (SD = 12294.66, Min = 800, Max = 50000), and approximately 387.3 km a week (SD = 432.61, Min = 0, Max = 2000). All subjects possessed class B driving license. Three subjects reported an accident including another car in the last three years. Solely one subject had a single car accident (e.g., run-off the road accident, rollovers, collisions with animals or fallen rocks) in the last three years. Roughly 71 % of the test subjects participated at least in one driving simulator study and approximately 61 % had driven an EV before. The majority of subjects held a university degree (65.9 %), as can be seen in Figure 4.
Figure 4. Level of education for the sample.
4.2.3 Procedure
After the welcoming, subjects were informed generally about the study and the consent was obtained. First of all, subjects were asked to fill in an online questionnaire assessing general information (age, gender, education, driving history, accident history) and psychological constructs like stress, control, risk tendency and sensation seeking behaviour. Once finished, subjects were instructed about the driving task and received a brief introduction for the handling of the driving simulator. Subjects were asked to drive according to the traffic rules and to maintain a speed of 110 km/h throughout the whole experiment. Additionally, participants were asked to verbalise whenever they spotted a moose on the track. This supplementary task was included to ensure that subjects kept attention to the driving task. Afterwards, subjects took a 7 minutes familiarisation drive to get accustomed to the simulator and the simulation. Subsequently, a brief questionnaire assessing subject’s evaluation of stress, lack of control, workload and risk was administered. This was considered as a baseline measurement. Next, participants had to drive the first test block, in which all three failure types were triggered. The test run (Block 1) lasted approximately 20 minutes. Then, the experimenter instructed the subjects to fill in another online questionnaire outside the simulator. Before filling in the questionnaire, subjects saw a video (with two camera perspectives, Figure 5) of their driving while the first critical incident was ongoing. The subsequent online questionnaire asked for evaluations of expectedness, risk, stress, danger, and lack of control associated with the situation in the video. This procedure was adopted from Ranney, Heydinger, Salaani, Mazzae and Grygier (2003), who studied the effect of a tire failure on driver reactions. Subjects evaluated the impact of unexpected failures on various psychological constructs after they experienced them in the simulator. In the study of Ranney et al. (2003) videos of their driving while tire failure activation were shown to the participants in order to recall how subjects experienced the incident. After the participants evaluated the situation in the present study, workload was assessed with a paper-pencil test. This procedure was repeated for the two other failures in the first test block. Videos of the WHM failures were shown in order of appearance in the test run. Before passing
0 5 10 15 20 25 30
High School University PhD or higher
N u m b er o f t es t su b jec ts
through the second test run (Block 2), subjects were informed about the nature of the incidents. The procedure applied in Block 1 was repeated in Block 2. The order of occurrence as well as location of the incidents differed always between Block 1 and Block 2. Additionally, simulator sickness was assessed in the end.
Figure 5. Screenshot of the video that was shown to the participants.
Finally, the experimenter debriefed the subjects and reimbursed them for their participation with two cinema tickets each. The study lasted 1.5-2 hours. The whole procedure of the simulator experiment can be seen in Figure 6. Table 6 shows a summary of all variables assessed.
Figure 6. Procedure of the simulator experiment.
Sociodemo-graphic quest-ionnaire Familiar-isation period Baseline quest-ionnaire Block 1 (unex-pected failures) Failure evalua-tion 1 Block 2 (expect-ed failures) Failure evalua-tion 2 Debrief-ing
Table 6. Variables which were assessed with questionnaires. First Questionnaire Baseline Evaluation after Block 1 Evaluation after Block 2 Sociodemographics (e.g.,
age, education, gender) x
Driving History (e.g.,
km/year, accidents) x
Knowledge about EVs x
General control x Closeness to reality x Expectancy x x Risk x x x Stress x x x Control x x x
Disturbance Rating Scale x x
Workload (NASA-TLX) x x x
4.3 Results of the simulator study on wheel hub motor failures
4.3.1 Subjective data
The analysis of the subjective data focused on the first failure subjects experienced in the simulator.
4.3.1.1 Failure perception
First, it was assessed whether subjects noticed the WHM failure. This was done with the help of a polar question (“Did you notice anything unusual? - If yes, please, describe what happened in a few sentences.”). The majority of the test subjects noticed for each failure type that something unusual happened while they were driving (about 97 %). Figure 7 illustrates the distribution of frequencies.
Figure 7. Frequency of acknowledged unusual events.
4.3.1.2 Expectancy
Figure 8 illustrates that the majority of subjects did not expect the first failure to happen while driving in the simulator.
Figure 8. Frequency of expectancy ratings over different failure types (1 – “not expected at all” to 5 –
“totally expected“). 0 2 4 6 8 10 12 14 No Yes N u m b er o f t es t su b jec ts Failure perception si ci co 0 2 4 6 8 10 12 1- Not expected at all 2 3 4 5- Totally expected
I expected the situation displayed in the video to happen.
N u m b er o f t es t su b jec ts sisi cici coco
4.3.1.3 Perceived risk
For the investigation of driver risk evaluation, a comparison of unexpected WHM failures to a baseline measurement was undertaken. Participants rated the risk in the situation on a 5-point scale from 1 - “not risky at all” to 5 - “very risky” (“How do you rate the level of risk in the training/in the situation displayed in the video?”).
A mixed repeated-measures ANOVA with the within-subject factor condition (baseline vs. first failure) and the between-subject factor failure type (si, ci, co) was conducted. The risk rating was significantly higher in the failure condition (M = 3.14, SD = 1.13) compared to the baseline (M = 1.80,
SD = 0.95, F(2, 38) = 42.937, p < .001, 𝜂𝑝2 = .53). Failure type and condition did not interact
significantly (F(2, 36) = .823, p = .477, 𝜂𝑝2 = .04), neither did the between-subject factor (failure type)
influence the ratings of risk significantly, F(2, 38) = .062, p = .940, 𝜂𝑝2 = .00.
More precisely, post-hoc pairwise comparisons showed that straight inward (F(1, 13) = 23.15, p <
.001, 𝜂𝑝2 = .64) curve inward failure (F(1, 13) = 15.80, p = .002, 𝜂𝑝2 = .54) and curve outward (F(1, 12) =
7.09, p = .021, 𝜂𝑝2 = .37) differed significantly from the baseline, but. Figure 9 demonstrates the
results.
Figure 9. Evaluation of risk (1 – “not risky at all” to 5 – “very risky”) in baseline and failure conditions
for the different failure types (si, ci, co).
4.3.1.4 Perceived stress
Participants had to rate the stress caused in this situation on a 5-point scale from 1 - “no stress” to 5 - “high stress” (“How was your level of stress in the training drive/ in the situation displayed in the video?”). A baseline measurement of stress was also collected.
A mixed repeated-measures ANOVA on the evaluation of stress with the within-subject factor condition (baseline vs. first failure) and the between-subject factor failure type (si, ci, co) was conducted. Overall, stress was significantly higher in the failure condition (M = 2.73, SD = 0.80)
1 2 3 4 5 si ci co Me an ev alu at ion o f r is k w ith 95% CI Baseline
compared to the baseline condition (M = 2.00, SD = 0.92; F(1, 38) = 19.252, p < .001, 𝜂𝑝2 = .34). The
interaction of failure type and condition did not reach significance, F(2, 38) = .685, p = .510, 𝜂𝑝2 =
.04. Moreover, the failure types did not differ significantly from each other, F(2, 38) = .065, p = .938, 𝜂𝑝2 = .00.
A detailed inspection of post-hoc pairwise comparisons revealed that only the straight inward (F(1,
13) = 14.359, p = .002, 𝜂𝑝2 = .525) and the curve inward (F(1, 13) = 25.787, p = .000, 𝜂𝑝2 = .665) failure
differed significantly from the baseline stress rating but the curve outward WHM failure did not (F(1,
12) = 1.22, p = .291, 𝜂𝑝 2= .092). Figure 10 shows the results.
Figure 10. Evaluation of stress (1 – “no stress” to 5 – “high stress”) in baseline and failure conditions
for the different failure types (si, ci, co).
4.3.1.5 Controllability
Lack of control scale
Control feelings while driving were assessed on a 10-point scale from 1 - “driver has full control” to 10 - “driver has no control” (“Please rate how likely it is that you can remain in control of the vehicle [Steer it, stop it, control speed, etc.] during the training/in this situation on a scale from 1 to 10.”). Again, a mixed repeated-measures ANOVA with the within-subject factor condition (baseline vs. failure) and the between-subject factor failure type (si, ci, co) was conducted. Overall, the lack of control is significantly higher in the failure condition (M = 4.76, SD = 2.14) compared to the baseline
condition (M = 2.80, SD = 1.55; F(1, 36) = 26.074, p < .001, 𝜂𝑝2 = .41). The influence of the different
failure types on the different conditions did not become significant, F(2, 36) = 1.385, p = .263, 𝜂𝑝2=
.07. The between-subject factor failure type did not reveal significant results either, F(2, 38) = 1.107,
p = .341, 𝜂𝑝2= .06.
A closer look on post-hoc pairwise comparisons via ANOVA exposed significant differences between
baseline and failure condition for curve failures (ci: F(1, 13) = 11.911, p = .004, 𝜂𝑝2 = .48; co: F(1, 12) =
1 2 3 4 5 si ci co Me an ev alu at ion o f stre ss w ith 95% CI Baseline
12.827, p = .004, 𝜂𝑝2 = .52), whereas the difference for straight inward failures did not reach
significance (F(1, 13) = 3.03, p = .105, 𝜂𝑝2 = .19). Figure 11 illustrates the results.
Figure 11. Evaluation of control (1 - “driver has full control” to 10 - “driver has no control”) in
baseline and failure conditions for the different failure types (si, ci, co).
Disturbance Rating Scale
Neukum and Krüger (2003) proposed another method for the measurement of control. Subjects were asked to rate disturbances caused by the failure on a scale from “not noticeable” (scale point 0) to “not controllable” (scale point 10). Disturbance ratings were solely obtained for the first and second test block and not for the baseline, because asking for a disturbance before any failure occurred could have prepared subject for the situation. A value of seven or higher represents a critical task to be undertaken. The scale can be seen in Figure 12.
Figure 12. Disturbance Rating Scale (Neukum & Krüger, 2003). 1 2 3 4 5 6 7 8 9 10 si ci co Me an ev alu at ion o f la ck o f co n tro l wi th 95% CI Baseline
A one-way ANOVA on disturbance ratings with the between-subject factor failure type was conducted. Disturbance ratings did not differ significantly between the three failure types, F(2,
32.518) = .797; p = .460, f = .463, with 𝑀𝑠𝑖 = 5.42 (𝑆𝐷𝑠𝑖 = 1.60), 𝑀𝑐𝑖 = 5.07(𝑆𝐷𝑐𝑖 = 2.84), 𝑀𝑐𝑜 = 4.30,
(𝑆𝐷𝑐𝑜 = 2.42), which can be seen in Figure 13.
Figure 13. Evaluation of disturbance (0 – “not noticeable” to 10 – “not controllable”) in failure
conditions for the different failure types (si, ci, co).
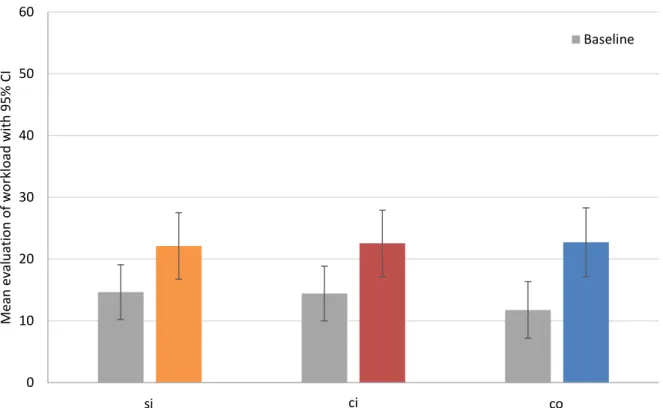
4.3.1.6 Subjective workload
Finally, workload associated with the failure was measured with the NASA-TLX Index (NASA-TLX; Hart & Staveland, 1988). According to Hart and Staveland (1988) workload of the task is judged on six subscales, which are mental, physical and temporal demand (from “very low” to “very high”), performance (from “perfect” to “failure”), effort and frustration (from “very low” to “very high”) on a 100-points scale with 5-point steps. The higher the rating the more workload is reported by the subjects. People are encouraged to mark the scale wherever they want. An exemplary item of the NASA-TLX can be seen in Figure 14.
Figure 14. Item for the subscale mental demand for the NASA-TLX (Hart & Staveland, 1988).
The hypothesis of increased workload due to a failure was tested with mixed repeated-measures ANOVA with the within-subject factor condition (baseline vs. failure) and between-subject factor failure type (si, ci, co). Results revealed that baseline workload measurements are low in general.
Overall, failures significantly differed from the baseline measurement (F(1, 38) = 42.868, p = .000, 𝜂𝑝2
= .53). Workload in failure conditions, M = 22.45 (SD =9.68), was higher than in the baseline, M = 13.64 (SD = 8.09). An interaction between the condition and the failure type was not found (F(2, 38)
= 0.618, p = .544, 𝜂𝑝2 = .03), indicating that the different failure types do not have an impact on the
1 2 3 4 5 6 7 8 9 10 si ci co Me an ev alu at ion o f d is tu rb an ce with 95% CI
workload ratings. Further, the factor failure type did not reach significance, F(2, 38) = 0.100, p = .905, 𝜂𝑝2 = .01. Figure 15 exemplifies the results.
Figure 15. Workload scores in baseline and failure conditions for the different failure types (si, ci, co).
4.3.1.7 Summary of subjective data
Summing up the results from the simulator study, it can be concluded that drivers will acknowledge WHM failures at speeds of 110 km/h. Only two percent did not notice a WHM failure at all. Failures were perceived as being more risky and stressful than solely driving on a road. Especially, failures implemented on the inner side of the lane, regardless of the tested road curvature, are rated more stressful. It can be assumed that failures induce controllability problems. When comparing failures, the ones in curves were rated less controllable. The disturbance caused by the different failure types was rated equally though. Moreover, failures are associated with higher workload, but no difference in workload due to different failures could be found.
0 10 20 30 40 50 60
Straight Curve Inward Curve Outward
Me an ev alu at ion o f work loa d with 95% CI Baseline si ci co
4.3.2 Objective data
Besides the subjective evaluation of failure events, objective parameters help to shed light on driver behaviour in case of failure activation. The parameters steering wheel angle, accelerator and brake pedal position, provide insight on the actions taken in order to handle a failure situation. Therefore, the following analysis focuses on these parameters.
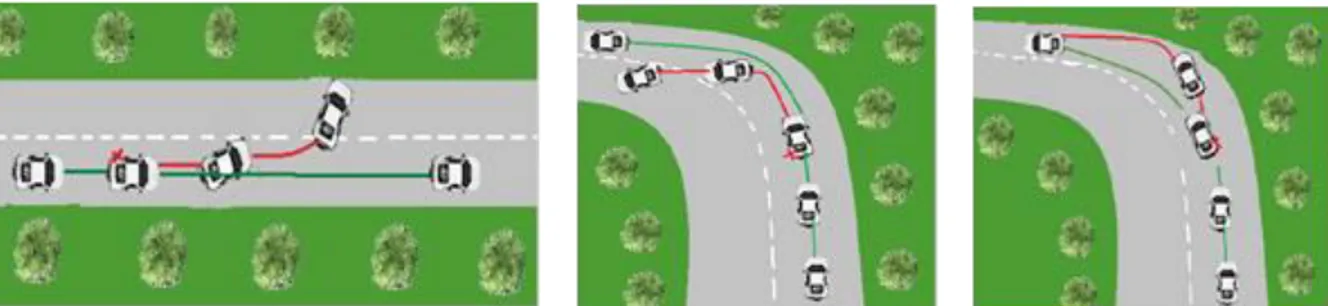
Vehicle dynamics after a WHM failure were examined by Wanner (2013). The WHM failures considered in this work can be represented by the application of a sudden braking torque on the affected wheel. This results in the generation of a yaw torque around the centre of the car, which causes a deviation on the intended vehicle trajectory. The failing WHM produces a deceleration while all the other wheels are still accelerating. Figure 16 illustrates how the different failure types might influence vehicle dynamics.
Figure 16. Vehicle trajectory after the activation of the different failure types (Green line represents
normal trajectory. Red line represents possible trajectory under failure conditions without the intervention of the driver.). Left: si, middle: ci, right: co.
As can be seen in Figure 16, the direction of the vehicle trajectory is altered in accordance to the type of failure. Failures on the left wheel force a change in the direction to travel to the left whereas failures on the right wheel incur on a change to the right. It was predicted, that subjects compensate for these consequences of a WHM failure by steering action.
Inspection of the raw data exposed that none of the subjects - independent of the failure type - braked as a consequences of the WHM failure. Therefore, statistical analysis of brake pedal position was ignored.
4.3.2.1 Conventions
Concerning steering wheel angle and accelerator pedal utilization, 3 seconds of the failure activation period were analysed. As mentioned before, a WHM failure entails deceleration. Since the subjects had the task to maintain the speed of 110 km/h, it was expected from the subjects to accelerate after the failure activation period.
The initial steering wheel angle and accelerator pedal position at failure activation were always controlled in the analyses conducted here. This was ensured by including a covariate in the analysis, which was the difference between the intital value of each parameter.
For the analysis of objective driving data focus was set on the very first failure the subjects experienced in the simulator.