Faculty of Natural Resources and Agricultural Sciences (NJ)
Factors explaining variation in the fecundity
of female Baltic salmon (Salmo salar)
– the influence of length, body condition and
growth rate at sea
Ulrika Tollerz Bratteby
Factors explaining variation in the fecundity of female Baltic
salmon (Salmo salar) – the influence of length, body condition
and growth rate at sea
Ulrika Tollerz Bratteby
Supervisor: Magnus Huss, SLU, Department of Aquatic Resources Assistant supervisor: Philip Jacobson, SLU, Department of Aquatic Resources Examiner: Örjan Östman, SLU, Department of Aquatic Resources
Credits: [30] credits
Level: Second cycle, A2E
Course title: Master thesis in Biology, A2E
Course code: EX0895
Course coordinating department: Department of Aquatic Sciences and Assessment
Place of publication: Öregrund, Sweden
Year of publication: 2019
Online publication: https://stud.epsilon.slu.se
Keywords: Atlantic salmon; Baltic Sea; fecundity; body size; body condition; growth rate; scale reading.
Understanding factors influencing variation in fecundity is crucial to manage Atlantic salmon (Salmo salar) populations in the Baltic Sea. Larger individuals usually have a higher size-specific reproductive investment than smaller individuals, thus leading to a higher fecundity. Still, fecundity varies a lot among equally sized individuals and there is little known about what is causing this variation. In this study, I consider the effects of body length, condition and growth rate at sea on fecundity in Atlantic salmon females in the Baltic Sea. I collected fecundity data and data on growth rate history at sea in salmon originating from river Dalälven, which returned to spawn in mid-July to September 2004-2018, after spending two years at sea. I used scales to analyze marine growth patterns of the salmon. My results show that length is the factor that has the greatest influence on Atlantic salmon fecundity. Nevertheless, the relationship between fecundity, length and body condition varies among these years. In addition, there is a declining trend of how much of the variation in fecundity that can be explained by the interactive effect of length and body condition at the time of return to the river for spawning. Using circuli formation rate and inter-circuli distance as proxies for body growth, I show that growth rate during the first and second year at sea does not add to explain fecundity variation, after accounting for length and body condition. Still, being the factor determining body length, growth rate evidently has a great indirect effect on the fecundity of female Atlantic salmon. Individuals that grew poorly during their first year at sea did not compensate for their poor growth by growing faster during their second year at sea. In addition, the two growth estimates proved not to be related, which indicates that they are in fact independent factors of marine growth rate.
Though it may be other factors than marine growth patterns that are causing variation in the fecundity of same-sized female Atlantic salmon in the Baltic Sea, limitations to my dataset on growth rate at sea means it is still relevant to contemplate this as an independent factor possibly affecting fecundity. Furthermore, I conclude that it is important to include the rate at which circuli are formed in addition to the inter-circuli distance when using this method to similar or other studies in the future.
Keywords: Atlantic salmon, Salmo salar, Baltic Sea, fecundity, body size, body con-dition, growth rate, scale reading.
För att förvalta och bevara populationerna av atlantlax (Salmo salar) som finns i Ös-tersjön är det viktigt att förstå vilka parametrar som påverkar deras fekunditet. Det är välkänt att stora och tjocka honor har högre fekunditet, med bland annat större eller fler ägg. Men vad orsakar variationen i fekunditet hos individer som är lika stora? I denna studie har jag beaktat effekterna av kroppsstorlek, kondition och tillväxtmöns-ter till havs på fekunditet hos laxhonor i Östillväxtmöns-tersjön. Jag samlade fekunditetsdata och data över tillväxtmönster under tiden till havs från honor som härstammade från Dalälven och som återvände för att leka i mitten av juli fram till september 2004-2018. För att studera honornas tillväxtmönster till havs använde jag laxfjäll från in-divider som fångades under sensommaren 2018, vilka återvände till Dalälven efter att ha spenderat två år till havs. Mina resultat visar att kroppslängden när honorna återvänder för att leka är den faktor som förklarar det mesta av variationen i fe-kunditet mellan år. Under 2004-2018 varierade förhållandet mellan fefe-kunditet, kroppslängd och kondition och det blev allt mindre av variationen i fekunditet som kunde förklaras av dessa parametrar och av interaktionen mellan dem. Genom att använda hastigheten för bildandet av fjällets så kallade strior samt avståndet mellan dessa för att uppskatta tillväxthastigheten till havs visar jag att tillväxtmönster under det första och andra året som laxhonorna spenderar i Östersjön inte har någon direkt effekt på deras fekunditet. Men, eftersom den totala tillväxten till havs är det som avgör kroppslängden när laxarna återvänder för att leka har den ändå en stor indirekt effekt på honornas fekunditet. Individer som växte långsamt under sitt första år till havs växte dåligt även under det andra året, vilket innebär att det inte sker någon kompensatorisk tillväxt. Dessutom visade det sig att hastigheten med vilken det bil-das strior och avståndet mellan striorna är oberoende av varandra och således inte indikerar samma sak vad gäller tillväxtmönster till havs.
Även om det kan finnas andra faktorer som förklarar varför det finns skillnader i fekunditet hos atlantlax som är lika stora och som lever i Östersjön finns det begräns-ningar i min data som innebär att fortfarande är relevant att fortsätta studera tillväxt-mönster till havs i detta avseende. Utifrån mina resultat drar jag även slutsatsen att det är viktigt att använda bägge tillväxtmått inte enbart titta på avståndet mellan stri-orna, när denna metod används för liknande eller för andra syften i framtiden. Nyckelord: Atlantlax, Salmo salar, Östersjön, fekunditet, kroppslängd, kondition, tillväxthastighet, tillväxtmönster, fjäll.
1 Introduction 5
2 Materials and Methods 8
2.1 Study species and system 8
2.2 Fish growth and aging fish 9
2.3 Fecundity data 10
2.4 Scale preparation and growth rate analysis 12
2.5 Statistical analysis 12
3 Results 15
3.1 Variation in length, body condition and fecundity 15
3.2 Variation in and consequences of early and late growth rate at sea 18
3.3 Growth rate at sea affecting fecundity 20
4 Discussion 23 5 References 28 Acknowledgements 35 Appendix 1 36 Appendix 2 38
Table of contents
In most fishes, including Atlantic salmon (Salmo salar), there is a positive relation-ship between female body size and the number and size of eggs produced (Fleming 1996; Marteinsdottir & Begg 2002; Barneche et al. 2018). One of the reasons for this is that the size-specific reproductive investment is higher in larger individuals than smaller individuals (Jonsson et al. 1991b, 1997). To better understand variation in female fecundity, it is therefore important to consider variation in adult body size. Still, even though the fitness advantages of a big old fat fecund female fish are well known both in general (Hixon et al. 2014) and for salmonids specifically (Fleming 1996; Dickerson et al. 2002; Reid & Chaput 2012), less is known about what is causing variation in fecundity of equally sized individuals (Thorpe et al. 1984; Dick-erson et al. 2002; Quinn et al. 2011). The environment experienced at sea, e.g. dif-ferent prey communities, water currents and temperatures, could potentially affect the fecundity of Atlantic salmon females (Jonsson & Jonsson 2009; Keinänen et al. 2012, 2018) through favouring energy allocation into either somatic growth or en-ergy storage (Fleming 1996). When considering the effects of growth patterns (i.e. the subsequent periods of high or low growth rates) at sea on fecundity for different salmonid species, previous research have been inconclusive, as studies have shown both positive (Quinn et al. 2004, 2011) and no (Jonsson et al. 1996) relationship between growth patterns at sea and fecundity. One potential reason for such varying relationships could be that these studies are made on different salmonid species and systems. Another could be that the authors used different methods for calculating growth at sea, e.g. using scale readings for comparing the size of adult fish to that of the time when the juvenile migrated out to sea with (Quinn et al. 2004) or without (Jonsson et al. 1996) considering the number of growth seasons the salmon spent at sea. Yet, given that growth at sea might influence fecundity of equally sized salmon and, since only one of these studies have investigated the direct effects of growth patterns at sea on Atlantic salmon fecundity, we still do not know how growth pat-terns at sea affect the fecundity of equally sized Atlantic salmon in other systems than River Imsa (Jonsson et al. 1996).
Most fish have indeterminate growth, meaning they continue to grow throughout their lives. Individual differences in growth rate causes variation in size-at-age of Atlantic salmon (Forseth et al. 2011) and it also influence the age or size at which an individual reaches sexual maturity (Wootton 1998). In addition, since individuals can grow at different rates during their life-span, individuals of the same age and size can vary in their growth histories (Dietrich & Cunjak 2007). For several anad-romous salmonid species, growth varies depending on e.g. biotic factors such as food availability (Keeley & Grant 2001), age and body size (Forseth et al. 2011), and inter- or intraspecific interactions (Pyper & Peterman 1999; Chamberlin et al. 2017), or with abiotic factors such as water temperature (Handeland et al. 1998; Friedland 2000), salinity (Handeland et al. 1998), oxygen level (Brett 1952; Hosfeld et al. 2008) and photoperiod cycles (Björnsson 1997; Fjelldal et al. 2005). For At-lantic salmon in the Baltic Sea, there is great spatial variation in prey availability, prey quality, temperature and salinity, which could affect the growth potential of salmon depending on where it is feeding (Casini et al. 2014; Keinänen et al. 2017; Jacobson et al. 2018).
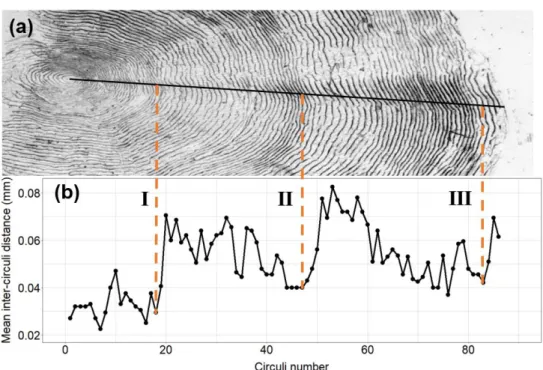
In seasonal environments, the growth of fish is higher during the warm compared to the cold seasons (Forseth et al. 2011). Such annual patterns, where a season with low growth rate follows one of fast growth, as well as when salmon undergo their ontogenetic habitat shift between fresh and salt water, can be traced by irregularities in calcified structures such as scales (Frost & Kipling 1959; Steinmetz & Müller 1991), otoliths (Tsukamoto & Kajihara 1987) and bones (Le Cren 1947; Frost & Kipling 1959). In salmon, fish scales are typically used for age determination and growth analyses (Fisher & Pearcy 1990; ICES 1998; Marco-Ruis et al. 2013). Sim-ilar to tree growth rings, scale circuli are deposited at the scale margin as fish grow (Wootton 1998). The scale circuli formation rate and the distance between succes-sive pairs of scale growth rings (inter-circuli distance) of salmonids have been found to positively correlate with growth rate (Fisher & Pearcy 1990, 2005). Thus, varia-tion in body growth patterns can be studied by calculating the number of circuli and the inter-circuli distance (Peyronnet et al. 2007) (Fig. 1). The faster the fish grows, the more circuli is formed per unit time and/or the wider is the spacing between circuli (Doyle et al. 1987; Fisher & Pearcy 1990).
In this study, I used scales to analyse the growth patterns at sea of female Atlantic salmon originating from the Swedish river Dalälven, which is connected to the Bal-tic Sea. In addition, I studied the relationship between fecundity and body length, body condition and growth at sea of returning salmon in Dalälven. I specifically ask if (1) the explanatory power of the relationship between length, condition and
salmon fecundity varies between years, (2) whether there is a relationship between growth during the first and second year at sea and (3) if variation in the fecundity of same-sized female salmon could be explained by differences in growth patterns at sea, after accounting for their length and body condition. I hypothesize that (i) the relationship between length, condition and salmon fecundity is constant between years, (ii) that growth during the second year at sea depends on the growth rate the year before, and consequently, that an individual that grow poorly during its first year at sea will compensate for this by growing faster during the next. Finally, I hypothesize that (iii) differences in marine growth pattern between individuals can explain variation in the fecundity of same-sized Atlantic salmon females.
2.1 Study species and system
In the Baltic Sea, there are distinct genetic populations of Atlantic salmon. Anthro-pogenic activities such as damming of rivers for hydropower and stream alterations for logging (e.g. channel widening and displacement of main-channel gravels) have negatively affected the overall ecological status of Baltic Sea rivers and as a conse-quence, degraded salmon reproduction areas and the life conditions of Baltic salmon (Johansen et al. 2001; HELCOM 2011). Because these modifications have de-creased the reproduction potential for salmon, many populations in the Baltic Sea experienced a severe decline starting in the middle of the 19th century as they could not sustain themselves via natural reproduction (Karlsson & Karlström 1994; HEL-COM 2018; ICES 2018). To compensate for the reduction in natural production, stocking of salmon has been widely practised. In 2017, 4.3 million salmon smolts were released into the Baltic Sea while the total wild production in all Baltic Sea rivers combined was 3.5 million smolts (ICES 2018).
Having an anadromous life history pattern, the Atlantic salmon hatch and develop as juveniles in the river, then migrating to the sea where they undergo most of their growth (McDowall 1997; Klemetsen et al. 2003). Once reaching maturation, they return to their natal river to spawn. Before leaving the river, juvenile salmon un-dergo the process of smoltification through which it unun-dergoes changes to cope with life at sea (Hoar 1988). Emigrating Atlantic salmon post-smolts are assumed to shift to a piscivorous diet at the earliest possible occasion (Mitans 1970; Levings 1994; Sturlaugsson 1994), ultimately relating to the individual size of the juvenile salmon (Salminen et al. 2001). After smoltification, there is a key feeding period during the first few months at sea. During this time, the salmon experience a rapid increase in
growth, which reduces predation risk (Friedland & Haas 1996; Rikardsen & Demp-son 2011), and they continue to grow and store energy until the onset of maturation. Some individuals become sexually mature after their first winter at sea (individuals referred to as one-sea winter, 1SW) while others reach maturation after spending several years at sea (multi-sea winter, MSW) (Vladić & Petersson 2015). The At-lantic salmon is iteroparous, meaning it can reproduce several times over its lifetime (Fleming 1996; Thorstad et al. 2011). However, most adults spawn only once before dying (Fleming & Reynolds 2004; Jonsson & Jonsson 2004). Due to its strong hom-ing behaviour (Stabell 1984; Thorstad et al. 2011), the majority of the Atlantic salmon individuals usually find their natal river after reaching sexual maturation, where they will migrate upstream to spawn in the area they left as smolts. Given that Atlantic salmon do not feed during the time between reaching their natal river (May-July) and the actual spawning event (November-December), they rely on the energy storage they have accumulated while feeding at sea to survive the upstream migration, develop gonads and to successfully spawn (Fleming 1996; Siira et al. 2009; Whitlock et al. 2018).
I conducted this study on one of the Baltic populations of Atlantic salmon (hence-forth referred to as Baltic salmon), which were reared at Älvkarleby Fisheries Re-search Station, situated in the river Dalälven in central Sweden. Because of the hy-dro-electric power plant built in Älvkarleby in 1915, anadromous fish are unable to migrate upstream beyond the first dam to reproduce. Due to this migration barrier, the salmon population in river Dalälven is dependent on compensatory releases of salmon smolt to compensate for the loss in natural production (Petersson et al. 1996). At the Fisheries Research Station in Älvkarleby, roe from spawning females is fertilized and the offspring are reared in tanks until smoltification, when the juve-niles become silvery and start to swim with the current instead of against it in the rearing tanks. This usually happens after two years in the hatchery, at a size of 170 to 220 mm (ICES 1998). The research station releases approximately 140 000 hatch-ery reared salmon and trout each year (ICES 2018).
2.2 Fish growth and aging fish
To study the growth rates experienced by the Baltic salmon during its time at sea, I used fish scales. Most fishes in the Baltic Sea grow considerably slower during win-ter (Diana 1979). When growth rate increases due to favourable conditions, as it does e.g. when the Baltic salmon smolts migrate from their natal river out to sea, it is visible in the scale as more circuli (visible as circular ridges, Fig. 1a) are being
formed per unit time (Doyle et al. 1987) and the circuli spacing, i.e. the distance between circuli, becomes wider (Fisher & Pearcy 1990) (Fig. 1b). Consequently, the end of the freshwater growth zone i.e. the time of sea migration can be visually identified by a substantial increase in inter-circuli distances (Wootton 1998). I iden-tified this transition zone, i.e. the beginning of the marine growth zone, as in ICES (2011) (Fig. 1b). During winter, inter-circuli distances are short (Wootton 1998). In accordance to Shearer (1992), I considered one year of marine growth to be com-plete where the last of the narrow spaced circuli of the winter band transitioned into the first of the wide-spaced circuli of the following summer band (ICES 2011) (Fig. 1b). I defined the start of the second year at sea as being equal to the end of the first. I used two parameters as estimates of fish growth rate: inter-circuli distance and number of circuli (Fig. 1a).
Figure 1. Scale impression of a 2SW female salmon caught in river Dalälven 2018. (a) The proxies for
growth rate used in this study include the number of circuli formed during one growth season and the inter-circuli distances. (b) Scale features also include (I) the focus, (II) the beginning of the marine growth zone and the end of (III) the first and (IV) second sea winter.
2.3 Fecundity data
In 2004-2018, Baltic salmon migrating upstream to spawn in river Dalälven were caught in a fish trap located at the first dam. When the fish are caught, in mid-July to September, all individuals are tagged, weighted and length-measured. Females
and males are kept in separate tanks until the spawning event, which usually stretches from mid-October to late November. The fish are continuously monitored, and their health condition and reproductive status are supervised when approaching the time for spawning. When ready to spawn, the female salmon are sedated, weighted, measured and stripped of roe, and then weighted again (Table 1). Data collected on female fecundity include total egg biomass, volume, size, and colour. I used total egg biomass as the estimate of fecundity. This was given by subtracting the female’s weight after being stripped for roe from the weight measured before. I used Fulton’s K (Ricker 1975) as a measurement of body condition, following Eq. 1:
𝐾 = 100𝑊
𝐿3 (Eq. 1.)
where W is fish wet weight in grams, and L is body length in centimetres, with both measurements taken on the returning salmon at catch.
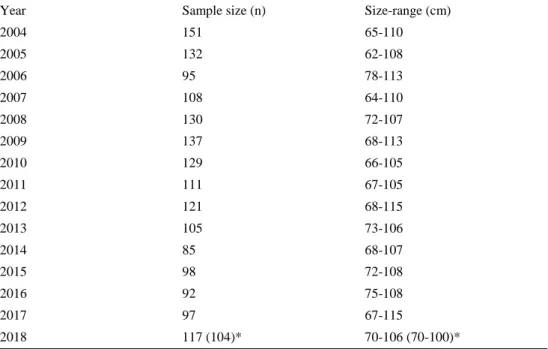
Table 1. Number of individuals (n) sampled from river Dalälven for data collection on fecundity.
Year Sample size (n) Size-range (cm)
2004 151 65-110 2005 132 62-108 2006 95 78-113 2007 108 64-110 2008 130 72-107 2009 137 68-113 2010 129 66-105 2011 111 67-105 2012 121 68-115 2013 105 73-106 2014 85 68-107 2015 98 72-108 2016 92 75-108 2017 97 67-115 2018 117 (104)* 70-106 (70-100)*
2.4 Scale preparation and growth rate analysis
Scales were sampled from a restricted area close to the adipose fin and above the lateral line in females caught in 2017-2018. In 2017, scales were collected at the time of spawning (late fall). In 2018, scales were taken already when the fish were caught in the trap during summer. The scales were stored in paper envelopes until I prepared them for growth analyses. This process included making an impression of each scale by pressing them onto an acetate slide by a jewellery roller (Salsea-Merge 2008). I used a stereoscopic microscope (Olympus SZX9 with 16x magnification) with a digital camera (Olympus DFPL with 0.5x magnification) to record an image of each scale impression, with a calibrated scale bar for reference (Fig. 1b). For each image, measurements of marine growth rate were made using the open source pro-cessing program ImageJ, version 1.52i (ICES 2013; Rueden et al. 2017), applying the macro “Tree rings” in plugin ObjectJ, version 1.04q (Vischer & Nastase 2009). All distances, measured in millimetre, started at the centre of the focus, or in the case of so called replacement scales (where the original scale has been lost): from the middle of the central region, to the scale margin (Fig. 1b). The software marks circuli automatically by analysing the contrast between the dark circuli and the light spacing and it also calculates the inter-circuli distances (Fig. 2 and Appendix 2). Still, to make sure the software did not exclude or added circuli, I checked and if necessary corrected circuli markings for each scale image manually. I used a subset of two scales per female and made two separate readings for each scale to minimize sampling variation (Haraldstad et al. 2016). Based on these readings, I obtained a mean value of the number of individual circuli and the mean inter-circuli for each scale and individual. Given the poor condition of the scales collected in 2017, most likely because of sampling close to the spawning event before which the scales start to degrade (ICES 2011), these were not included in the analyses.
2.5 Statistical analysis
I statistically tested if (1) the explanatory power of the relationship between length and condition on salmon fecundity varies between years, (2) whether there is a re-lationship between growth during the first and second year at sea in females caught in 2018 and (3) if variation in the fecundity of the 2018 same-sized female salmon can be explained by differences in growth during the first and second year at sea, after accounting for their length and body condition. I used linear regression models to analyse the relationship between female fecundity (total egg mass) and length and body condition (Fulton’s K) at the time of return to river, including the interaction between length and body condition. I conducted model selection based on the
Akaike Information Criterion (AIC), of which I selected the model(s) with the low-est AIC value (+ 2 units). This allowed me to study which models that were the most parsimonious.
I applied model selection for analysing growth-related effects on length, body con-dition and fecundity. For this purpose, I used a subset of the scale data so that it only consisted of the females that had spent two winters at sea (here forth referred to as “2SW”), collected in 2018 (Table 1), since there were no 1SW individuals and be-cause the sample size of individuals older than 2SW were too small (n = 13) to be used in any statistical analyses. I used linear regression to assess the relationship between growth rate during the first and second year spent at sea. To asses if indi-vidual variation in growth rate varied between the first and second year, I compared the coefficient of variation (CV) for each growth season. Using Pearson’s product moment correlation, I also examined if there was a correlation between the two dif-ferent estimates of growth rate at sea; scale inter-circuli spacing and the number of circuli deposited. Lastly, I tested whether growth rate at sea, both during the first and second year, affects fecundity after accounting for the effect of body size and
Figure 2. From the scale image (a) of a 2SW Baltic salmon female, circuli is automatically marked by
ImageJ plugin ObjectJ along the black line, which provides a growth rate profile (b) of the mean inter-circuli distances. From the profile, it is possible to visually identify the start of the marine growth phase (I), the first (II) and the second (III) winter at sea.
condition. This was done by fitting a linear regression model using the growth proxies inter-circuli distance and number of circuli to the residuals obtained from the linear regression model including interactive effect of body length and condition on female fecundity. I used adjusted R2 as the coefficient of determination and I
conducted all statistical analysis using the software R, version 3.5.2 (R Core Team 2018). P-values of 0.05 or less were considered as significant.
3.1 Variation in length, body condition and fecundity
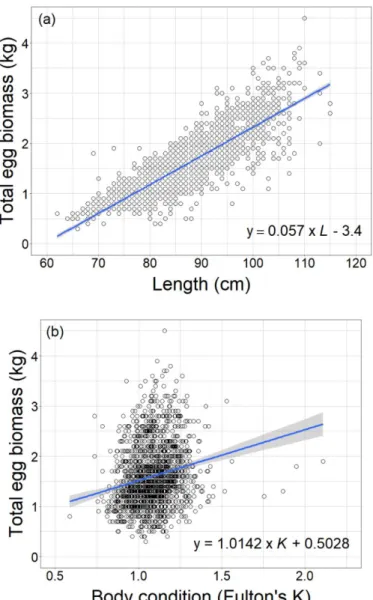
During 2004-2018, the mean length of female salmon at return to river Dalälven varied between 84.4-93.0 cm and the mean body condition (Fulton’s K) at catch varied between 0.97-1.16 (Fig. 3a, b). There was a positive relationship between female fecundity (i.e. total egg biomass) and body length (F1,1708 = 3979, R2 = 0.70,
P < 0.001) (Fig. 4a) and condition (F1,1708 = 75.80, R2 = 0.04, P < 0.001) (Fig. 4b) at
return to river Dalälven, for all years combined. Four outliers were identified (con-dition factor >1.6) (Fig. 4b), but these had no major influence on the above relation-ship (F1,1704 = 85.47, R2 = 0.05, P < 0.001). Length, rather than body condition, was
the variable explaining most of the variation in fecundity (Table 2) while the most parsimonious model explaining fecundity, in addition to length, included the inter-action between length and body condition (Table 2). However, there was large var-iation in the explanatory power of this interaction among years (R2 ranging between
0.66-0.90) and it declined during the study period (F1,13 = 9.98, R2 = 0.39, P <
0.0075) (Fig. 5).
Table 2. Variables, coefficients and the corresponding AIC values of the linear regression models of
fecundity in female Baltic salmon collected in Dalälven 2004-2018. Fecundity is measured as total egg biomass per individual. Body length and condition factor (Fulton’s K) were measured at return to the river. The model with the lowest AIC value is highlighted in bold.
Model parameters AIC F(df) R2 P
Length x Condition 378 2381.00 (3,1706) 0.81 < 0.001 Length + Condition 408 3491.00 (2,1707) 0.80 < 0.001
Length 1132 3979.00 (1,1708) 0.70 < 0.001
Condition 3114 75.80 (1,1708) 0.04 < 0.001
Note: AIC, Akaike Information Criterion.
3
Results
Figure 3. (a) Mean length (cm, ±1 standard deviation, S.D), and (b) mean body condition (±1 S.D),
calculated as Fulton’s K, of female Baltic salmon at return for spawning in river Dalälven for the years 2004-2018.
Figure 4. The relationships between (a) length (cm), (b) body condition (Fulton’s K, at return to river)
and total egg biomass (per individual) of salmon in river Dalälven 2004-2018. Solid lines represent significant relationships.
Figure 5. Annual variation in explanatory power (adjusted R2) of the regression model explaining produced egg biomass (i.e. fecundity) per individual for the years 2004-2018 as a function of length (cm) and body condition (Fulton’s K, at return to river Dalälven) and their interaction.
3.2 Variation in and consequences of early and late growth
rate at sea
Salmon body size, at the time of return to river, had a significant and positive rela-tionship to the number of circuli, but showed no relarela-tionship to inter-circuli distance (Table 3 and Appendix 1). Neither of the two growth estimates could add to explain variation in condition (Table 4 and Appendix 1). In 2018, growth rate (measured as inter-circuli distance and number of circuli) varied substantially among individuals, but more so during the first year at sea than during the second (Fig. 6a-d). There was no correlation between the two growth measurements, inter-circuli distance and the number of circuli (R = 0.00, P = 0.73). However, there was a positive relation-ship between indicators of marine growth rate during the first and second year at sea, both when measured as inter-circuli distance (F1,88 = 18.27, R2 = 0.16, P < 0.001)
(Fig. 7a) and as number of circuli deposited (F1,88= 5.49, R2= 0.05, P < 0.02) (Fig.
Tabell 3. Variables, coefficients and the corresponding AIC-values of the linear regression models
explaining length at return to the river in 2SW female Baltic salmon (collected in Dalälven 2018). 0+ refers to the first year spent at sea and 1+ to the second. The model(s) with the lowest AIC value is highlighted in bold.
Model parameters AIC F(df) R2 P
Mean inter-circuli distance 1+ 555 0.05 (1,88) -0.01 0.82 Mean inter-circuli distance 0+ + 1+ 556 0.72 (2,87) -0.01 0.49 Mean inter-circuli distance 0+ x 1+ 558 0.48 (3,86) -0.02 0.70 Mean inter-circuli distance 0+ 632 1.14 (1,100) 0.00 0.29
Mean number of circuli 0+ x 1+ 534 9.00 (3,86) 0.21 < 0.001 Mean number of circuli 1+ 539 17,59 (1,88) 0.16 < 0.001 Mean number of circuli 0+ + 1+ 540 9.12 (2.87) 0.15 < 0.001 Mean number of circuli 0+ 623 10.20 (1,100) 0.08 < 0.01
Note: AIC, Akaike Information Criterion.
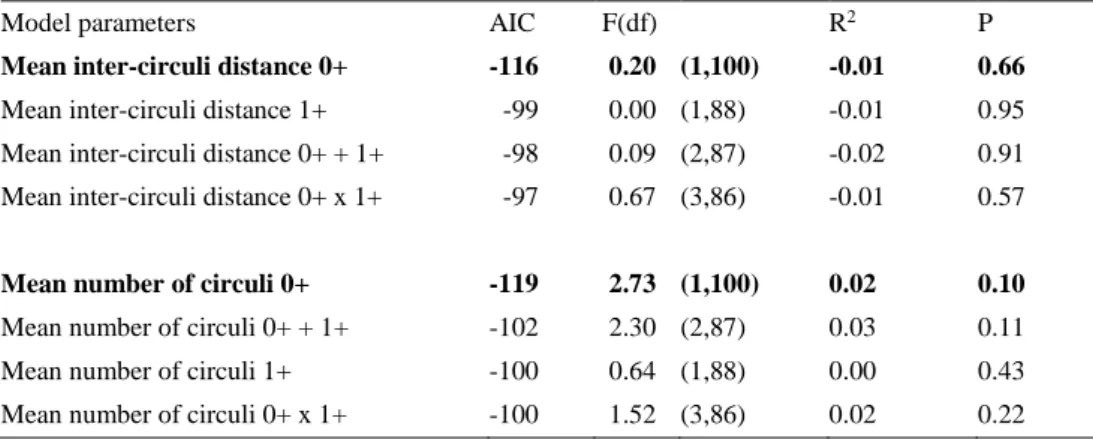
Tabell 4. Variables, coefficients and the corresponding AIC-values of the linear regression models
explaining condition at return to the river in 2SW female Baltic salmon (collected in Dalälven 2018). 0+ refers to the first year spent at sea and 1+ the second. The model(s) with the lowest AIC value is highlighted in bold.
Model parameters AIC F(df) R2 P
Mean inter-circuli distance 0+ -116 0.20 (1,100) -0.01 0.66 Mean inter-circuli distance 1+ -99 0.00 (1,88) -0.01 0.95 Mean inter-circuli distance 0+ + 1+ -98 0.09 (2,87) -0.02 0.91 Mean inter-circuli distance 0+ x 1+ -97 0.67 (3,86) -0.01 0.57
Mean number of circuli 0+ -119 2.73 (1,100) 0.02 0.10 Mean number of circuli 0+ + 1+ -102 2.30 (2,87) 0.03 0.11
Mean number of circuli 1+ -100 0.64 (1,88) 0.00 0.43
Mean number of circuli 0+ x 1+ -100 1.52 (3,86) 0.02 0.22
Figure 6. The variation in each of the two growth estimates for all female 2SW in-dividuals caught in river Dalälven 2018: mean inter-circuli distance (mm) in 2SW female salmon during (a) the first (0+) and (b) second (1+) year at sea, and mean number of circuli in 2SW female salmon during (c) the first (0+) and (d) second (1+) year at sea. Each point represents one individual.
3.3 Growth rate at sea affecting fecundity
There was no relationship between growth estimates during the first or second year at sea and fecundity in 2SW female salmon 2018, in addition to what was already explained by the interaction of length and body condition (for which F3,100 = 51.05,
R2 = 0.59, P < 0.001). This held true for both estimates of growth; neither the
inter-circuli distance during the first (F1,100 = 1.75, R2 = 0.01, P = 0.19; Fig. 8a) or second
(F1,88 = 0.14, adjusted R2 = -0.01, P = 0.71; Fig. 8b) year at sea nor the number of
circuli during these sea years (first year: F1,100 = 3.31, R2 = 0.02 , P = 0.07; second
year: F1,88 = 0.00, R2 = -0.01, P = 0.98; Fig. 8c, d) could provide any additional
explanation to variation in fecundity after accounting for that explained by length, body condition and their interaction at return to the river.
Figure 7. Relationships between the first and second year growth rate in female Baltic salmon at sea,
based on (a) mean inter-circuli distance (mm) and (b) mean number of circuli. Solid lines represent significant relationships.
Figure 8. Relationship between the residuals obtained from the regression model explaining fecundity
(total egg biomass) as a function of body length, condition and their interaction, at return to river Dalälven, and growth at sea (measured as mean inter-circuli distance) during (a) the first and (b) second year at sea. Also, the relationship between the residuals and growth at sea (measured as mean number of circuli) during (c) the first and (d) second year at sea.
In this study, I show that there is year-to-year variation in the length and body con-dition of female Baltic salmon at the time of return to river Dalälven. Even though fecundity as expected was closely related to body size, I found that there was a de-cline over time in how much of the variation in fecundity that could be explained by female length and body condition. By using scale readings to determine salmon growth rate at sea, I show that individual variation in growth arises already during the first year at sea. In addition, high growth rates during the first year at sea meant high growth rates during the second year at sea. Thus, there is no evidence of com-pensatory growth, meaning that individuals do not compensate for poor growth dur-ing the first year at sea by growdur-ing faster durdur-ing the second. I also find that female growth history at sea do not provide any additional explanation to why there is var-iation in fecundity, beyond the effects of length and body condition.
Fecundity evidently increases with female body size and condition, as has been con-firmed in numerous studies on Atlantic salmon (Thorpe et al. 1984; Fleming 1996; Moffett et al. 2006; Reid & Chaput 2012; de Eyto et al. 2015). In accordance with my results, Moffett et al. (2006) identified length of Atlantic salmon to be the factor explaining the majority of the variation in fecundity (egg number). In addition to body length, Burton et al. (2013) found, similar to what is the case in my study, i.e. that an increase in body condition, for a given body size, led to an increase in fecun-dity. Still, I show that there are substantial differences in the extent to which varia-tion in fecundity is explained by length and body condivaria-tion (adjusted R2 ranging
between 0.66-0.90), and that the explanatory power of this interaction decreased in 2004-2018. This means that it at present is a lot of unexplained variation in fecundity (19 %) among female salmon in river Dalälven. There are several reasons why it is important to identify factors that can help predicting fecundity in Baltic salmon, including management of salmon populations in the Baltic Sea for conservation pur-poses and fisheries management. One factor that could add to explain the variation in fecundity other than length and condition, and which I have studied, is variation
in growth rate during the time spent at sea. However, using growth estimates from scales readings, I find that growth rate variation among female salmon adds little explanation to the remaining variation in fecundity after accounting for that ex-plained by length and body condition. Nevertheless, since my study only included salmon which had matured after spending two years at sea, caught in 2018, it is also possible that the results would have been different if the study had included data collected over several years, multiple year-classes or if I had used a different meth-odology when measuring growth rate (e.g. studying the variation in growth during specific periods during the growth season).
Despite using different proxies for growth rate (i.e. calculating growth as the differ-ence between adult body length and smolt length, divided by the number of growth seasons at sea), Jonsson et al. (1996) came to the same conclusion as I, i.e. that growth patterns at sea add little to explain variation in fecundity of Atlantic salmon, beyond the effect on body length at the time of return to river. Though using number of eggs and egg size as estimates of fecundity, two previous studies rather suggest that growth rate during the juvenile freshwater period affect Atlantic salmon fecun-dity, as higher growth rate during the time in freshwater led to more eggs but smaller egg size, independent of the effects of adult body size (Thorpe et al. 1984; Jonsson et al. 1996). Still, there are also studies on other anadromous salmonids suggesting that fecundity (e.g. number of eggs) differs depending on growth rate at sea, after controlling for body length (Quinn et al. 2004, 2011).
There are several reasons for why individuals can exhibit different grow rates at sea. These can include e.g. the effect of different “personal traits” such as risk taking behaviour when foraging (Biro et al. 2004) or differences in prey availability due to variation in the spatial distribution of Atlantic salmon in the Baltic Sea and thus, variation in feeding area (Kallio-Nyberg & Ikonen, 1992; Ikonen, 2006). Salmon prey species (Hansson et al. 2001; Vuorinen et al. 2014; Keinänen et al. 2018), size-specific prey availability (Jacobson et al. 2018) and prey quality (Keinänen et al. 2012, 2017; Casini et al. 2014) all varies spatially in the Baltic Sea. Interestingly, individuals form the same river (including my study system, river Dalälven) and born the same year feed in different areas of the Baltic Sea (Jacobson et al., 2019, under review). How individuals behave when foraging and the differences in feed-ing areas and thus, food resources, may influence how much energy the individual can invest in somatic growth, therefore affecting the fecundity indirectly. However, based on my results it is likely that other factors than growth at sea influence the fecundity of salmon females in addition to final length and condition. Such factors could include e.g. variation in how much individuals invest in gonad development
(Alonso-Fernández et al. 2009). Also, the effects of variation in environmental con-ditions such as temperature, changes in prey quality and potentially the influence of environmental stressors such as toxins and diseases might not be visible in terms of affecting length or body condition, but may still influence fecundity. This could also be the reason why there is a decline in how much length and body condition to explain variation in fecundity among the years of this study.
Another possible factor causing variation in fecundity, not related to body growth rate at sea, is the influence of the conditions faced by the salmon when returning to the river to spawn. Salmon do not feed from the time that they leave the sea until the spawning event (Fleming 1996; Siira et al. 2009; Whitlock et al. 2018). Thus, while migrating upstream the river to reach their spawning grounds (in our study system, the dam is the first migration barrier), they rely on the energy that was stored during the time the salmon fed at sea. This energy is mainly allocated into three processes: metabolism, swimming and gonad development (Fleming 1996). As for other ectotherms, high temperatures increase the metabolic rate of fish. Thus, higher water temperatures could lead to a corresponding decrease in the amount of energy available for the salmon to invest in e.g. gonads (Jonsson et al. 1991a; Angilletta et al. 2002). Indeed, in a study by King et al. (2003), female Atlantic salmon that were exposed to elevated temperature during vitellogenesis (i.e. the phase of rapid ovar-ian growth which usually takes place during the summer and early autumn prior to the spawning event) experienced significant reduction in fecundity. Similarly, Pank-hurst et al. (1996) found that in rainbow trout (Oncorhynchus mykiss), there were few fish that ovulated at elevated water temperatures and the fish that did had sig-nificantly lower egg production. The influence of river temperature on salmon fe-cundity was not studied here but would be an important factor to investigate in future studies aiming to explain variation in salmon fecundity in Dalälven and other rivers, especially between years.
Considering growth patterns at sea, my results show that salmon body size at the time of return to the river increased significantly with the formation rate of scale circuli (i.e. number of circuli), but not with inter-circuli distance. This result con-trasts to some previous studies on salmonids, which have shown that both the rate at which circuli are deposited and the inter-circuli distance are positively correlated with body growth rate (and thus with length at return to the river) (Pearson 1966; Fisher & Pearcy 1990, 2005). Yet, inter-circuli distance is, to my knowledge, the proxy most commonly used for assessing salmon growth rate through scale readings (e.g. Friedland & Haas, 1996; Friedland & Reddin, 2000; Beamish et al., 2004; Fisher & Pearcy, 2005; Hubley et al., 2008; Soto et al., 2018). Nevertheless, similar to the result of my study, Fisher and Pearcy (2005), when studying marine growth
rate in Coho salmon (Oncorhynchus kisutch), found that the circuli formation rate and inter-circuli distance were not correlated with each other. Also, studying Atlan-tic salmon body growth at sea, Peyronnet et al. (2007) found that the two growth estimates can suggest different patterns of growth. In fact, the authors concluded that estimates based on inter-circuli distance were more relevant during (and per-haps even restricted to) periods of poor growing conditions. These findings, as well as my own, indicate that the two growth rate-proxies: number of circuli and inter-circuli distance, are in fact independent estimates of growth rate. In addition, results from Fisher and Pearcy (1990) and Peyronnet et al. (2007) suggests that the rate at which circuli are formed or the inter-circuli distances could be related to several other factors besides growth rate, e.g. salmon age, size or environmental conditions. Thus, I find that when using scale readings for estimating salmon body growth at sea, it is important to use not only the inter-circuli distances as a proxy for growth rate but to also include the rate at which circuli are formed.
I found a positive relationship between growth rate during the first and second year at sea, i.e. the opposite of compensatory growth. As for fish in general, there are studies of salmonids, e.g. Atlantic salmon and Arctic charr (Salvelinus alpinus), that show that individuals usually experience accelerated body growth after periods of poor growth conditions (Johansen et al. 2001; Metcalfe & Monaghan 2001; Ali et al. 2003). Consequently, one would expect that an individual that grew poorly dur-ing its first year at sea would compensate for this by an increased growth rate durdur-ing the following year, but this was not the case in my study. Accordingly, salmon grow-ing poorly durgrow-ing their first year at sea are likely to be smaller at return to the river. This was confirmed by my results; at least when using the rate at which circuli are deposited as a proxy for growth, I found that individuals that formed less circuli during their first (and second) year at sea were smaller at the time of return to river Dalälven.
Due to its importance from an economic, cultural and ecological viewpoint, with considerable efforts and resources spent to increase the population sizes of salmon in the Baltic Sea, it is critical to understand the parameters and mechanisms influ-encing fecundity. Yet, there is an increasing amount of unexplained variation in the fecundity of Baltic salmon from river Dalälven. In this study, I show that even though female size and body condition are key factors explaining fecundity of the Baltic salmon from river Dalälven, the explanatory power of these factors has de-clined during the last 14 years. My results show that growth patterns at sea do not have any direct effects that can add to explain variation in female fecundity. Still, growth rate at sea has great indirect influence on fecundity since it decides the body length of the returning salmon. In the future, when studying the effects of variation
in growth rate at sea on the fecundity of Atlantic salmon in the Baltic Sea, it would be advisable to replicate this study while including a time series of individuals of varying age at return. In addition, one should not only consider differences between growth seasons but also variation in growth during specific periods within growth seasons. It would also be relevant to study if the different patterns of marine growth have any effect on variation in fecundity in terms of differences in egg size or egg number.
Besides studying factors that are causing variation in the body size of returning salmon, I suggest that putting more emphasis into reviewing the potentially cryptic effects of the environment experienced at sea, as e.g. the effect of stressors such as dioxin and fungal infections (ICES 2018) or of variation in food choices that can cause e.g. thiamine deficiency (Keinänen et al. 2018). I believe this will help resolve the question about what is causing variation in fecundity of equally sized Baltic salmon. Finally, it would also be useful to consider the effects of fluctuation in en-vironmental conditions in the river between years.
In this study, I have considered the previously poorly studied factor of marine growth patterns in an attempt of closing the knowledge gap to why there is variation in the fecundity of same-sized female Atlantic salmon in the Baltic Sea. I have also explored the method of using scale circuli as an estimate for growth rate, consider-ing that this gives a more detailed picture of the growth pattern at sea rather than just considering differences in growth rate in terms of total body growth between the time the salmon migrate out to sea and the time they return to the river. Due to limitations of my dataset: the absence of a time series or differences in the age at which the salmon return to the river, I still believe it is relevant to consider the effect of marine growth patterns in the aim of explaining why there is variation in the fecundity of Baltic salmon in river Dalälven. I also consider my way of studying growth patterns to be relevant, and I have shown that when using this method in the future, it is important to include both the rate at which circuli are formed as well as the inter-circuli distance, because they are independent indicators of growth rate at sea.
Ali, M., Nicieza, A. & Wootton, R.J. (2003). Compensatory growth in fishes: a response to growth depression. Fish and Fisheries, vol. 4 (2), pp. 147–190.
Alonso-Fernández, A., Vallejo, A.C., Saborido-Rey, F., Murua, H. & Trippel, E.A. (2009). Fecundity estimation of Atlantic cod (Gadus morhua) and haddock (Melanogram-mus aeglefinus) of Georges Bank: Application of the autodiametric method. Fish-eries Research, vol. 99 (1), pp. 47–54.
Angilletta, M.J., Niewiarowski, P.H. & Navas, C.A. (2002). The evolution of thermal physiology in ectotherms. Journal of Thermal Biology, vol. 27 (4), pp. 249–268. Barneche, D.R., Robertson, D.R., White, C.R. & Marshall, D.J. (2018). Fish
reproductive-energy output increases disproportionately with body size. Science, vol. 360 (6389), pp. 642–645.
Beamish, R.J., Mahnken, C. & Neville, C.M. (2004). Evidence that reduced early marine growth is associated with lower marine survival of Coho salmon. Transactions of the American Fisheries Society, vol. 133 (1), pp. 26–33.
Biro, P.A., Abrahams, M.V., Post, J.R. & Parkinson, E.A. (2004). Predators select against high growth rates and risk–taking behaviour in domestic trout populations. Pro-ceedings of the Royal Society of London. Series B: Biological Sciences, vol. 271 (1554), pp. 2233–2237.
Björnsson, B.T. (1997). The biology of salmon growth hormone: from daylight to domi-nance. Fish Physiology and Biochemistry, vol. 17, pp. 9–24
Brett, J.R. (1952). Temperature tolerance in young Pacific salmon, genus Oncorhynchus. Journal of the Fisheries Reasearch Board of Canada, vol. 9 (6), pp. 265–323. Burton, T., McKelvey, S., Stewart, D.C., Armstrong, J.D. & Metcalfe, N.B. (2013).
Off-spring investment in wild Atlantic salmon (Salmo salar): relationships with smolt age and spawning condition. Ecology of Freshwater Fish, vol. 22 (2), pp. 317– 321.
Casini, M., Rouyer, T., Bartolino, V., Larson, N. & Grygiel, W. (2014). Density-depend-ence in space and time: opposite synchronous variations in population distribution and body condition in the Baltic Sea sprat (Sprattus sprattus) over three decades. (Valentine, J. F., red.) PLoS ONE, vol. 9 (4), pp. e92278.
Chamberlin, J.W., Beckman, B.R., Greene, C.M., Rice, C.A. & Hall, J.E. (2017). How rel-ative size and abundance structures the relationship between size and individual growth in an ontogenetically piscivorous fish. Ecology and Evolution, vol. 7 (17), pp. 6981–6995.
Diana, J.S. (1979). The feeding pattern and daily ration of a top carnivore, the northern pike (Esox lucius). Canadian Journal of Zoology, vol. 57 (11), pp. 2121–2127.
Dickerson, B.R., Quinn, T.P. & Willson, M.F. (2002). Body size, arrival date, and repro-ductive success of pink salmon, Oncorhynchus gorbuscha. Ethology Ecology & Evolution, vol. 14 (1), pp. 29–44.
Dietrich, J.P. & Cunjak, R.A. (2007). Body and scale growth of wild Atlantic salmon smolts during seaward emigration. Environmental Biology of Fishes, vol. 80 (4), pp. 495–501.
Doyle, R.W., Talbot, A.J. & Nicholas, R.R. (1987). Statistical interrelation of length, growth, and scale circulus spacing: appraisal of a growth rate estimator for fish. Canadian Journal of Fisheries and Aquatic Sciences, vol. 44 (9), pp. 1520–1528. de Eyto, E., White, J., Boylan, P., Clarke, B., Cotter, D., Doherty, D., Gargan, P.,
Ken-nedy, R., McGinnity, P., O’Maoiléidigh, N. & O’Higgins, K. (2015). The fecun-dity of wild Irish Atlantic salmon Salmo salar L. and its application for stock as-sessment purposes. Fisheries Research, vol. 164, pp. 159–169.
Fisher, J.P. & Pearcy, W.G. (1990). Spacing of scale circuli versus growth rate in young Coho salmon. Fishery Bulletin, vol. 88 (4), pp. 637–643.
Fisher, J.P. & Pearcy, W.G. (2005). Seasonal changes in growth of coho salmon (On-corhynchus kisutch) off Oregon and Washington and concurrent changes in the spacing of scale circuli. Fishery Bulletin, vol. 103 (1), pp. 34–51.
Fjelldal, P.G., Nordgarden, U., Berg, A., Grotmol, S., Totland, G.K., Wargelius, A. & Hansen, T. (2005). Vertebrae of the trunk and tail display different growth rates in response to photoperiod in Atlantic salmon, Salmo salar L., post-smolts. Aquacul-ture, vol. 250 (1–2), pp. 516–524.
Fleming, I.A. (1996). Reproductive strategies of Atlantic salmon: ecology and evolution. Reviews in Fish Biology and Fisheries, vol. 6 (4), pp. 379–416
Fleming, I.A. & Reynolds, J.D. (2004). Salmonid breeding systems. Evolution Illuminated, Salmon and their Relatives. Oxford: Oxford University Press, ss. 264–294. Forseth, T., Letcher, B.H., Johansen, M. & Aarestrup, K. (2011). The behavioural
flexibil-ity of salmon growth. Atlantic Salmon Ecology. Blackwell Publishing Ltd., First Edition., pp. 145–169.
Friedland, K. (2000). Linkage between ocean climate, post-smolt growth, and survival of Atlantic salmon (Salmo salar L.) in the North Sea area. ICES Journal of Marine Science, vol. 57 (2), pp. 419–429.
Friedland, K.D. & Haas, R.E. (1996). Marine post-smolt growth and age at maturity of At-lantic salmon. Journal of Fish Biology, vol. 48 (1), pp. 1–15
Friedland, K.D. & Reddin, D.G. (2000). Growth patterns of Labrador Sea Atlantic salmon postsmolts and the temporal scale of recruitment synchrony for North American salmon stocks. Canadian Journal of Fisheries and Aquatic Sciences, vol. 57, pp. 1181–1189.
Frost, W.E. & Kipling, C. (1959). The determination of the age and growth of pike (Esox lucius l.) from scales and opercular bones. ICES Journal of Marine Science, vol. 24 (2), pp. 314–341.
Handeland, S.O., Berge, Å., Bjornsson, B.Th. & Stefansson, S.O. (1998). Effects of tem-perature and salinity on osmoregulation and growth of Atlantic salmon (Salmo salar L.) smolts in seawater. Aquaculture, vol. 168 (1–4), pp. 289–302.
Hansson, S., Karlsson, L., Ikonen, E., Christensen, O., Mitans, A., Uzars, D., Petersson, E. & Ragnarsson, B. (2001). Stomach analyses of Baltic salmon from 1959-1962 and 1994-1997: possible relations between diet and yolk-sac-fry mortality (M74). Journal of Fish Biology, vol. 58 (6), pp. 1730–1745.
Haraldstad, T., Haugen, T.O., Borgstrøm, R. & Jonsson, B. (2016). Increased precision of growth data gained by reading multiple scales from each individual of Atlantic salmon (Salmo salar). Fauna norvegica, vol. 36, pp. 1-7.
HELCOM (2011). Salmon and Sea Trout Populations and Rivers in the Baltic Sea – HEL-COM assessment of salmon (Salmo salar) and sea trout (Salmo trutta) popula-tions and habitats in rivers flowing to the Baltic Sea. Proceedings of Baltic Sea Environment Proceedings No. 126A, Helsinki, 2011. Helsinki: HELCOM HELCOM (2018). Abundance of salmon spawners and smolt. HELCOM core indicator
re-port. Access: http://www.helcom.fi/Core%20Indicators/Abun- dance%20of%20salmon%20spawners%20and%20smolt%20HEL-COM%20core%20indicator%202018.pdf [2019-03-22]
Hixon, M.A., Johnson, D.W. & Sogard, S.M. (2014). BOFFFFs: on the importance of con-serving old-growth age structure in fishery populations. ICES Journal of Marine Science, vol. 71 (8), pp. 2171–2185.
Hoar, W.S. (1988). The physiology of smolting salmonids. Fish Physiology. New York, NY: Academic Press, pp. 275–343.
Hosfeld, C.D., Engevik, A., Mollan, T., Lunde, T.M., Waagbø, R., Olsen, A.B., Breck, O., Stefansson, S. & Fivelstad, S. (2008). Long-term separate and combined effects of environmental hypercapnia and hyperoxia in Atlantic salmon (Salmo salar L.) smolts. Aquaculture, vol. 280 (1–4), pp. 146–153.
Hubley, P.B., Amiro, P.G. & Gibson, A.J.F. (2008). Changes in scale circulus spacings of an endangered Atlantic salmon Salmo salar population: evidence of a shift in ma-rine migration? Journal of Fish Biology, vol. 73 (10), pp. 2321–2340.
ICES (1998). Report of the second scale-reading workshop on Baltic salmon. (H:6). Helsinki Finland: ICES. Access: http://ices.dk/sites/pub/Publication%20Re-ports/Expert%20Group%20Report/bcc/1999/ssrwbs99.pdf [2019-02-07] ICES (2011). Report of the Workshop on Age Determination of Salmon (WKADS), 18‐20
January 2011, Galway, Ireland. (ACOM:44). Galway Ireland: ICES. Access: http://www.ices.dk/sites/pub/Publication%20Reports/Expert%20Group%20Re- port/acom/2012/WKADS2/Report%20of%20the%20Second%20Work-shop%20on%20Age%20Determination%20of%20Salmon.pdf [2019-02-27] ICES (2013). Report of the Second Workshop on Age Determination of Salmon
(WKADS2), 4th - 6th September 2012, Derry, Northern Ireland. (ACOM:61). Derry Northern Ireland: ICES. Access: http://ices.dk/sites/pub/Publication%20Re-
ports/Expert%20Group%20Report/acom/2012/WKADS2/Re- port%20of%20the%20Second%20Workshop%20on%20Age%20Determina-tion%20of%20Salmon.pdf [2019-02-07]
ICES (2018). Report of the Baltic Salmon and Trout Assessment Working Group (WGBAST), 20–28 March 2018, Turku, Finland. (ACOM:10). Turku Finland: ICES. Access:
http://www.ices.dk/sites/pub/Publication%20Reports/Ex- pert%20Group%20Report/acom/2018/WGBAST/01%20WGBAST%20_%20Re-
port%20of%20the%20Baltic%20Salmon%20and%20Trout%20Assess-ment%20Working%20Group.pdf [2019-03-11]
Ikonen, E. & Riista- ja kalatalouden tutkimuslaitos (Finland) (2006). The role of the feed-ing migration and diet of Atlantic salmon (Salmo salar L.) in yolk-sack-fry mor-tality (M74) in the Baltic Sea. Finnish Game and Fisheries Research Institute. Jacobson, P., Gårdmark, A. & Huss, M. (2019). Population- and size-specific distribution
of Atlantic salmon in the Baltic Sea with implications for management. Under re-view, Fish and Fisheries.
Jacobson, P., Gårdmark, A., Östergren, J., Casini, M. & Huss, M. (2018). Size-dependent prey availability affects diet and performance of predatory fish at sea: a case study of Atlantic salmon. Ecosphere, vol. 9 (1), pp. e02081.
Johansen, S.J.S., Ekli, M., Stangnes, B. & Jobling, M. (2001). Weight gain and lipid depo-sition in Atlantic salmon, Salmo salar, during compensatory growth: evidence for lipostatic regulation? Aquaculture Research, vol. 32 (12), pp. 963–974.
Jonsson, B. & Jonsson, N. (2004). Factors affecting marine production of Atlantic salmon (Salmo salar). Canadian Journal of Fisheries and Aquatic Sciences, vol. 61 (12), pp. 2369–2383.
Jonsson, B. & Jonsson, N. (2009). A review of the likely effects of climate change on anadromous Atlantic salmon Salmo salar and brown trout Salmo trutta, with par-ticular reference to water temperature and flow. Journal of Fish Biology, vol. 75 (10), pp. 2381–2447.
Jonsson, B., L’Abée-Lund, J.H., Heggberget, A.J., Jensen, A.J., Johnsen, B.O., Næsje, T.F. & Sættem, L.M. (1991a). Longevity, body size, and growth in anadromous brown trout (Salmo trutta). Canadian Journal of Fisheries and Aquatic Sciences, vol. 48 (10), pp. 1838–1845.
Jonsson, N., Jonsson, B. & Fleming, I.A. (1996). Does Early Growth Cause a Phenotypi-cally Plastic Response in Egg Production of Atlantic Salmon? Functional Ecol-ogy, vol. 10 (1), pp. 89–96.
Jonsson, N., Jonsson, B. & Hansen, L.P. (1991b). Energetic cost of spawning in male and female Atlantic salmon (Salmo salar L.). Journal of Fish Biology, vol. 39 (5), pp. 739–744.
Jonsson, N., Jonsson, B. & Hansen, L.P. (1997). Changes in proximate composition and estimates of energetic costs during upstream migration and spawning in Atlantic salmon Salmo salar. Journal of Animal Ecology, vol. 66, pp. 425–436.
Kallio-Nyberg, I. & Ikonen, E. (1992). Migration pattern of two salmon stocks in the Bal-tic Sea. ICES Journal of Marine Science, vol. 49 (2), ss. 191–198
Karlsson, L. & Karlström, Ö. (1994). The Baltic salmon (Salmo salar L.): its history, pre-sent situation and future. Dana, vol. 10, pp. 61–85.
Keeley, E.R. & Grant, J.W.A. (2001). Prey size of salmonid fishes in streams, lakes, and oceans. Canadian Journal of Fisheries and Aquatic Sciences, vol. 58 (6), pp. 1122–1132.
Keinänen, M., Käkelä, R., Ritvanen, T., Myllylä, T., Pönni, J. & Vuorinen, P.J. (2017). Fatty acid composition of sprat (Sprattus sprattus) and herring (Clupea harengus) in the Baltic Sea as potential prey for salmon (Salmo salar). Helgoland Marine Research, vol. 71 (1). DOI: https://doi.org/10.1186/s10152-017-0484-0
Keinänen, M., Käkelä, R., Ritvanen, T., Pönni, J., Harjunpää, H., Myllylä, T. & Vuorinen, P.J. (2018). Fatty acid signatures connect thiamine deficiency with the diet of the Atlantic salmon (Salmo salar) feeding in the Baltic Sea. Marine Biology, vol. 165 (10). DOI: https://doi.org/10.1007/s00227-018-3418-8
Keinänen, M., Uddström, A., Mikkonen, J., Casini, M., Pönni, J., Myllylä, T., Aro, E. & Vuorinen, P.J. (2012). The thiamine deficiency syndrome M74, a reproductive disorder of Atlantic salmon (Salmo salar) feeding in the Baltic Sea, is related to the fat and thiamine content of prey fish. ICES Journal of Marine Science, vol. 6 (4), pp. 516–528.
King, H.R., Pankhurst, N.W., Watts, M. & Pankhurst, P.M. (2003). Effect of elevated sum-mer temperatures on gonadal steroid production, vitellogenesis and egg quality in female Atlantic salmon. Journal of Fish Biology, vol. 63 (1), pp. 153–167. Klemetsen, A., Amundsen, P.-A., Dempson, J.B., Jonsson, B., Jonsson, N., O’Connell,
M.F. & Mortensen, E. (2003). Atlantic salmon Salmo salar L., brown trout Salmo trutta L. and Arctic charr Salvelinus alpinus (L.): a review of aspects of their life histories. Ecology of Freshwater Fish, vol. 12 (1), pp. 1–59.
Le Cren, E.D. (1947). The determination of the age and growth of the perch (Perca fluviat-ilis) from the opercular bone. The Journal of Animal Ecology, vol. 16 (2), pp. 188–204.
Levings, C.D. (1994). Feeding behaviour of juvenile salmon and significance of habitat during estuary and early sea phase. Nordic Journal of Freshwater Research, vol. 69, pp. 7–16.
Marco-Ruis, F., Caballero, P., Moran, P. & Garcia de Leaniz, C. (2013). Mixed-effects modelling of scale growth profiles predicts the occurrence of early and late fish migrants. PLoS ONE, vol. 8 (4), pp. e61744.
Marteinsdottir, G. & Begg, G. (2002). Essential relationships incorporating the influence of age, size and condition on variables required for estimation of reproductive po-tential in Atlantic cod Gadus morhua. Marine Ecology Progress Series, vol. 235, pp. 235–256.
McDowall, R.M. (1997). The evolution of diadromy in fishes (revisited) and its place in phylogenetic analysis. Reviews in Fish Biology and Fisheries, vol. 7 (4), pp. 443– 462.
Metcalfe, N.B. & Monaghan, P. (2001). Compensation for a bad start: grow now, pay later? Trends in Ecology & Evolution, vol. 16 (5), pp. 254–260.
Mitans, A.R. (1970). The feeding of Baltic salmon smolts in the river and in the sea. Jour-nal of Ichtyology, vol. 10, pp. 89–95.
Moffett, I.J.J., Allen, M., Flanagan, C., Crozier, W.W. & Kennedy, G.J.A. (2006). Fecun-dity, egg size and early hatchery survival for wild Atlantic salmon, from the River Bush. Fisheries Management and Ecology, vol. 13 (2), pp. 73–79.
Pankhurst, N.W., Purser, G.J., Van Der Kraak, G., Thomas, P.M. & Forteath, G.N.R. (1996). Effect of holding temperature on ovulation, egg fertility, plasma levels of reproductive hormones and in vitro ovarian steroidogenesis in the rainbow trout Oncorhynchus mykiss. Aquaculture, vol. 146 (3–4), pp. 277–290.
Pearson, R.E. (1966). Number of circuli and time of annulus formation on scales of pink salmon (Oncorhynchus gorbuscha). Journal of the Fisheries Reasearch Board of Canada, vol. 23 (5), pp. 747–756.
Petersson, E., Jaurvi, T., Steffner, N.G. & Ragnarsson, B. (1996). The effect of domestica-tion on some life history traits of sea trout and Atlantic salmon. Journal of Fish Biology, vol. 48 (4), pp. 776–791.
Peyronnet, A., Friedland, K.D., Maoileidigh, N.Ó., Manning, M. & Poole, W.R. (2007). Links between patterns of marine growth and survival of Atlantic salmon Salmo salar, L. Journal of Fish Biology, vol. 71 (3), pp. 684–700.
Pyper, B.J. & Peterman, R.M. (1999). Relationship among adult body length, abundance, and ocean temperature for British Columbia and Alaska sockeye salmon (On-corhynchus nerka), 1967–1997. Canadian Journal of Fisheries and Aquatic Sci-ences, vol. 56 (10), pp. 1716–1720.
Quinn, T.P., Seamons, T.R., Vøllestad, L.A. & Duffy, E. (2011). Effects of growth and re-productive history on the egg size–fecundity tradeoff in steelhead. Transactions of the American Fisheries Society, vol. 140 (1), pp. 45–51.
Quinn, T.P., Vøllestad, L.A., Peterson, J. & Gallucci, V. (2004). Influences of freshwater and marine growth on the egg size–egg number tradeoff in Coho and Chinook Salmon. Transactions of the American Fisheries Society, vol. 133 (1), pp. 55–65. R Core Team (2018). R: A language and environment for statistical computing. Vienna. Reid, J.E. & Chaput, G. (2012). Spawning history influence on fecundity, egg size, and
egg survival of Atlantic salmon (Salmo salar) from the Miramichi River, New Brunswick, Canada. ICES Journal of Marine Science, vol. 69 (9), pp. 1678–1685. Ricker, W.E. (1975). Computation and interpretation of biological statistics of fish
popula-tions. Bulletin of the Fisheries Research Board of Canada, vol. 191, pp. 1–382. Rikardsen, A.H. & Dempson, B.J. (2011). Dietary life-support: the food and feeding of
At-lantic salmon at sea. AtAt-lantic Salmon Ecology. Blackwell Publishing Ltd., First Edition., pp. 115–143.
Rueden, C.T., Schindelin, J., Hiner, M.C., DeZonia, B.E., Walter, A.E., Arena, E.T. & Eliceiri, K.W. (2017). ImageJ2. BMC Bioinformatics, vol. 18 (529)
Salminen, M., Erkamo, E. & Salmi, J. (2001). Diet of post-smolt and one-sea-winter At-lantic salmon in the Bothnian Sea, Northern Baltic. Journal of Fish Biology, vol. 58 (1), pp. 16–35.
Salsea-Merge (2008). Workshop on Scale Reading Methodology. (2008). Trondheim Nor-way. Access:
http://www.nasco.int/sas/pdf/salsea_docu-ments/WP%204%20Workshop%20Report.pdf
Shearer, W.M. (1992). Atlantic salmon scale reading guidelines. (188). Copenhagen, Den-mark: ICES.
Siira, A., Erkinaro, J., Jounela, P. & Suuronen, P. (2009). Run timing and migration routes of returning Atlantic salmon in the Northern Baltic Sea: implications for fisheries management. Fisheries Management and Ecology, vol. 16 (3), pp. 177–190. Soto, D., Trueman, C., Samways, K., Dadswell, M. & Cunjak, R. (2018). Ocean warming
cannot explain synchronous declines in North American Atlantic salmon popula-tions. Marine Ecology Progress Series, vol. 601, pp. 203–213.
Stabell, O.B. (1984). Homing and olfaction in Salmonids: a critical review with special ref-erence to the Atlantic salmon. Biological Reviews, vol. 59 (3), pp. 333–388. Steinmetz, B. & Müller, R. (1991). An atlas of fish scales and other bony structures used
for age determination: non-salmonid species found in European fresh waters. Tresaith: Samara Publishing Ltd.
Sturlaugsson, L. (1994). Food of ranched Atlantic salmon (Salmo salar L.) postsmolts in coastal waters, West Iceland. Nordic Journal of Freshwater Research, vol. 69, pp. 43–57.
Thorpe, J.E., Miles, M.S. & Keay, D.S. (1984). Developmental rate, fecundity and egg size in Atlantic salmon, Salmo salar L. Aquaculture, vol. 43 (1–3), pp. 289–305. Thorstad, E.B., Whoriskey, F., Rikardsen, A.H. & Aarestrup, K. (2011). Aquatic nomads:
the life and migrations of the Atlantic salmon. Atlantic Salmon Ecology. Black-well Publishing Ltd., First Edition, pp. 1–32.
Tsukamoto, K. & Kajihara, T. (1987). Age determination of ayu with otolith. Nippon Suisan Gakkai, vol. 53 (11), pp. 1985–1997.
Vischer, N. & Nastase, S. (2009). Non-destructive marking and linked results - Object J - A plugin for ImageJ. ObjectJ. Access: https://sils.fnwi.uva.nl/bcb/objectj/in-dex.html [2018-12-10]
Vladić, T. & Petersson, E. (2015). Relationship between size, age and maturity in Atlantic salmon. I: Vladić, T. & Petersson, E. (red.) Evolutionary Biology of the Atlantic Salmon. CRC Press, pp. 165–181.
Vuorinen, P.J., Kiviranta, H., Koistinen, J., Pöyhönen, O., Ikonen, E. & Keinänen, M. (2014). Organohalogen concentrations and feeding status in Atlantic salmon (Salmo salar L.) of the Baltic Sea during the spawning run. Organohalogen con-centrations and feeding status in Atlantic salmon (Salmo salar L.) of the Baltic Sea during the spawning run, vol. 468–469, pp. 449–456.
Whitlock, R., Mäntyniemi, S., Palm, S., Koljonen, M.-L., Dannewitz, J. & Östergren, J. (2018). Integrating genetic analysis of mixed populations with a spatially explicit population dynamics model. (Travis, J., red.) Methods in Ecology and Evolution, vol. 9 (4), pp. 1017–1035.
Wootton, R.J. (1998). Ecology of Teleost Fishes. 2nd ed. Dordrecht, The Netherlands: Kluwer Academic Publishers.
I would very much like to thank my supervisors Magnus Huss and Philip Jacobson for their guidance, encouragement and patience throughout the process of writing this thesis. I have learned a great deal from you and I have had a lot of fun doing it. Also, I would like to acknowledge Björn Ardestam, Malin Hällbom and Magnus Kokkin at the Institute of Freshwater Research in Drottningholm for their help: ex-plaining the processes, answering questions and overseeing my work during the preparation of salmon scales. Also, I am so thankful for getting the opportunity to experience the salmon breeding at the Fisheries Research Station in Älvkarleby – thank you Yvonne Ottosson, Jörgen Rask and Peter Åkerström, and for being in-vited to join the joyful co-worker community at the Institute of Freshwater Research in Öregrund. Thank you mom and dad for constantly cheering me on and finally, to my dearest Joel, for always supporting me.
Figures describing the relationship between body length and growth in 2SW Atlan-tic salmon females at return to river Dalälven in 2018, during the first (0+) and sec-ond (1+) year at sea (Table 3). Solid lines represent significant relationships. The models are:
Length ~ Mean inter-circuli distance 0+ (top left) Length ~ Mean inter-circuli distance 1+ (top right) Length ~ Mean number of circuli 0+ (bottom left) Length ~ Mean number of circuli 1+ (bottom right)
Figures describing the relationship between body condition (Fulton’s K) and growth in 2SW Atlantic salmon females at return to river Dalälven in 2018, during the first (0+) and second (1+) year at sea (Table 4). The models are:
Condition ~ Mean inter-circuli distance 0+ (top left) Condition ~ Mean inter-circuli distance 1+ (top right) Condition ~ Mean number of circuli 0+ (bottom left) Condition ~ Mean number of circuli 1+ (bottom right)