Swedish University of Agricultural Sciences, Department of Forest Ecology and Management Independent project in forest science • 60 credits
Master of Science in Forestry
Examensarbeten /SLU, Institutionen för skogens ekologi och skötsel • ISSN 1654-1898 Umeå 2019
Total carbon sequestration during an entire
rotation period of oil palm in northern Borneo
Fullständig kolbindning under en hel rotation av oljepalm på
norra Borneo
Josefin Runesson
___________________________________________________________
Examensarbeten
2019:10
Fakulteten för skogsvetenskap
Total carbon sequestration during an entire rotation of oil palm
in northern Borneo
Fullständig kolbindning under en hel rotation av oljepalm på norra Borneo
Josefin Runesson
Supervisor: Niles Hasselquist, Swedish University of Agricultural Sciences, Department of Forest Ecology and Management
Assistant supervisor: Ulrik Ilstedt, Swedish University of Agricultural Sciences, Department of
Forest Ecology and Management
Examiner: Gert Nyberg, Swedish University of Agricultural Sciences, Department of Forest Ecology and Management
Credits: 60 credits
Level: Advanced level A2E
Course title: Independent project in forest science at the Department of Forest Ecology and Management
Course code: EX0913
Course coordinating Department of Forest Ecology and Management department:
Programme /education: Master of Science in Forestry Place of publication: Umeå
Year of publication: 2019
Cover picture: Josefin Runesson
Title of series: Examensarbeten / SLU, Institutionen för skogens ekologi och skötsel
Part number: 2019:9
ISSN: 1654-1898
Online publication: https://stud.epsilon.slu.se
Keywords: Oil palm, carbon balance, carbon sequestration, land use change, soil carbon, carbon credits
Swedish University of Agricultural Sciences
Faculty of Forest Sciences
I denna rapport redovisas ett examensarbete utfört vid Institutionen för skogens ekologi och skötsel, Skogsvetenskapliga fakulteten, SLU. Arbetet har handletts och granskats av handledaren, och godkänts av examinator. För rapportens slutliga innehåll är dock författaren ensam ansvarig.
This report presents an MSc/BSc thesis at the Department of Forest Ecology and Management, Faculty of Forest Sciences, SLU. The work has been supervised and reviewed by the supervisor, and been approved by the examiner. However, the author is the sole responsible for the content.
3
Acknowledgement
I would like to send some thanks to the people who helped me while working on this study.
Thanks to Sabah Softwood Berhad for providing access to their oil palm plantations as well as giving us access knowledgeable planation managers.
Thanks to David Alloysius, rangers and research assistants from Luasong, for their invaluable assistance regarding the collection of the data.
Thanks to Minor Field Studies scholarship (MFS) which made it possible for me to travel to Borneo for my field studies.
Thanks to my supervisor and everyone else at Swedish university of agricultural sciences who offered guidance during this process.
4
Table of context
Introduction ... 1
Material and method ... 3
Study area ... 3
Measurements of carbon pools ... 4
Soil and fine root carbon ... 5
Aboveground palm trees ... 6
Fawns ... 7
Coarse woody debris ... 8
Fine litter ... 8
Economic value of oil palm ... 8
Statistical analyses ... 9
Results ... 10
Soil properties... 10
Total carbon sequestration ... 11
Oil palm ... 13
Soil ... 14
Roots ... 15
CWD & Stumps... 15
Senesced fawns and fine litter ... 15
Carbon pricing ... 16 Discussion ... 18 Conclusion ... 19 References ... 20 Appendix 1 ... 23 Appendix 2 ... 24 Appendix 3 ... 25 Appendix 4 ... 27
5
Abbreviations
AGB = Above ground biomass BGB = Below ground biomass C = Carbon
CWD = Coarse woody debris FFB = Fresh fruit bunches SSB = Sabah Softwood Berhad
6 Figure index
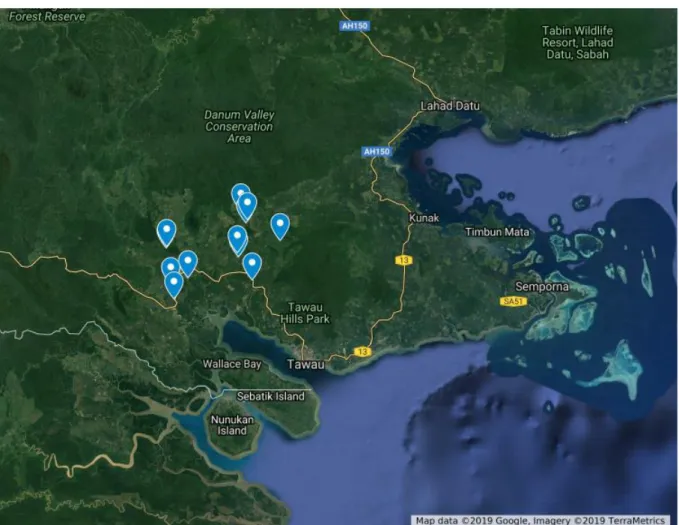
Figure 1. Location of the 12 sampling plots in Sabah, Borneo ... 3
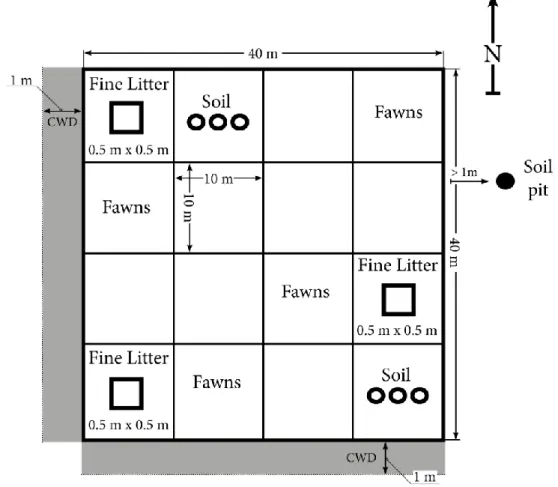
Figure 2 Layout of the 40 x 40 m sampling plot ... 4
Figure 3 Schematic showing the depth intervals for soil sampling ... 6
Figure 4 Difference in total carbon and phosphorus among different soil depths ... 10
Figure 5 Regression of time since planting and total carbon ... 11
Figure 6 Regression of time since planting and aboveground oil palm carbon ... 13
Figure 7 Distribution of carbon among above- and belowground pools ... 14
Figure 8 Regression of soil carbon among different depths ... 14
Figure 9 Regression of fine root carbon among different depth ... 15
Figure 10 Production of fresh fruit bunches within different aged oil palm plantations ... 17
Table index Table 1 Test statistics of two-way ANOVA between plot and soil depth on soil edaphic properties…10 Table 2 Mean (± SE) carbon in above- and belowground carbon pools among the 12 plots…………. 12
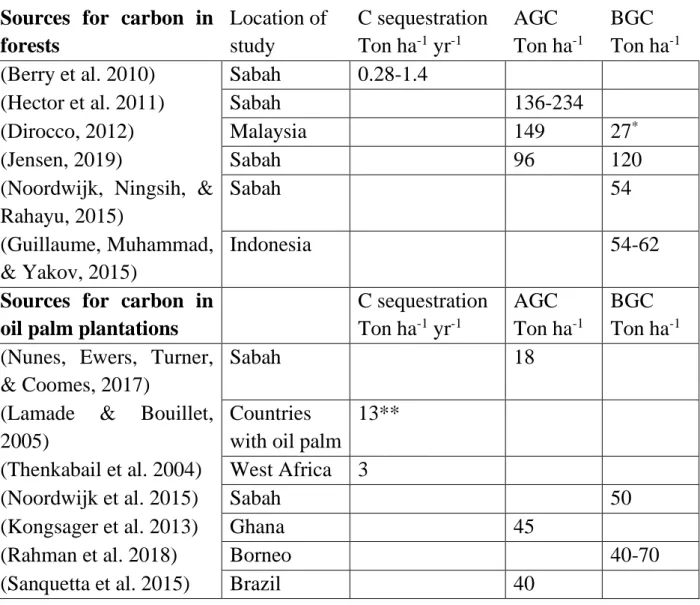
Table 3 Comparison of above- and belwoground carbon pools among different tropical forests and oil palm plantations in the tropics……… 15
7
Abstract
Considerable amounts of carbon (C) has been lost from tropical forests as a result of continuous conversion of tropical forests into oil palm plantations. Therefore, a better understanding of the C budget and potential sequestration rate in oil palm plantations and how it compares to natural forests is needed. Which is crucial in order to provide a more reasonable C credit payment to limit the widespread land conversion of tropical forests to oil palm plantations. In this thesis, I quantified the amount of C in both above- and belowground pools, which included: aboveground oil palms, stumps, senesced fawns, fine litter, coarse woody debris, roots and soil over an entire rotation period of oil palm. I established 12 plots of similar conditions within a chrono sequence of oil palm, spanning from recently planted plantations <1 year old to a 22 year old plantation. Using this approach, I was able to calculate the carbon sequestration rate during an entire rotation period of oil palm as well as assess changes in different carbon pools. I estimated that 160-ton C ha-1 is lost when converting a secondary forest in Sabah Borneo
to oil palm plantations. However, I found that rate of C sequestration (ton C ha-1 yr-1) in oil palm is
considerably higher than C sequestration in primary and secondary tropical forests. Aboveground oil palm and soil C are the two major C pools in oil palm plantation, yet it is changes in aboveground oil palm during the rotation period that is responsible for the high C sequestration rate. I also estimated an economic profit of 37,333 USD during a rotation period based on data from the production of fresh fruit bodies. Comparing the profit to the difference in C sequestration between natural forests and oil palm plantation I calculated a C credit payment of 54-96 USD ton-1 CO
2 that would be need to conserve carbon
in tropical forests while at the same time provide the same economic revenue as oil palm production , which is considerably higher than the current price for C. Thus, if we want to limit the conversion of tropical forest to oil palm plantations the current C credit payment is not enough and addition payments for other ecosystem services (i..,e biodiversity and water quality) are needed.
8
Abstrakt
En betydande mängd kol har försvunnit från tropiska skogar som ett resultat av kontinuerlig konvertering av tropiska skogar till oljepalmsplantage. På grund av detta behövs en bättre förståelse för kollager och potentiell kolbindning i oljepalmsplantage samt hur det skiljer sig från naturlig skog. Vilket är väsentlig för att skapa ett mer resonabelt pris på kolkrediter för att begränsa konverteringen av skog till oljepalmsplantage. I denna uppsatts har jag kvantifierat mängden kollager i både ovan och under mark, vilket inkluderade oljepalmer, stubbar, avskurna oljepalmslöv, förna, död ved, rötter och jord under en hel rotation av första generations oljepalm. Jag etablerade 12 ytor med likande förhållanden med en krono sekvens av oljepalm, från nyligen planterat <1 år till 22år gammal plantage. Med hjälp av detta kunde jag räkna ut kolbindningen under en hel rotation av oljepalm samt uppskatta förändringar i de olika kollagren. Jag uppskattar att 160-ton kol ha-1 försvinner när en sekundär skog i Sabah Borneo
konverteras till oljepalmsplantage. Dock så fann jag att kolbindningen i oljepalmsplantage är betydligt högre än i primär och sekundär skog. Kol i oljepalmerna och jorden är de två största kollagren i oljepalmsplantage, men det är förändringar i oljepalmerna som driver kolbindningen. Jag uppskattar en ekonomisk vinst på 37,333 USD under en rotationsperiod baserat på fruktproduktionen. Genom att jämföra vinsten emot skillnaden i kolbindning och lager för sekundär samt primär skog så uppskattar jag att priset på kolkrediter ska vara 54-96 USD ton-1 CO2 för att bevara kollagren i tropisk skog men ge
samma ekonomiska vinst som oljepalmsplantage, vilket är betydligt högre än det nuvarande priset. Således om vi vill begränsa konverteringen av tropiska skogar till oljepalmsplantage så räcker inte det med de nuvarande kolkrediterna, utan ytterligare betalning för andra ekosystemstjänster (ex. biodiversitet och vattenkvalitet) behövs.
1
Introduction
Oil palm is one of the world’s most rapidly increasing crops (Naylor 2016) with ca. 0.3 million hectares of tropical forests being converted into oil palm plantations each year (Henders, Persson, & Kastner, 2015). Oil palm, Elaeis guineensis, is grown on over 20 million hectares of land (FAO, 2018) and most oil palm plantations are currently found on what used to be lowland tropical rainforests in Malaysia and Indonesia; one of the most biologically diverse terrestrial ecosystems on Earth (Corley & Tinker, 2008; Corvalan, Hales, & McMichael, 2005). In Malaysia, 2.4 million hectare were converted into oil palm plantations between 1900 and 2005 (Malaysian palm oil board, 2018a) resulting in the loss of at least one million hectares of tropical forest (Koh & Wilcove, 2008). Despite this rapid growth of oil palm plantations there is still ca. 250 million hectares of land suitable for conversion into oil palm at a global scale (Pirker, Mosnier, Kraxner, Havlík, & Obersteiner, 2016) and it is projected that oil palm plantations will continue to expand as long there is a global demand for oil palm products (Carter, Finley, Fry, Jackson, & Willis, 2007). Such widespread conversion of tropical forests into large scale oil palm plantation stresses the need for a better understanding of the consequences this land use change has on ecosystem services.
Most research on oil palm to date has primarily focused on food and related health, whereas only a small amount of research (< 2% since 1970) has focused on environmental issues (Turner, Snaddon, Fayle, & Foster, 2008). Oil palms are very homogeneous in age and structure and often lack a diverse understory plant community, which in turn might help explain why oil palm plantations support less biodiversity than natural forests and other tree plantations (Fitzherbert et al. 2008). Additionally, it is estimated that land use change is responsible for 12-20% of the human induced C dioxide (CO2) emissions to the
atmosphere, where the tropical region is the most prominent (Randerson, 2009). Thus, converting tropical forests into oil palm plantations could have large, negative effects on biodiversity and other ecosystems services.
One important ecosystem service is C sequestration, yet only a few studies have assessed the C budget in oil palm plantations. Previous studies have shown that C sequestration in oil palm plantations can range from 3 to 13 ton of C per year (Kongsager, Napier, & Mertz, 2013; Lamade & Bouillet, 2005; Thenkabail et al. 2004). However, majority of these studies have only quantified aboveground C, while ignoring other C pools in the C budget, namely belowground C. Moreover, previous studies have often been done in mature oil palm plantations where C sequestration is determined by simply dividing the amount of aboveground C by the age of the plantation. Although this approach provides rough estimates of C sequestration, it provides little information about changes in different C pools, especially belowground C pools, during an entire rotation period of oil palm, which in turn limits our mechanistic understanding of total C sequestration in oil palm plantations.
Oil palm is an extremely high yielding cop, producing roughly nine times more vegetable oils per area than other competing crops (Meijaard, 2018). The harvesting of fresh fruit bunches (FFB) begins during the second year after planting and is done continuously until the plantation is harvested at roughly 25 years (Sheil et al. 2009). In addition to the production of palm oil, timber cut for the conversion to oil palm plantations is usually sold thereby providing another source of economic revenue (Wahid & Simeh, 2009). The early income from timber sales, high yields and continuous harvesting makes oil palm very profitable, ranging from 3,835–9,630 USD ha-1 year-1in net present value (Butler, Koh, & Ghazoul,
2009). Thus, for countries with rural poverty, oil palm plantations are frequently viewed as a possible way for economic development (Ayodele, 2010; Gatto, Wollni, Asnawi, & Qaim, 2017). Payment of C
2 credits (i.e., through REDD+) for conservation has also been proposed as a way to provide economic revenue in many developing countries while at the same time mitigate forest degradation and deforestation (Kindermann et al. 2008; Stern, 2007). Kindermann et al. (2008) estimated that global deforestation could be reduced by 50% at a price of 10-21 USD per metric ton of CO2. However, several
studies from Southeast Asia have shown that C payments fail in comparison to the lucrative palm-oil market (Butler et al. 2009; Fisher, Edwards, Giam, & Wilcove, 2011; Persson & Azar, 2010; Venter et al. 2009). Thus, there is a need to re-assess the cost for a metric ton of CO2 in order to ensure that C
credit payments provide a similar economic return as oil palm.
In this study, I measured ecosystem C pools along a chrono sequence of oil palm plantations in southern Sabah, Malaysia which provides a unique opportunity to quantify C sequestration during an entire oil palm rotation period. Moreover, given that I made measurements of individual C pools, I was also able to investigate changes in above- and belowground C pools to get a more mechanistic understanding of C sequestration in oil palm plantations. Specifically, this study seeks to 1) quantify total C sequestration (ton C yr-1) during an entire oil palm rotation period and 2) assess the relative importance of above-and
belowground C pools and how these C pools change during a rotation period. I also determine the economic revenue for an entire rotation period of oil palm, and by combining this information with information about the difference in C sequestration between natural tropical forests and oil palm plantations I was able to calculate a more realistic C credit payment that is needed to stop the conversion of tropical forests into oil palm plantations.
3
Material and method
Study area
This study was conducted in Sabah, Malaysia Borneo where oil palm is planted on 1.5 million hectares, which corresponds to 90% of the available agricultural land in Sabah (Potter, 2015). In this area, average monthly temperature and precipitation (based on data collected between 1982-2012) ranges from 22-31°C and 80-350 mm respectively (Climate-Data, 2018). The study area is dominated by oil palm plantations and a smaller extent by different tree plantations. The soil is mainly mineral soil and ranges from low to medium fertility and are mainly categorized as Kumansi or Kapilit soils (for more details, see appendix 3).
I selected 12 plots (40 x 40) within a chrono sequence of oil palm plantations owned by Sabah Softwood Berhad (SBB), which owns and operates 2500 hectares of oil palm plantations in the area around Luasong, Sabah, Borneo (Figure 1). Sabah Softwood Berhad has oil palm plantations ranging from first generation up to third generation, with a rotation period of ca. 22 years. Plots were selected to represent an entire rotation period first generation, ranging from plot that was recently established (3 weeks since planting) to a 22 year old plantation. The following criteria was also used when selecting plots: (1) they were first generation of oil palm (i.e., prior to conversion to oil palm these plantations were forests), (2) the plots were placed on similar soil properties, slope and aspect, (3) located > 100 m from main roads, and (4) represented different ages since planting In total, 12 plots were selected ranging in ages from ones converted in 1996 to a recently planted plantation in the summer of 2018.
4
Measurements of carbon pools
Plots were delineated using a laser rangefinder (Nikon Forestry Pro Laser Rangefinder) and the center and corners were marked with GPS (inreach explorer+) points for possible future reference. Each 40 x 40 m plot was subdivided into 16 smaller (10 x 10 m) sub-plots for above-and belowground measurements (Figure 2). Aboveground biomass and stumps were measured in the entire 40 x 40 m plots, whereas root biomass and soil C were measured in two of the 10 x 10 m sub-plots as well as one location adjacent to the 40*40 m plot. Fine litter was collected within three of the sub-plots and oil palm fawns were measured in four subplots. Coarse woody debris (CWD) was measured along two 1 x 40 m transects located along the outside edge of each plot. Measurements of above-and belowground C pools were made in all 12 plots between September-October 2019.
Figure 2. Schematics over one of the 12 40 x 40 m plots sampled across the study system, describing the default layout for the sampling in 10*10-meter grids where fine litter is collected in the center of three sub-plots in a 0.5*0.5m quadrats, soil is collected in the center of two sub-plots as well as one site adjacent to the 40*40m plot. Senesced oil palm leaves were measured in four sub-plots. Coarse woody debris was collected in two 1 m wide and 40 m long transects (shaded area) that originated from the south west corner in each plot. A soil pit was also dug to a depth of 1 m minimum 1 m away from the sample plot where deeper soil samples were collected. Aboveground oil palms and stumps were measured in the entire 40 x 40 m plot.
5
Soil and fine root carbon
Inside the 40 x 40 m plot, two sub-plots were designated for soil samples, where three 0-10 cm and three 10-20 cm samples was collected in each sub-plot. Then in one location adjacent to the plot soil samples was also collected, three 0-10 cm and three 10-20 samples, in addition samples were collected at 25, 35, 45, 65, 75 and 95 cm depth. So, the samples taken outside the plot were taken down to 100 cm depth and was placed outside the plot to not disturb the soil inside the plot in case of future sampling in the same spot. Samples taken inside the plot was taken to only 0-20 cm depth. Soil samples were collected using a metal cylinder hammered vertically into the soil (7.2 cm diameter and 10 cm long). Shallow soil samples were collected at two intervals (0-10 and 10-20 cm depth) at all three locations (two inside the 40*40m and one adjacent to the sample plot) with three replications per location, giving us a total of 9 samples for each of the two surface soil intervals (0-10 and 10-20 cm depth). For deeper soil samples, samples were collected in a soil pit (1 m deep) that was dug adjacent to the 40 x 40 m plot. Deeper soil samples were collected by hammering a shorter (7.2 cm diameter and 5 cm long) metal cylinder horizontally into the soil at: 25, 35, 45, 65, 75 and 95 cm depth and then aggregated into 20-50 cm (25, 35 & 45 cm samples) and 50-100 cm (65, 75 & 95 cm samples) intervals (Figure 3).
All stones and roots were removed from each soil sample. A sub-sample was then taken and dried to a constant weight (85°C) to determine bulk density as follows:
𝐵𝐷 ( 𝑔 𝑐𝑚3) =
(𝑆𝑢𝑏𝑊𝑆𝑢𝑏𝑊𝑑𝑟𝑦
𝑓𝑟𝑒𝑠ℎ∗ 𝐹𝑟𝑒𝑠ℎ𝑆𝑎𝑚𝑝𝑙𝑒𝑊)
𝑉𝑜𝑙𝑢𝑚𝑒
Where BD is bulk density, SubWdry is the sub-sample dry weight, SubWfresh is sub-sample fresh weight, FreshSampleW is the total fresh weight of the sample and Volume is the volume of the metal cylinder use. Bulk density was determined on three samples collected at 0-10 cm and 10-20 cm as well as on all the deeper soil samples.
The remaining surface soil samples (n = 6) were used to make a composite sample for chemical analyses together (n = 9 for both the 0-10 cm and 10-20 cm depth interval). A composite sample for chemical analyses was also made for the deeper depths by combining samples collected at 25, 35, 45 cm for the 20-50 cm depth interval and samples collected at 65, 75, and 95 cm for the 50-100 cm depth interval. Composite samples were homogenized for each depth interval and then a sub-sample was taken for analyses at the Sepilok Forest Research Centre. Total C was determined by by dry combustion at 900°C using an Elementar Vario Max CN analyzer (Elementar Analysensysteme, Hanau, Germany). Soil texture was determined following the particle size distribution test by (Day, 1965). Soil pH was measured with a combination glass-calomel electrode in a 1:2.5 ratio of soil to pure (deionized) water. Nitrogen (N), phosphorus (P), aluminim (Al), and acidity were also determined for each sub-sample sent to the Sepilok Forest Research Centre.
Soil carbon was then calculated for each soil depth interval (0-10 cm, 10-20cm, 20-50 cm, and 50-100cm):
Soil Carbon = BD (g/cm3) * surface area (108 cm2) * depth interval * %C
For the deeper soil depths, the average of the bulk density from samples collected at 25, 35, and 45 cm was used as the bulked density (BD) when calculating soil C at 20-50 cm depth. Similarly, the average bulk density from samples collected at 65, 75, and 95 cm was used as the bulk density when calculating soil C at 50-100 cm depth. Soil C from the four depth intervals (0-10, 10-20, 20-50 and 50-100 cm) was then summed together to get the total amount of soil C in the upper 1 m of the soil profile. To be noted
6 is that there are 3 soil samples missing: one 20-50 cm for both the 20-year-old and 5-year-old plantation and one 0-10 cm sample in the 7-year-old plantation.
Fine roots (< 2 mm) that were extracted from soil samples when determining BD were cleaned to remove soil debris and then dried to a constant weight (85°C) before being weighed. Fine roots were sent to the Sepilok Forest Research Centre for the determination of % C. However, results from these analyses was unrealistically low and likely the result of soil contamination on the roots. Therefore, we assume that the C content of fine roots was 42% as this value was found for tree roots in an adjacent area (Jensen 2019 unpublished). Fine root density (FRD) was determined as dry weight of fine roots multiple by the % C of fine roots divided by the volume of the metal cylinder. Fine root carbon was calculated for each depth as:
Fine root carbon = FRD (g/cm3) * surface area (108 cm2) *
depth interval * %C
Fine root C from the four depth intervals (0-10, 10-20, 20-50 and 50-100 cm) were summed to get the total amount of fine root C in the upper 1 m of the soil profile.
Aboveground palm trees
In each 40 x 40 m plot, the height of individual oil palm tree was measured with a laser rangefinder (Nikon Forestry Pro Laser Rangefinder) according to the method defined by Thenkabail et al. (2004). There are two equations for determining aboveground biomass of oil palms using height; one is based on a limited height range of palm trees (Thenkabail et al. 2004) and another is based on a wide range of palms, not just oil palm (Goodman et al. 2013). I determined aboveground biomass of oil palms using both equations and the results were similar (Appendix 1) and I therefore chose to present results based on species specific height as described by Thenkabail et al. (2004):
𝐷𝑟𝑦 𝑚𝑎𝑠𝑠 (𝑘𝑔) = 0,3747 ∗ 𝑝𝑎𝑙𝑚 𝑠𝑡𝑒𝑚 ℎ𝑒𝑖𝑔ℎ𝑡 (𝑐𝑚) + 3.6334
Oil palm was assumed to have a C content of 50% (Olson, Watts, & Allison, 1983) and aboveground oil palm C was calculated as:
Aboveground oil palm carbon (kg C) = dry mass * %C
I did not have replication within the different aged plantation, and therefore to create a standard error for aboveground oil palms C for each oil palm age, I determined aboveground oil palm C based on the measurements of individual oil palms in the 40 x 40 m plot. In general, there were ca. 16 oil palms in each 40 x 40 m plots and thus the standard error for each plot was based on psuedo-calculations of aboveground oil palm C found in the plots. In other words, each individual oil palm in the plot was replicated as many times as there were oil palms, which created a standard error based on the number Figure 3. Soil sample intervals used in this
study and the number of samples collected for each depth interval. Surface soil layers 0-10 and 10-20 cm were collected at 3 location with 3 replications per location. Deep soils 20-50 were collected at 25, 35, and 45 cm, whereas soil samples for the deepest interval (50 – 100 cm) were collected at 65, 75, and 95 cm.
7 of oil palms in the plot. Standard error for aboveground oil palm C is only presented in Table 2, to provide an estimate of the variation of oil palm C among the different plantations of varying ages.
In the younger plantations (plantations < 3 yrs.) it was not possible to calculate aboveground biomass using the height-based approach. Thus, to determine the aboveground C pool of young oil palms, length of each individual oil palm fawn connected to individual oil palm seedlings was counted and measured. To be noted is that the oil palm seedlings in the one year old plot has been replanted due to elephant damages. Therefore, the seedlings are a bit younger while the BGB should correspond well with being one year old. In a separate study, we measured the length, fresh weight and dry weight of 25 leaves from five 10-months old seedlings to create an allometric equation to convert length of fawns to biomass (Appendix 2):
𝐷𝑟𝑦 𝑚𝑎𝑠𝑠 𝑓𝑎𝑤𝑛 (𝑘𝑔) = 0.06 ∗ 𝑙𝑒𝑛𝑔ℎ𝑡𝑐𝑚+ 0.2
Dried samples of young leaves were analyzed for total C content by dry combustion of the sub-sample at 900°C using an Elementar Vario Max CN analyzer (Elementar Analysensysteme, Hanau, Germany)), Sepilok Forest Research Centre – Phytochemistry department in Sandakan). The amount of aboveground C in young oil palm seedlings was then calculated using the following equation:
𝑂𝑖𝑙 𝑝𝑎𝑙𝑚 𝑐𝑎𝑟𝑏𝑜𝑛 = (∑(𝐷𝑟𝑦 𝑚𝑎𝑠𝑠 𝑓𝑎𝑤𝑛) ∗ 𝐶%
In three of the 40 x 40 m plots (specifically where oil palm had been planted in 1996, 1998 and 2009), there were tree stumps remaining from the conversion from forest into oil palm plantation. All tree stumps were identified as Borneo ironwood (Eusideroxylon zwageri) with a wood density ranging between 835-1,185 kg/m3 (Wong, 1988). The height and diameter were measured for each tree stump. Additionally, the decay class was also recorded for each tree stump based on the classification described in Chao, Phillips, & Baker (2008). I used a C concentration of 46.5% based on the average C concentration from CWD (further explained in the CWD section), and calculated the amount of C associated with tree stumps as:
𝑆𝑡𝑢𝑚𝑝𝑠 𝑐𝑎𝑟𝑏𝑜𝑛 = (∑(𝑣𝑜𝑙𝑢𝑚𝑒 ∗ 𝐷𝑒𝑐𝑎𝑦 𝑐𝑙𝑎𝑠𝑠2∗ 𝑑𝑒𝑛𝑠𝑖𝑡𝑦)) ∗ 𝐶%
Fawns
Oil palm fawns on the soil surface were measured separately because of their large amount compared to other fine litter. Additionally, oil palm fawns have an extreme heterogeneity distribution as pruned leaves are often collected into piles by workers. To determine the amount of C in senesced palm fawns, samples were taken from four randomly selected 10 x 10 m sub-plots in each 40 x 40 m plot (Figure 2). If the base of the fawn was within the sub-plot, then the length of the entire fawn was measured. On a sample of fawns (n =11) I measured their length and fresh weight in the field. I also took a sub-sample from these fawns and brought it back to the laboratory where they were dried to constant weight (85°C). I was then able to create an allometric equation to convert the length of fawns measured in the field into dry biomass (see appendix 4). A sub-sample was also analyzed for % C using dry combustion at 900°C with an Elementar Vario Max CN analyzer (Elementar Analysensysteme, Hanau, Germany). The amount of C in senesced palm fawns was estimated by multiplying the total dry biomass of senesced fawns in each sub-plot by the C concentration in senesced palm fawns:
8 𝐹𝑎𝑤𝑛 𝑐𝑎𝑟𝑏𝑜𝑛 = ∑(1.04 ∗ 𝑙𝑒𝑛𝑔ℎ𝑡𝑐𝑚+ 20.6) ∗ 𝐶%
Estimates of C in senesced palm fawns was calculated for each sub-plot and values reported are the mean ± SE (n = 4).
Coarse woody debris
Coarse woody debris (CWD) was collected from two 1 x 40 m transects located along the periphery of each 40 x 40 m plot (see Figure 2). All CWD > 2 cm in diameter and at least 50% aboveground was collected and weighed in the field. A sub-sample was brought back to the laboratory and dried to constant weight (85°C). If the piece was too large to collect (i.e., a fallen tree trunk), the diameter and length that was within the 1 x 40 m transect was measured for determination for volume. We also recorded the decay class for larger CWD based on the classification system described in (Chao et al. 2008). Biomass of the larger CWD was then calculated by multiplying the volume by wood density (i.e., the mean wood density for tree species in Southeast Asia derived from the global wood density database (Zanne, A. E. et al. 2009)), and corrected for the different decay classes, since decay affects the wood density (Chao et al. 2008). Total CWD was calculated as the sum of all CWD > 2 cm plus the biomass of all large coarse woody debris in both transect. Carbon concentration was derived from a representative mixture of the different decay (Chao et al. 2008) classes collected in the field, for each individual plot. Carbon concentration was determined by dry combustion of the sub-sample at 900°C using an Elementar Vario Max CN analyzer (Elementar Analysensysteme, Hanau, Germany). This C concentration was also applied for the larger CWD where no field samples were collected. Values for the carbon contribution from CWD was calculated as follows and then scaled to a hectare;
𝐶𝑊𝐷𝑙𝑜𝑔𝑠 𝑐𝑎𝑟𝑏𝑜𝑛 = (∑(𝑣𝑜𝑙𝑢𝑚𝑒 ∗ 𝐷𝑒𝑐𝑎𝑦 𝑐𝑙𝑎𝑠𝑠𝑋∗ 𝑑𝑒𝑛𝑠𝑖𝑡𝑦)) ∗ 𝐶%
𝐶𝑊𝐷 𝑐𝑎𝑟𝑏𝑜𝑛 = ∑ ( 𝑆𝑎𝑚𝑝𝑙𝑒 𝑤𝑒𝑖𝑔ℎ𝑡𝑑𝑟𝑦 𝑠𝑎𝑚𝑝𝑙𝑒 𝑤𝑒𝑖𝑔ℎ𝑡𝑓𝑟𝑒𝑠ℎ
∗ 𝑊𝑓𝑖𝑒𝑙𝑑) ∗ 𝐶%
Fine litter
In each 40 x 40 m plot, fine litter was collected from a 0.5 x 0.5 m square in the center of three 10 x 10 m sub-plots. Fine litter was defined as dead organic matter that could still be distinguished as either dead flowers, fruits, leaves, and/or branches that were < 2 cm in diameter. Highly decomposed palm fruits were included in the fine litter collection, while fresh oil palm fruits were excluded since they were regularly picked up by workers and rarely observed on the soil surface. All fine litter within the 0.5 x 0.5 m square was collected and dried (85°C) before being weighed. A sub-sample of each fine litter sample was analyzed for total C by dry combustion at 900°C using an Elementar Vario Max CN analyzer (Elementar Analysensysteme, Hanau, Germany), at the Sepilok Forest Research Centre. The amount of C in fine litter was determined by multiplying fine litter dry weight from each plot with the C concentration found for fine litter in the corresponding plot.
Economic value of oil palm
We also calculated the economic value during the 22 year period of oil palm production. To do this, SSB provided us the weight of fresh fruit bunches (FFB) collected in each of the different aged oil palm plantations (i.e., 3, 5, 7, 9, 11, 14, 20, and 22 old plantations where I collected my samples). I calculated the average production of FBB from plantations ranging from 2 to 22 yrs old to determine the annual amount of FFB per hectare during the entire rotation period. Economic value was then estimated by
9 multiplying the weight of FFB by the average annual selling price of fresh fruit bunches in 2018 as determined by the Malaysian oil palm board (Malaysian palm oil board, 2018b):
𝐸𝑐𝑜𝑛𝑜𝑚𝑖𝑐 𝑣𝑎𝑙𝑢𝑒 = (𝐹𝐹𝐵 𝑝𝑟𝑜𝑑𝑢𝑐𝑡𝑖𝑜𝑛𝑎𝑣𝑒𝑟𝑎𝑔𝑒∗ 𝑝𝑟𝑜𝑑𝑢𝑐𝑡𝑖𝑣𝑒 𝑦𝑒𝑎𝑟𝑠 (20) ∗ 𝑠𝑒𝑙𝑙𝑖𝑛𝑔 𝑝𝑟𝑖𝑐𝑒) −
𝑚𝑎𝑛𝑎𝑔𝑒𝑚𝑒𝑛𝑡 𝑐𝑜𝑠𝑡𝑠
In addition to the revenue generated from oil palm, companies establishing oil palm plantations can also sell the timber during the conversion from secondary forests to oil palm plantation, which in turn provides an additional revenue of 9 860–12 750 USD (Fisher et al. 2011). This additionally revenue from the sale of timber is roughly equal to the establishment costs of a new plantation up until the first production of FFB (Wahid & Simeh, 2009). Therefore, neither the revenue generated from timber sale nor the initial established costs were included in the above equation for calculating the economic value of an oil palm plantation. However, the management costs of 553 USD ha-1 yr-1, which includes costs
associated with labor, fertilizers and harvesting (Ismail, Simeh, & Noor, 2003), were included in the calculations of economic value of oil palm plantations.
I also wanted to determine a more realistic C credit payment (USD/ ton of carbon) that would be equal to the economic revenue generated by oil palm production. To do this, I determined the difference in C sequestration between both primary and secondary tropical forests and oil palm plantations by using the following equation:
∆Cecosystem = (C PoolTF – C PoolOP) + (C SequestrationTF – C sequestrationOP)
The first part of the equation represents the amount of C lost due to land conversion from tropical forest to a young oil palm plantation, whereas the second part of the equation represent the difference in C sequestration (kg C yr-1) between tropical forest and oil palm plantations during the entire rotation period of oil palm (i.e., 22 years). I divided the economic value of oil palm production during one rotation period by ∆Cecosystem to determine the C credit payment (USD /ton carbon) needed to conserve
tropical forests at the same economical revenue as generated from oil palm. This type of calculation can be done for both secondary and primary forest. The amount of stored and sequestered C for secondary and primary forest is found by looking at other studies in tropical forests (Table 3). In addition, a study done exactly as this C study for oil palm plantations, but in a secondary forest belonging to the INIKEA project provides data for the C pools of equation (table 3) and is complemented by data from Berry et al. (2010) to cover the C sequestration. The INIKEA study is done with the same sampling method for the C pools in AGC and BGC as for this study on four control plots in untouched secondary forest.
Statistical analyses
A one-way ANOVA was used to determine significant (P < 0.05) differences among the 12 plots and soil conditions both on plot level as well as the different soil depths over time (Table 1). When a significant difference was found a post-hoc Tukey Honest Significant Differences was used to determine which means are significantly different from each other.
I used linear regression to test the relationship between oil palm leaf length and leaf dry mass and used this relationship to convert the length measurements into dry mass needed for deriving the leaf C pool. I also used linear regressions to determine if there is a relationship between total C in the plantation and time since planting as well as between individual C pools and time since planting. All linear regressions were done with 95% confidence interval. Data from each of the 40 x 40 m plot represents a different time since planting, except for the site with an age of 20, which is the average of the two sample plots. Individual values for all variables collected at each of the twelve sites are displayed in Table 2.
10
Results
Soil properties
In general, soil texture was not significantly different among the different plots, and consisted of 28% clay, 30% silt and 42% sand.
Table 1. The p-values and F-value from two-way ANOVA (α= 0.05) to see assess if there is any statistically significant difference in the soil properties between plots and soil depths. The statistically significant results are marked with *.
Anova soil characteristics
Clay Silt Sand Phosphorus
Carbon % Nitrogen % pH Acidity Aluminum Plot P F 0.487 0.492 0.096 2.880 0.161 2.033 0.093 2.941 0.242 0.673 0.683 0.169 0.208 1.627 0.087 0.483 0.055 3.846 d.f. 46 46 46 46 46 46 46 44 46 Depth P F 0.0691 2.534 0.872 0.234 0.208 2.033 0.016* 3.837 >0.001* 19.93 0.397 1.011 0.622 1.011 0.696 0.483 0.564 0.689 d.f 44 44 46 44 44 44 44 44 44
Overall, there was no significant difference in soil nitrogen, pH, Acidity, aluminum, phosphorus or total C among sites (Table 1). However, there were significant differences among depth for both phosphorus and C concentrations, with higher concentration found near the soil surface (Table 1, Figure 4). When combining all depths, there was no significant difference in BD among the different sites, with an overall average of 1.4 g/cm3 (Appendix 2).
The average BD for the different depths was 1.26, 1.31, 1.52 and 1.54 g/cm3 for 0-10, 10-20, 20-50 and
50-100 cm depths intervals respectively.
Figure 4. Differences in soil carbon (top) and phosphorous (bottom)
among four different soil depths 0-10 cm (10), 10-20 (20), 20-50 (50) and 50-100 (100), for soils collected across 12 palm oil plantations in Sabah, Borneo (n = 12). The boxes represent the quartiles Q1 and Q3, the error bars represent, the standard error of the standard deviation and the black line in each box represents median, the dots are outliers in the data. Within each panel, boxes topped by the same letter are not significantly different from each other (Tukey Honest Significant Differences, at p = 0.05). ANOVA results are given in Table 1.
11
Total carbon sequestration
Due to an unrealistically high C value in soil for the 1-year old plot it has been removed from all following results, but year 1 values are still included for all results excluding soil C. Since there were two plots in 20 year old plantation, we use the average of these two plots in the subsequent graphs. When including all C pools (aboveground oil palm, stumps, CWD, fine litter, soil and fine roots) there was a significant (P < 0.001) positive relationship between total C and time since conversion. The slope of this regression provides an estimate of the total amount of C being sequestered during an entire oil palm rotation period, which was 2770 kg C ha-1 year-1 or nearly 70 ton C ha-1 during the rotation period. The
intercept of this regression line represents the amount of total C remaining after the conversion from forest to oil palm, which was ca. 62 tons of C ha-1.
Figure 5. The overall sequestration of carbon during one rotation of oil palm plantation is shown by the inclination of the graph above. The R2 value is 0.792 and the P>0.001 The 95% confidence interval is shown in the shaded grey area based on
the regression model. Year one is removed due to unrealistic soil carbon value and the two measured plots in year 20 are represented as a mean.
Individual carbon pools
With regards to individual C pools the relative contribution of different C pools to the total amount of C in an oil palm plantation varied with time since conversion. In general, the amount of C in aboveground oil palm was an important contributor to total C (26%), this was especially the case in plantation that were > 12 years old where aboveground oil palm represents roughly 40 % of the total carbon. In contrast, soil C represents the biggest soil C pool in younger plantations representing roughly 80% of the total C in plantation that are less than 12 years old. Despite variation among other C pools in the different aged oil palm plantation, these C pools had a minor contribution to total C (Table 2).
12
Table 2. The mean (± SE) amount of carbon (kg C ha-1) in above- and belowground carbon pools in 12 sample plots representing an entire rotation period. The SE for soil and root C is calculated
from the standard error from the different depth categories. *Due to the complicated sampling of CWD, SE-values were unreliable and therefore excluded from the table. ** Due to unrealistic values of soil C in the one year old plantation it has been removed. Both 20 year old plantations are shown to show the variation among age classes which has not been accounted for in this study.
Years since conversion Above ground carbon (Kg/ha) 0.2 1 3 5 7 9 11 14 18 20 20 22 Oil palm 234 ±37 150 ±48 7080 ±1405 8159 ±1711 13148 ±2559 17198 ±3110 25161 ±5565 34130 ±5916 47431 ±4993 51975 ±3811 57944 ±6366 45347 ±3827 AGC % of total C 0.4 15.3 9.1 9.3 21.2 23.2 25.5 29.8 43.7 48.9 43.9 38.2 Below ground carbon Stumps 0 0 0 0 0 517 ±37 0 0 0 0 156 ±11 6756 ±478 CWD* 453 42 744 8088 1902 48 5690 3494 0 2297 0 444 Fawns 0 0 16 ±4,7 43 ±8,7 35 ±7,2 67 ±5,2 26 ±4,0 29 ±3,1 16 ±7,0 44 ±2,2 38 ±2,6 9 ±2,9 Fine litter 912 ±883 787 ±488 390 ±188 469 ±212 611 ±337 95 ±3 251 ±182 728 ±468 1281 ±799 669 ±551 189 ±107 431 ±279 Soil 57766 ±1685 0** 69577 ±1932 70724 ±1940 46363 ±3631 56299 ±1508 67343 ±2253 76281 ±3193 59710 ±829 53513 ±1270 71423 ±3668 66665 ±2513 Roots 14 ±2 5 ±1 6 ±1 4 ±1 28 ±3 11 ±1 10 ±2 16 ±4 29 ±5 19 ±3 18 ±5 32 ±5 Sum BGC 59146 834 70734 79329 48939 56966 73319 80549 61036 54245 74100 73413 BGC % of total C 99.6 84.7 90.9 90.6 78.7 76.6 74.4 70.2 56.2 51.0 56.1 61.8 Total C in the plantation 59380 984 77814 87488 62087 74164 98480 114678 108467 106221 132043 118761
13
Oil palm
Carbon stored in aboveground oil palms (AGC) changed the most over time, ranging from 0.4% to 49% of the total C pool in young plantations to older plantations, respectively (R2 =0.968, P<0.001, α. =
0.05). The slope of this regression provides an estimate of 2850 kg C ha-1 yr-1 in aboveground oil palm
C, which is higher than the 2770 kg C ha-1 year-1 found for the whole plantation.
Figure 6. Linear relationship between time since planting and aboveground oil calm C (ACG) during an entire rotation period. The slope of this line provides an estimate of C sequestration in aboveground oil palm, which is highly significant (R2 = 0.968,
14
Soil
Figure 7. The distribution of oil palm carbon (C) shown per C pool with BGC displayed as below the zero line and oil palm being the only AGC displayed above the zero line. Year one soil C is removed due to strangely high values. Year 20 is an average of the two plots measured in that year.
In general, soil C represented 70% of the total C in oil palm plantations (Figure 7). However, in contrast to what was observed for aboveground oil palm, there was no statistically significant relationship between soil C and time since planting (R2 = 0.0147, P-value = 0.723, d.f.=9). However, there was a
significant negative relationship between soil C and time since planting for soil C at 10-20 cm soil depth (R2 = 0.195, P-value=0.010). In contrast, there was a significant positive relationship between soil C and
time since planting for soil C at 50-100 cm depth interval (R2 = 0.203, P-value=0.008) (Figure 8).
Figure 8. Linear regression between time since conversion and soil carbon kg C ha-1 in the different soil depths: 0-10 cm (A),
15
Roots
In general, there was a significant positive relationship between fine root C and time since planting (P-value >0.001, R2 0.631). This statistically significant positive relationship between fine root C and time
since planting was found for all depth intervals, except the 20-50 cm depth interval (Figure 9). Despite these positive relationships, the contribution of fine root C to total C is relatively small, where in the 22 year old plantation fine root C contributes only 0.03% to the total C.
Figure 9. Linear regression between time since planting and fine root carbon at different depth intervals: 0 – 10 cm (A), 10 – 20 cm (B), 20 – 50 cm (C), 50 – 100 cm (D).
CWD & Stumps
CWD was completely absent in two plots (18 and 20 year old) (Table 2). Stumps were only found in 3 of the 12 plots (9, 20 and 22 year old plantations). Carbon in stumps contributed very little to total C (table 2). Specifically, stumps in the 22-year-old plantation made up ca. 6% to total C, whereas in the other two sites (20 and 9 year old) it made up less than 1% of the total C. The contribution of CWD to total C was slightly higher, ranging between 0 and 10%. There was no significant relationship between C in CWD and time since planting (R2=0.004, P-value=0.771).
Senesced fawns and fine litter
There was no significant relationship between time since planting and carbon in senesced fawns (R2=0.020, P-value=0.383). The contribution of senesced fawns to total C was very minor (0-0.09%).
For fine litter there was a significant positive relationship between time since planting and C (R2=0.014,
P-value > 0.001). However, similar to CWD the contribution of fine litter to total C was minor, ranging between 0.13-1.53% of total C.
16
Carbon pricing
For establishing a relation between the measured oil palm plantation and the previous forest stand the following table of literature has been used for defining the pre-existing carbon before conversion into oil palm plantations.
Table 3 Above- and belowground carbon pools as well as estimates of C sequestration in natural tropical forests and oil palm plantations. The * indicates that the BGC was estimated by a model, ** Indicates both AGC and BGC was included in the sequestration.
Sources for carbon in
forests
Location of
study
C sequestration
Ton ha
-1yr
-1AGC
Ton ha
-1BGC
Ton ha
-1(Berry et al. 2010)
Sabah
0.28-1.4
(Hector et al. 2011)
Sabah
136-234
(Dirocco, 2012)
Malaysia
149
27
*(Jensen, 2019)
Sabah
96
120
(Noordwijk, Ningsih, &
Rahayu, 2015)
Sabah
54
(Guillaume, Muhammad,
& Yakov, 2015)
Indonesia
54-62
Sources for carbon in
oil palm plantations
C sequestration
Ton ha
-1yr
-1AGC
Ton ha
-1BGC
Ton ha
-1(Nunes, Ewers, Turner,
& Coomes, 2017)
Sabah
18
(Lamade
&
Bouillet,
2005)
Countries
with oil palm
13**
(Thenkabail et al. 2004)
West Africa
3
(Noordwijk et al. 2015)
Sabah
50
(Kongsager et al. 2013)
Ghana
45
(Rahman et al. 2018)
Borneo
40-70
(Sanquetta et al. 2015)
Brazil
40
The economic value of oil palm plantations is solely based on profit, and I have excluded industrial expenses and associated with refining FFB as this would be a very complex calculation and this information is difficult to find. Production of fresh fruit bunches (FFB) was provided from SSB, although data for the 18-year-old plantation is missing. The average production of FFB during the 20 productive years was 21 ton-1 ha-1 year-1 (figure 10).
17
Figure 10 The fresh fruit bunches (FFB) production in the different oil palm plantations, 18 years is still missing and 20 years is an average of the two plots in that age.
Using the average selling price of 113 USD ton-1 FFB-1 (Malaysian palm oil board, 2018b), together
with the management cost 553 USD ha-1 (Ismail et al. 2003) during the 20 years which was not covered
by the timber sales of conversion (Wahid & Simeh, 2009), I estimated an economic value of 37 168 USD ha-1 during the entire 22 year rotation period or 1 689 USD ha-1 year-1.
When changing the land use from forest to oil palm the rate of C sequestration as well as the C pools changes considerably (Table 3). On the one hand, C sequestration capacity increases up to 4 times compared to estimations by Berry et al. (2010) when converting forest into oil palm plantations. On the other hand, there is initially a considerable loss of AGC of 136 to 234 ton C ha-1. So, after 20-22 years,
oil palm plantations only contain 22-38% of the total C (AGC) compared to forest. If looking at both above and below ground C these oil palm plantations that are 22-years old contain roughly 55% of the AGC and BGC of tropical forests.
This calculation is looking only at C in the trees of the forests and oil palm C in the oil palm plantations. Based on these numbers, making C credits USD C ton-1 competitive with the economical profit of oil
palm plantations would cost 197-351 USD/ton C for logged forest. So, since secondary forest stores less C per hectare than primary forest, every ton of C will be more expensive to conserve in secondary logged forest than in the primary rainforest.
When I compared all the C collected in oil palm plantation to the study done in INIKEA secondary forest the results were different, 216 ton C instead of 136 ton C is lost in secondary forest. In INIKEA the average C storage for control plots in secondary forest was found to be 216 M C ha-1 (Jensen, 2019).
Since there was no time scale for the four plots measured in INIKEA and therefore no C sequestration derived, this value was used together with the C sequestration value for secondary forest from Berry 2010. Using the same equation as the example above whit these other values indicates the price for C would have to be 333 USD ton-1 C for secondary forest to be financially equal to a generation of oil
18
Discussion
This study is unique in that is the only study that I am aware of that has quantified both above- and belowground C pools during an entire rotation period of oil palm. Compared to the total amount of C stored in a nearby tropical forest (i.e, the INIKEA sow-a-seed project), the conversion of tropical rain forest to oil palm plantation resulted in the loss of ca 160 ton of C ha-1 when looking at both AGC and
BGC. During the 22-year rotation period, nearly three tons of C ya-1 is being sequestered each year, with
majority of this C sequestration associated with aboveground oil palms. When combining this information with the economic revenue associated with oil palm, it becomes obvious that the current price for C (27 USD per ton CO2) does not provide the necessary financial incentive to limit the
widespread expansion of oil palm plantations on C rich forest land.
The results show that majority of the C lost during land conversion from tropical forest to oil palm was from aboveground C pools. For example, estimated aboveground C pools in tropical primary and secondary forest ranged between 136-234 ton C per hectare and this amount would be lost in conversion to oil palm. There is also an additional loss in soil C. When comparing soil C in a nearby secondary forest to the amount of soil C in the youngest plantation in this study, there was a 22% reduction in soil C which corresponds to roughly 17 tons of C per hectare. This amount is similar to other studies that have reported a 20% reduction in soil C when converting tropical forest into agriculture (Murty, Kirschbaum, Mcmurtrie, & Mcgilvray, 2002). Thus, the total loss of ecosystem C as a result of land conversion to oil palm plantation ranges between 153 and 251 ton of C per hectare, which is a substantial amount of C.
We found that the rate of C sequestration in oil palm plantation in northern Borneo was ca. 3 tons of C ha-1 yr-1 which is considerably higher than estimated C sequestration rates for natural forest and forests
regenerating after logging at nearby sites (0.3 and 1.4 tons C per hr-1 yr-1; respectively; Berry et al.
(2010)). Moreover, my calculation of C sequestration in oil palm excluded FFB, which can represent a substantial C pool (Figure 10) that is often overlooked. In a study that included FFB, it was estimated that oil palm plantations can sequester 13.5 ton C ha1 yr-1 (Lamade &Bouillet 2005). Thus, oil palm
plantations can sequester four times more C per hectare compared to tropical forests thereby suggesting that oil palm has the potential to mitigate against rising atmospheric CO2 concentrations (Berry et al.
2010).However, oil palm plantations are usually burnt at the end of the rotations, converting the sequestered C back to CO2. Further, despite the higher C sequestration rates of oil palm, it is important
to point out that at the end of the rotation period the amount of aboveground C stored in oil palm plantation is still 55% of natural tropical forests. For the oil palm to sequester the 160-ton C ha-1 lost in
the conversion would take around 3 generations (2.6 rotations or 57 years). However, identifying the time for recovering lost C in conversion with the current data set is very hard, a study following the effects of C from plantation to different products is needed to make such an estimation. However, these estimations are of great importance for the discussion concerning sustainability of crude palm oil, biofuel made from oil palm and all other products connected to oil palm.
Aboveground oil palm C and soil C are the two largest C pools in oil palm plantations (Table 2), whereas CWD, senesced fawns, fine litter, and fine roots make up only a minor part (<10%) of the total C. In the younger plantation (<12 years), soil C represent nearly all the C in these plots (< 80%), whereas in the older (>12 years) plantations, aboveground oil palm contributes to ca. 40-50% of the total C. These changes in where C is being stored is largely the result of a significant increase in aboveground oil palm biomass with time since planting; the aboveground C sequestration rate in aboveground oil palm is 2.9 ton C ha-1 yr-1 (Figure 6). In contrast, we found no overall change in soil C during the rotation period.
19 plantations can results in net gain of soil C (Flynn et al. 2012; Hassan, Jaramillo, & Griffin, 2011; Sauerborn, 2008; Verhoeven & Setter, 2010). However, empirical data of soil C through an entire rotation period are extremely rare, and the only other study that we are aware of that has assessed soil C during an entire rotation period reported no change (Khasanah, van Noordwijk, Ningsih, & Rahayu, 2015), which is consistent with my findings. These results further highlight that aboveground oil palm biomass is largely responsible for high rates of C sequestration in oil palm plantations.
One way to reduce the amount of tropical forests being converted into oil palm plantations is to provide payment of C credits for intact tropical forest. It has previously been suggested that offsetting the opportunity costs of forest conversion (i.e., payment of C credits) is economical in many tropical countries (Stern 2007; Kindermann et al. 2010). For example, it has been estimated that 50% of the world’s deforestation could be stopped for as little as 5 USD per ton of CO2 (Stern, 2007). However,
several studies have shown that the current C payment is much too low compared to the lucrative amount of money that is generated through the production of palm-oil (Butler et al. 2009; Fisher et al. 2011; Persson & Azar, 2010; Venter et al. 2009). In this study I was able to provide a more realistic C credit payment needed to financially compensate for a conversion of tropical forest into oil palm plantations. Based on the production of FFB during an entire rotation period and the selling price of FFB, I determined an economic revenue of 37,168 USD ha-1 during the entire rotation period or 1,697 USD ha -1 yr-1. I also determine that the difference in C sequestration between oil palm and secondary forest
during a rotation period (22 yrs) was 1,4-2,5 ton C ha-1. Dividing the economic revenue by the difference
in C sequestration I get a C credit payment of 197-351 USD per ton of C, or 54-96 USD per ton of CO2.
This amount is considerably more than the current price for C (27 USD per ton of CO2), and highlights
the need for other non-carbon-related payments for ecosystems to help mitigate the conversion of tropical forest into oil palm plantations.
Conclusion
In conclusion, I used a unique data set of above-and belowground C pools collected along a chrono sequence of oil palm plantations representing an entire rotation period to determine the C sequestration rate of oil palms in northern Borneo. Despite a substantial loss of C during conversion, oil palm plantations sequester ca. 3 ton of C ha-1 yr-1 which is 4 times the greater than many forest ecosystems.
Aboveground oil palm was largely responsible for the high rate of C sequestration in oil palm plantation, whereas there was no obvious change in soil C during the rotation period. Dividing the economic revenue of oil palm by the difference is C sequestration between tropical forest and oil palm plantations, I calculated a C credit payment of 54-96 USD per ton of CO2, which is considerably less than the current
ETS price for C. Thus, if we want to limit the conversion of tropical forest to oil palm plantations the current C credit payment is not enough and addition payments for other ecosystem services (i..,e biodiversity and water quality) are needed.
20
References
Ayodele, T. (2010). African Case Study : Palm Oil and Economic Development in Nigeria and Ghana ; Recommendations for the World Bank ’ s 2010 Palm Oil Strategy, (August).
Berry, N. J., Phillips, O. L., Lewis, S. L., Hill, J. K., Edwards, D. P., Tawatao, N. B., … Hamer, K. C. (2010). The high value of logged tropical forests: Lessons from northern Borneo. Biodiversity
and Conservation, 19(4), 985–997. https://doi.org/10.1007/s10531-010-9779-z
Butler, R. A., Koh, L. P., & Ghazoul, J. (2009). REDD in the red: palm oil could undermine carbon payment schemes. Conservation Letters, 2(2), 67–73.
https://doi.org/10.1111/j.1755-263X.2009.00047.x
Carter, C., Finley, W., Fry, J., Jackson, D., & Willis, L. (2007). Palm oil markets and future supply.
European Journal of Lipid Science and Technology, 109(4), 307–314.
https://doi.org/10.1002/ejlt.200600256
Chao, K.-J., Phillips, O. L., & Baker, T. R. (2008). Wood density and stocks of coarse woody debris in a northwestern Amazonian landscape. Canadian Journal of Forest Research, 38(4), 795–805. https://doi.org/10.1139/x07-163
Climate-Data. (2018). CLIMATE KOTA KINABALU. Retrieved July 30, 2019, from https://en.climate-data.org/asia/malaysia/sabah/kota-kinabalu-3752/#climate-graph Corley, R. H. V, & Tinker, P. B. (2008). The oil palm.
Corvalan, C., Hales, S., & McMichael, A. (2005). Ecosystems and human well-being. Business, 18(2). Day, P. . (1965). Particle fractionation and particle-size analysis.
Dirocco, T. L. (2012). A Thorough Quantification of Tropical Forest Carbon Stocks in Malaysia.
Carbon Stocks of Tropical Forests, 1–18.
FAO. (2018). STAT. Retrieved from http://www.fao.org/faostat/en/#data/QC/visualize
Fisher, B., Edwards, D. P., Giam, X., & Wilcove, D. S. (2011). The high costs of conserving Southeast Asia ’ s lowland rainforests, (5). https://doi.org/10.1890/100079
Fitzherbert, E. B., Struebig, M. J., Morel, A., Danielsen, F., Brühl, C. A., Donald, P. F., & Phalan, B. (2008). How will oil palm expansion affect biodiversity? Trends in Ecology and Evolution,
23(10), 538–545. https://doi.org/10.1016/j.tree.2008.06.012
Flynn, H. C., Canals, L. M. I., Keller, E., King, H., Sim, S., Hastings, A., … Smith, P. (2012). Quantifying global greenhouse gas emissions from land-use change for crop production. Global
Change Biology, 18(5), 1622–1635. https://doi.org/10.1111/j.1365-2486.2011.02618.x
Gatto, M., Wollni, M., Asnawi, R., & Qaim, M. (2017). Oil Palm Boom, Contract Farming, and Rural Economic Development: Village-Level Evidence from Indonesia. World Development, 95, 127– 140. https://doi.org/10.1016/j.worlddev.2017.02.013
Goodman, R. C., Phillips, O. L., Torres, C., Freitas, L., Tapia, S., Monteagudo, A., & Baker, T. R. (2013). Forest Ecology and Management Amazon palm biomass and allometry. Forest Ecology
and Management, 310, 994–1004. https://doi.org/10.1016/j.foreco.2013.09.045
Guillaume, T., Muhammad, D., & Yakov, K. (2015). Losses of soil carbon by converting tropical forest to plantations : erosion and decomposition estimated by d 13 C, 3548–3560.
https://doi.org/10.1111/gcb.12907
Hassan, M. N. A., Jaramillo, P., & Griffin, W. M. (2011). Life cycle GHG emissions from Malaysian oil palm bioenergy development: The impact on transportation sector’s energy security. Energy
21
Policy, 39(5), 2615–2625. https://doi.org/10.1016/j.enpol.2011.02.030
Hector, A., Philipson, C., Saner, P., Chamagne, J., Dzulkifli, D., O’Brien, M., … Godfray, H. C. J. (2011). The Sabah Biodiversity Experiment: A long-term test of the role of tree diversity in restoring tropical forest structure and functioning. Philosophical Transactions of the Royal
Society B: Biological Sciences, 366(1582), 3303–3315. https://doi.org/10.1098/rstb.2011.0094
Henders, S., Persson, U. M., & Kastner, T. (2015). Trading forests: Land-use change and carbon emissions embodied in production and exports of forest-risk commodities. Environmental
Research Letters, 10(12). https://doi.org/10.1088/1748-9326/10/12/125012
Ismail, A., Simeh, M. A., & Noor, M. (2003). the Production Cost of Oil Palm Fresh Fruit Bunches: the Case of Independent Smallholders in Johor. Oil Palm Industry Economic Journal, 3(1), 1–7. Retrieved from http://palmoilis.mpob.gov.my/publications/OPIEJ/opiejv3n1-1.pdf
Jensen, J. (2019). Above- and belowground carbon stocks and effects of enrichment planting in a
tropical secondary dipterocarp rainforest, Borneo. Swedish University of Agricultural Sciences.
Khasanah, N., van Noordwijk, M., Ningsih, H., & Rahayu, S. (2015). Carbon neutral? No change in mineral soil carbon stock under oil palm plantations derived from forest or non-forest in Indonesia. Agriculture, Ecosystems and Environment, 211, 195–206.
https://doi.org/10.1016/j.agee.2015.06.009
Kindermann, G., Obersteiner, M., Sohngen, B., Sathaye, J., Andrasko, K., Rametsteiner, E., … Beach, R. (2008). Global cost estimates of reducing carbon emissions.pdf.
Koh, L. P., & Wilcove, D. S. (2008). Is oil palm agriculture really destroying tropical biodiversity?
Conservation Letters, 1(2), 60–64. https://doi.org/10.1111/j.1755-263x.2008.00011.x
Kongsager, R., Napier, J., & Mertz, O. (2013). The carbon sequestration potential of tree crop plantations. Mitigation and Adaptation Strategies for Global Change, 18(8), 1197–1213. https://doi.org/10.1007/s11027-012-9417-z
Lamade, E., & Bouillet, J. P. (2005). Carbon storage and global change: The role of oil palm. OCL -
Oleagineux Corps Gras Lipides, 12(2), 154–160. https://doi.org/10.1051/ocl.2005.0154
Malaysian palm oil board. (2018a). OIL PALM PLANTED AREA 2018. Retrieved September 29, 2019, from http://bepi.mpob.gov.my/index.php/en/
Malaysian palm oil board. (2018b). Prices Of Palm Products. Retrieved July 29, 2019, from http://bepi.mpob.gov.my/index.php/en/statistics/price/monthly.html)
Meijaard, E. (2018). PALM OIL AND BIODIVERSITY. Retrieved from
https://www.thejakartapost.com/news/2019/02/06/oil-palms-need-one-ninth-of-land-used-by-other-vegetable-oil-crops.html
Murty, D., Kirschbaum, M. U. F., Mcmurtrie, R. E., & Mcgilvray, H. (2002). Does conversion of forest to agricultural land change soil carbon and nitrogen? A review of the literature. Global
Change Biology, 8(2), 105–123. https://doi.org/10.1046/j.1354-1013.2001.00459.x
Noordwijk, M. Van, Ningsih, H., & Rahayu, S. (2015). Agriculture , Ecosystems and Environment Carbon neutral ? No change in mineral soil carbon stock under oil palm plantations derived from forest or non-forest in Indonesia. “Agriculture, Ecosystems and Environment,” 211, 195–206. https://doi.org/10.1016/j.agee.2015.06.009
Nunes, M. H., Ewers, R. M., Turner, E. C., & Coomes, D. A. (2017). Mapping aboveground carbon in oil palm plantations using LiDAR: A comparison of tree-centric versus area-based approaches.
Remote Sensing, 9(8), 1–13. https://doi.org/10.3390/rs9080816
Olson, J., Watts, J., & Allison, L. (1983). Carbon in Live Vegetation of Major World Ecosystems. Oak Ridge National Laboratory.
22 Persson, U. M., & Azar, C. (2010). Preserving the world’s tropical forests - A price on carbon may not do. Environmental Science and Technology, 44(1), 210–215. https://doi.org/10.1021/es902629x Pirker, J., Mosnier, A., Kraxner, F., Havlík, P., & Obersteiner, M. (2016). What are the limits to oil
palm expansion? Global Environmental Change, 40, 73–81. https://doi.org/10.1016/j.gloenvcha.2016.06.007
Potter, L. (2015). Managing oil palm landscapes.
Rahman, N., De Neergaard, A., Magid, J., Van De Ven, G. W. J., Giller, K. E., & Bruun, T. B. (2018). Changes in soil organic carbon stocks after conversion from forest to oil palm plantations in Malaysian Borneo. Environmental Research Letters, 13(10). https://doi.org/10.1088/1748-9326/aade0f
Randerson, J. T. (2009). CO 2 emissions from forest loss, 2(November), 9–11.
Sanquetta, C. R., Pélliconetto, S., Paula, A., Corte, D., & Lourenço, A. (2015). Quantifying biomass and carbon stocks in oil palm ( Elaeis guineensis Jacq .) in Northeastern Brazil, (November). https://doi.org/10.5897/AJAR2015.9582
Sauerborn, J. G. Æ. J. (2008). Estimation of the impact of oil palm plantation establishment on greenhouse gas balance, 697–716. https://doi.org/10.1007/s10668-006-9080-1
Sheil, D., Casson, A., Meijaard, E., van Noordwijk, M., Gaskell, J., Sunderland-Groves, J., … Kanninen, M. (2009). The impacts and opportunities of oil palm in Southeast Asia What do we
know and what do we need to know ?
Stern, N. (2007). The economics of climate change: the Stern review.
Thenkabail, P. S., Stucky, N., Griscom, B. W., Ashton, M. S., Diels, J., Van der Meer, B., & Enclona, E. (2004). Biomass estimations and carbon stock calculations in the oil palm plantations of African derived savannas using IKONOS data. International Journal of Remote Sensing, 25(23), 5447–5472. https://doi.org/10.1080/01431160412331291279
Turner, E. C., Snaddon, J. L., Fayle, T. M., & Foster, W. A. (2008). Oil palm research in context: Identifying the need for biodiversity assessment. PLoS ONE, 3(2), 2–5.
https://doi.org/10.1371/journal.pone.0001572
Venter, O., Meijaard, E., Possingham, H., Dennis, R., Sheil, D., Wich, S., … Wilson, K. (2009). Carbon payments as a safeguard for threatened tropical mammals. Conservation Letters, 2(3), 123–129. https://doi.org/10.1111/j.1755-263x.2009.00059.x
Verhoeven, J. T. A., & Setter, T. L. (2010). Agricultural use of wetlands: Opportunities and limitations. Annals of Botany, 105(1), 155–163. https://doi.org/10.1093/aob/mcp172
Wahid, M. B., & Simeh, M. A. (2009). Issues Related to Production Cost of Palm Oil in Malaysia. Oil
Palm Industry Economic Journal, 9(2), 1–12. Retrieved from
http://s3.amazonaws.com/zanran_storage/palmoilis.mpob.gov.my/ContentPages/987186715.pdf Wong, T. M. (1988). A Dictionary of Malaysian Timbers. Retrieved from
http://books.google.com/books?id=qeALAAAAIAAJ&pgis=1
Zanne, A. E., Lopez-Gonzalez, G. Coomes, D. A., Ilic, J., Jansen, S., Lewis, S. L., & Chave, J. (2009). Global wood density database.