http://www.diva-portal.org
Postprint
This is the accepted version of a paper published in Research in Nursing & Health. This paper has been peer-reviewed but does not include the final publisher proof-corrections or journal pagination.
Citation for the original published paper (version of record):
Holm, M., Alvariza, A., Fürst, C-J., Öhlen, J., Årestedt, K. (2018)
Psychometric evaluation of the Texas revised inventory of grief in a sample of bereaved family caregivers
Research in Nursing & Health, 41(5): 480-488 https://doi.org/10.1002/nur.21886
Access to the published version may require subscription. N.B. When citing this work, cite the original published paper.
This is the peer reviewed version of the following article: Holm, M., Alvariza, A., Fürst, C.J., Öhlén, J., & Årestedt, K. (2018). Psychometric evaluation of the Texas revised inventory of grief in a sample of bereaved family caregivers. Research in Nursing & Health, 41(5), 480-488, which has been published in final form at https://doi.org/10.1002/nur.21886. This article may be used for non-commercial purposes in accordance with Wiley Terms and Conditions for Use of Self-Archived Versions.
Permanent link to this version:
Psychometric evaluation of the Texas Revised Inventory of Grief in
bereaved Swedish family caregivers in the context of specialized palliative
home care
Maja Holm, Anette Alvariza, Joakim Öhlen & Kristofer Årestedt
Abstract
The Texas Revised Inventory of Grief (TRIG) was developed to measure the intensity of grief after the death of a close person. It consists of two scales: TRIG I (past behaviors) and TRIG II (present feelings). Because of inconsistencies in previous validations, the instrument needs to be further validated, hence the aim of this study was to evaluate the psychometric
properties of the TRIG in a sample of bereaved family caregivers in Sweden. The TRIG was translated to Swedish according to standard principles and 129 bereaved family caregivers completed the questionnaire. Confirmatory factor analyses were conducted to evaluate
factorial validity and considered TRIG I and TRIG II as unidimensional measures of grief. An ordinal version of Cronbach’s alpha was used to evaluate the internal consistency of the scales, which was excellent (α>0.9) for both scales. Criterion related validity was tested against the Hospital Anxiety and Depression Scale (HADS). Criterion related validity was supported by strong correlations between TRIG I and TRIG II as well as moderate
correlations between the TRIG scales and HADS. In conclusion, the TRIG exhibits strong psychometric properties, making it suitable for longitudinal and interventional research in the context of palliative care, with potential utility for clinical purposes.
Keywords: grief/mourning, instrument development and validation, death and dying,
Background
Grief is commonly defined as the distress experienced following the death of a family member or another close person. The experience of loss is universal, but the emotional,
cognitive and behavioral grief reactions can vary greatly (Genevro, Marshall, & Miller, 2004). People may feel a deep sadness at the death of a close person. Many experience intense
yearning, intrusive thoughts and images, and/or a range of dysphoric emotions (Bonanno, Moskowitz, Papa, & Folkman, 2005).
Traditionally, grief has been described as a linear process over time, which ends with a general acceptance of the loss (Kübler-Ross, 1997). However, these theories have been criticized and it has been claimed that situational factors and forms of loss might have a bigger influence on the reaction of grief than the course of time (Holland & Neimeyer, 2010). Still, there is general agreement on the universal “acute” form of grief that initially occurs alongside feelings of disbelief and distress. The acute grief then transforms to “integrated grief,” a less burdensome, but timeless, form of grief (Zisook et al., 2014). Although grief has been acknowledged as a normal and inevitable part of life, it could also have severe social and health-related consequences (Zisook et al., 2010). There is a strong association between grief and increased morbidity and mortality, such as depressive reactions (Zisook et al., 2014).
Instruments with sound psychometric properties are needed to study grief and its reactions. In palliative care, improving bereavement care is a priority and hence, validated instruments are needed both in longitudinal and interventional research but also for clinical purposes to
identify bereaved family members in need of support. In a recent literature review, researchers found that there are few instruments designed specifically to measure grief and that they often aim to measure specific forms or areas of grief (i.e., complicated grief or prolonged grief)
(Montano, Lewey, O'Toole, & Graves, 2016). One of the most widely used instruments to measure grief is the Texas Revised Inventory of Grief (TRIG), which measures the intensity of grief through two different scales: TRIG I, which involves thinking back to the time immediately after the loss (Past Behaviors); and TRIG II, which involves current emotional reactions (Present Feelings) (Faschingbauer, Devaul, & Zisook, 1977). The TRIG was
intended to measure “unresolved grief” (Faschingbauer, Devaul, & Zisook, 1981); however, it has also been described as a measure of “normal” grieving (Prigerson et al., 1995).
TRIG II has been more extensively used than TRIG I because, in many studies, the focus has been placed on the present situation rather than on the past (Holland, Futterman, Thompson, Moran, & Gallagher-Thompson, 2013; Nappa, Lundgren, & Axelsson, 2016; Ringdal, Jordhoy, Ringdal, & Kaasa, 2001). When both scales have been used, they have mainly been studied independently (BrintzenhofeSzoc, Smith, & Zabora, 1999; Gilbar & Ben-Zur, 2002; Park et al., 2016), however, in some cases they have also been combined as a total score (Yopp, Park, Edwards, Deal, & Rosenstein, 2015). Although the TRIG has been extensively used and is translated into several languages, studies on its psychometric properties have been sparse. The original validation of the TRIG resulted in two distinct scales; TRIG I and TRIG II. According to findings from a meta-analysis, the TRIG has strong internal consistency scores across cultures, with Cronbach alpha values of between 0.82 and 0.9 reported for TRIG I and TRIG II, respectively (Montano et al., 2016).
The original two-factor model (TRIG I & TRIG II) was confirmed in a Spanish validation study (Garcia Garcia, Landa Petralanda, Trigueros Manzano, & Gaminde Inda, 2005), but other studies have demonstrated other factor structures. In a validation of the Mexican Spanish version of the TRIG (Wilson, 2006), researchers did not find support for the original
model in a confirmatory factor analysis. Instead, the authors suggested a three-factor model based on exploratory analysis: Past Behaviors, Present Feelings, and Disbelief. An additional factor structure was suggested in a validation of a French version of TRIG. In this validation, the third factor was named Related facts (Paulhan & Bourgeois, 1995). However, the French version includes five items not present in the original TRIG. In an American study,
researchers performed an exploratory and confirmatory factor analysis exclusively on TRIG II and found support for a three-factor model: Emotional Response, Thoughts, and
Nonacceptance (Futterman, Holland, Brown, Thompson, & Gallagher-Thompson, 2010).
Because these previous findings are inconsistent, further evaluations of the factor structure of the TRIG are motivated. Most important, it needs to be established whether the original scales, TRIG I and TRIG II are unidimensional measures of grief. Further, the TRIG has not been evaluated in the context of specialized palliative care, where the focus lies on supporting family caregivers, both during caregiving and in bereavement (Hudson et al., 2010). Hence, the psychometric properties of the TRIG need to be further evaluated. The aim of this study was to evaluate the psychometric properties of the Texas Revised Inventory of Grief (TRIG) in bereaved Swedish family caregivers in the context of specialized palliative home care.
Methods
Design
This psychometric study was based on data from a previously concluded psycho-educational intervention trial (removed for blinded review) in the context of specialized palliative home care. The intervention was delivered to family caregivers during ongoing care to promote wellbeing, decrease negative consequences related to the caregiving role and increase
preparedness for caregiving. The intervention had a randomized design and included both an intervention and control group. Data were collected between June 2013 and January 2016.
Participants and procedure
The participants were bereaved family caregivers of former patients enrolled in specialized palliative home care in a metropolitan area in Sweden. Family caregivers were recruited to the trial by designated health professionals during ongoing care. Family caregivers had to be over 18 years of age, and able to understand the Swedish language. Data were collected through questionnaires at baseline, upon completion of the intervention, 2 months after the
intervention and 6 months after the patient’s death.
Questionnaire
Data for the present study derived from both the intervention and control group and were taken from the questionnaire administered 6 months after the patient’s death. The
questionnaire included demographic items, the TRIG, and the Hospital Anxiety and Depression Scale (HADS), which was used for criterion related validity purposes as it was expected that grief would be correlated with anxiety and depression.
The TRIGconsists of 21 items, measured on a Likert-type scale ranging from 1 (completely true) to 5 (completely false) and divided into two scales. The TRIG I (Past Behaviors) includes 8 items with a total score ranging from 8 to 40. The TRIG II (Present Feelings) includes 13 items, and its total score ranges from 13 to 65. Lower scores indicate higher levels of grief. The TRIG scales are commonly used as continuous measures of grief (T.
Because there was no validated version of the TRIG in Swedish, it was translated by the technique suggested by Beaton and colleagues (Beaton, Bombardier, Guillemin, & Ferraz, 2000). An independent bilingual person translated the items to Swedish, the translated scale was discussed between the authors and compared to the original English scale, and a final version was agreed upon. Another independent bilingual person then translated it back to English, and the Swedish version was confirmed to be linguistically correct. The translated scale was pre-tested to gain feedback concerning its relevance, clarity and sensitivity in a sample of former family caregivers (n=15) who had lost a close person within a year. Of these: 9 were female and 6 were male; their median age was 58 (range=24–89); 6 of them were adult children; and 3 were spouses of the deceased. Because there were very few comments, no further revisions were made.
The Hospital Anxiety and Depression Scale (HADS) has been developed to measure anxiety and depression through two scales: HADS-anxiety and HADS-depression. The two scales consist of 7 items and the responses are rated from 0 to 3, where higher values indicate higher levels of anxiety and depression respectively. The total score for each scale ranges between 0 and 21 (Zigmond & Snaith, 1983).
Statistical analysis
Both parametric and nonparametric statistics were used dependent on level and distribution of data. Item responses were all treated as ordinal data. Descriptive statistics were used to
present demographic data and study variables, including means and standard deviations, medians and quartiles, and absolute and relative frequencies.
Data quality was evaluated through item score distribution and missing data patterns. Floor and ceiling effects for items, referring to the lowest (floor) and highest (ceiling) possible scores, were evaluated using frequency distributions. Up to 20% floor/ceiling effects were considered acceptable. Missing data patterns were evaluated and <5% was considered acceptable.
Homogeneity was evaluated with inter-item correlations and item-total correlations, using polychoric and polyserial correlations (rho, i.e, correlation coefficients for ordinal data) respectively. The average inter-item correlations should fall within the range between 0.4 and 0.5 (Clark & Watson, 1995) and item-total correlations should be >0.3 (Nunnally, 1994) to support homogeneity.
Factorial validity was evaluated through factor analysis. In a first step, a parallel analysis (optimal implementation and 500 replications) based on unweighted least squares (ULS) estimation and polychoric correlations (Garrido, Abad & Ponsoda, 2013) was conducted to justify the evaluation of TRIG I and TRIG II as unidimensional measures. Confirmatory factor analyses (CFA) were subsequently conducted to evaluate the fit of the hypothesized measurement models. TRIG I and TRIG II were first evaluated separately as one-factor models and finally together in a two-factor model. All CFA models were estimated using robust weighted least squares (WLSMV) and polychoric correlations. As the sample size was limited, bootstrapping with 1000 replications was used in all CFA models (Brown, 2015). Different goodness-of-fit statistics were used to evaluate the CFA models; root mean square error of approximation (RMSEA) close to 0.06 or below, comparative fit index (CFI) and Tucker-Lewis index (TLI) close to 0.95 or above (Hu & Bentler, 1999), and weighted root mean square residual (WRMR) below 1.0 (DiStefano, Liu, Jiang, & Shi, 2017). Additionally,
the size and significance of the parameters (i.e., factor loadings) were evaluated as well as the absence of Heywood cases (Brown, 2015).
To evaluate the criterion related validity of TRIG I and TRIG II, scatterplots, Spearman’s rank correlations (rs) and factor correlations were used. Previous studies have showed that
grief is associated with anxiety and depressive symptoms, and to support criterion related validity, it was hypothesized that TRIG I and TRIG II would correlate moderately (rs
=-0.3–-0.7) with HADS-anxiety and HADS-depression. A negative correlation was expected as high scores imply more problems with anxiety and depression on HADS but less problems with grief on TRIG. Strong correlations (rs>-0.7) were not expected as they measure related but
different constructs. As TRIG I and TRIG II aims to measure two different but overlapping aspects of grief, it was expected that the factor correlation between these factors should be strong (>0.7).
The internal consistency of the scales was evaluated through an ordinal version of Cronbach’s alpha which is based on polychoric correlations rather than Pearson correlations (Gadermann, Guhn, & Zumbo, 2012). The interpretation should be regarded equally, i.e., alpha should be >0.7 (Nunnally, 1994). For comparisons with other studies, traditional alpha values were also calculated.
Statistical analyses were conducted using Stata 13.1 (StataCorp, College Station, TX, USA), Mplus 8.0 (Muthén & Muthén, Los Angeles, CA, USA), Factor 10.3 (Rovira Virgili
University, Tarragona, Spain), and R 3.4.3 (The R Foundation for Statistical Computing, Vienna, Austria). The level of statistical significance was set at p<0.05.
Ethical considerations
The study was approved by the regional ethical review board in Stockholm, Sweden (No. 2012/377). Written informed consent was obtained from both patients and family caregivers before family caregivers were enrolled in the study.
Results
Characteristics of family caregivers
In total, 129 bereaved family caregivers completed the TRIG questionnaire. Most of the family caregivers had been spouses (46%) or adult children (36%) of the deceased patient. A majority were female (67%) and the mean age was 61.0 (SD=13.8) years. Further
demographic characteristics are provided in Table 1.
Data quality
All item scores in TRIG I (Past Behaviors) demonstrated ceiling effects, i.e. low levels of grief. There were few missing data for TRIG I, ranging between 1 or 2 missing values for each item (0.8 % vs. 1.6 %). The only exception was item 2, which had 6 missing values (4.7 %) (Table 2). The missing data were related to just a few individuals (n=7).
In TRIG II (Present Feelings), ceiling effects were demonstrated for items 2, 3, 7, 12 and floor effects for items 1, 4, 5, 6, 8, 9, 11, and 13. Item 10 demonstrated both ceiling and floor effects. There were no missing data for TRIG II (Table 3).
Homogeneity
The inter-item correlations for TRIG I varied between 0.33 and 0.75, with a mean of 0.54. The item-total correlations (rho) were all above 0.3 and varied between 0.53 and 0.78 (Table 2).
For TRIG II, the inter-item correlations varied between rho 0.18 and 0.84 with a mean rho of 0.50. The item-total correlations were all above 0.3 and varied between 0.52 and 0.82 (Table 3).
Factorial validity
The parallel analysis suggested a one-factor model for TRIG I (Past Behaviors) and TRIG II (Present Feelings) respectively. The eigenvalues for the reduced correlation matrix were 4.4 and 0.19 for TRIG I and 6.6 and 0.76 for TRIG II.
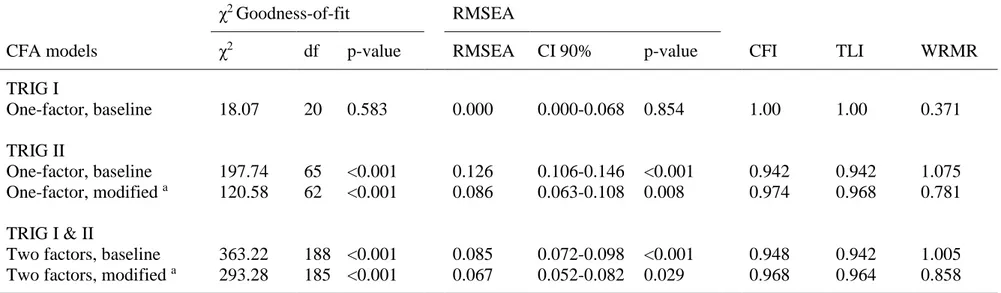
The confirmatory factor analyses were also consistent with TRIG I and TRIG II being unidimensional measures of grief. Model fit for the baseline one-factor model of TRIG I, without any modifications, was excellent according to all goodness-of-fit indices (Table 4). The factor loadings ranged between 0.51 and 0.89, all significant at a level of p<0.001 (Table 5). No Heywood cases were identified.
In contrast to TRIG I, model fit for the baseline one-factor model of TRIG II was
unsatisfactory according to all goodness-of-fit indices. The modification index identified three correlated residual variances for items 1 and 13, 3 and 12, and 6 and 9 as the main problem. The model fit was overall improved in a modified model that allowed these residual variances to correlate. Even though RMSEA remained above the expected level of ≤0.06, CFI, TLI and
WRMR indicated satisfactory model fit (Table 4). The factor loadings for the adjusted model ranged between 0.55 and 0.87, all significant at a level of p<0.001 (Table 5). No Heywood cases were identified.
Finally, a two-factor model including both TRIG I and II was evaluated. The baseline model had unsatisfactory model fit according to all goodness-of-fit indices. The modification index identified the same correlated residual variances in TRIG II as the main problem. A modified model taking these correlations into account resulted in satisfactory model fit in all goodness-of-fit indices. Although RMSEA was above 0.6, the confidence interval covered this critical value (Table 4). The factor loadings of the modified model ranged between 0.61 and 0.86 for TRIG I and 0.54 and 0.87 for TRIG II, all significant at a level of p<0.001. The factor
correlation between TRIG I and II was 0.8 (Table 5). No Heywood cases were identified.
Criterion related validity
The scatterplot revealed a monotonic linear relationship between TRIG I and TRIG II as well as between the TRIG scales and HADS-anxiety and HADS-depression. As hypothesized, the factor correlation between TRIG I and TRIG II was strong, but not too strong (0.80, p<0.001). Also TRIG I and TRIG II correlated as hypothesized with HADS-anxiety (rs=-0.65, p<0.001
and rs=-0.59, p<0.001) and HADS-depression (rs=-0.55, p<0.001 and rs=-0.51, p<0.001).
Altogether, criterion related validity was supported.
Internal consistency
The internal consistency was excellent for both TRIG I and TRIG II. The ordinal alpha value for TRIG I was 0.92, while traditional Cronbach’s alpha was somewhat lower (α=0.87). The
Discussion
To the authors’ knowledge, this is the first psychometric validation of the TRIG that has been performed in the context of specialized palliative home care. We demonstrated that TRIG I and TRIG II are unidimensional measures of grief, i.e. the original two-factor model was supported. Also, we found that the TRIG has few problems with missing data and has satisfying homogeneity and excellent internal consistency.
The item scores were skewed for both TRIG I and TRIG II, with floor and/or ceiling effects for all items in both the scales. The TRIG has previously been criticized because there is little variation in responses to several items (Neimeyer, 2001). However, in the present study, all response options were used for all items, except item 4 in TRIG II. A possible explanation of the skewed distribution of the items could be attributed to the sample, which in this study was taken from an intervention trial. Earlier research has demonstrated that well-adapted
caregivers are more likely to participate in trials in palliative care, which could also affect their ratings in bereavement (Candy, Jones, Drake, Leurent, & King, 2011; Schildmann & Higginson, 2011).
There were very few problems with missing data for the TRIG scales. This could be sample-dependent, but it also indicates that the TRIG items were considered relevant and easy to complete. This also decreases the need for data imputation, which could lead to biased
estimates as there are possible differences between responders and non-responders (Huisman, 2000). The only exception was item 2 in TRIG I, which had 6 missing values (4.7%). This is still below the level of acceptance, which was <5% missing values. Several family caregivers had left a note in the questionnaire to say that they did not answer this question because it was
Homogeneity for TRIG I and II was adequate, as both the scales fell within or close above the recommended range of average inter-item correlations between 0.4-0.5 (Clark & Watson, 1995). The item-total correlations for both scales were above the recommended minimum of rho 0.3. This also demonstrates strong homogeneity of the scales.
The present study found evidence that TRIG I and TRIG II are unidimensional measures of grief, supported by the parallel analyses and CFAs. Thus, the findings support the
hypothesized two-factor structure of the original version of the TRIG (Faschingbauer et al., 1981). However, the one-factor model of TRIG II identified problems with correlated residual variances for some items. The same problems were also seen in the two-factor model
including both TRIG I and TRIG II. The problem with correlated residual variances in TRIG II has also been found in a previous validation study by Futterman et al (2010). Correlated residual variances implies that some of the covariance in the indicators are due to another common outside cause, not the latent variable itself (i.e., the factor). A common reason for correlated residual variances are similarly worded items (Brown 2015). This may explain why the residual variances for item 1 and 13 (crying), 3 and 12 (acceptance) and 6 and 9 (can’t stop thinking about the loss) were correlated. Based on these findings, researchers could consider deleting some of these items in further revisions of TRIG. However, as the sample size was somewhat limited, our findings need to be replicated in larger studies before any revisions should be made. Until then, TRIG I and TRIG II should be treated as
unidimensional measures of grief, in agreement with the recommendations of the constructor.
The correlation analyses between the TRIG scales and the HADS scales also supported criterion related validity. The correlations were moderate, which was expected, because they measure different, but related constructs. Further, the highest correlation was found between
TRIG I and TRIG II which is logical. However, even though the concepts are related, the factor correlation suggests that TRIG I and II should be treated as separate scales. While both scales could be used in baseline or cross-sectional studies, TRIG II is more suited to be used in repeated measurements.
The internal consistency of the TRIG scales was excellent. Our findings demonstrate the need to consider the ordinal nature of the TRIG, as our results show that traditional Cronbach’s alpha underestimated internal consistency in comparison with ordinal alpha. Alpha values exceeding 0.9 can sometimes be a sign of redundancy (i.e., several questions measuring the same construct) (Streiner & Norman. 2015). However, the inter-item and item-total
correlations were both within the recommended range, with no excessive values. Judging from the findings from the CFA (i.e., problems with correlated residual variances), it is possible that some items in TRIG II are redundant and need to be deleted in further revisions.
The TRIG was constructed almost 40 years ago, and theories and conceptions of grief have changed over time. Older notions suggested that managing grief included putting the past behind and letting go of the deceased person, while new understandings of grief are based on conceptions of continued bonds with the deceased (Stroebe & Schut, 1999). Although TRIG was initially designed to measure “unresolved grief,” the instrument includes benign
symptoms that should not be viewed as a sign of lasting impairment (i.e. No one will ever take the place in my life of the person who died). Hence, it has been claimed that TRIG measures “normal,” grief rather than pathologic grief (Prigerson et al., 1995).
We have demonstrated that from a psychometric perspective, the TRIG is appropriate to use in bereavement after palliative care. This is an important finding for clinical care, as attention
should be paid to family caregivers’ need of bereavement support. Although grief is a normal process, high levels of grief are associated with various forms of morbidity (Zisook et al., 2014), which motivates the use of instruments to measure the phenomenon. TRIG could be used to identify family caregivers in need of support (Hudson et al., 2010), providing an opportunity to express and talk about feelings related to grief. Also, results from criterion related validity evaluations indicate that TRIG could be used to identify family caregivers that need to be assessed for anxiety and feelings of depression and thus receive more bereavement support. By enabling family caregivers to address issues that could be sensitive and difficult to put in words after the death of a close person, TRIG could also serve as a help in
conversations between health care professionals and family caregivers.
Limitations
In the context of specialized palliative care, support for family caregivers is often an essential part of the care. This may imply that the sample was well-supported during caregiving, but also in bereavement, which could have influenced the way they responded to TRIG. Family caregivers from other care contexts may receive less support and therefore respond differently to TRIG. When compared to Swedish family caregivers in general, the sample in the present study appears to be representative with regards to age and sex. Like many other European countries, Sweden has an aging population, where many patients are cared for at home by family caregivers who may also be of higher age (Rechel et al., 2013). It is most common to care for a spouse or a parent. Women take the role as caregivers more often than men, (National Board of Health and Welfare, 2012). The sample size was somewhat limited for a confirmatory factor analysis, in particular for the two-factor model that included all items from both TRIG I and TRIG II. The WLSMV estimation method requires smaller sample
large for middle sized CFA models (Brown 2015). As our sample included 129 family caregivers, bootstrapping was used to help ameliorate this problem. Despite this, the findings need to be interpreted with this limitation in mind, and no modifications of the TRIG should be made based on these findings alone. Finally, we have evaluated criterion related validity by correlating TRIG I and II with each other as well as with closely related constructs (i.e., anxiety and grief), not with a golden standard as commonly recommended (Streiner & Norman, 2015).
Conclusion
This study found that the Swedish version of the TRIG with its two scales, TRIG I and TRIG II, has sound psychometric properties and is valid for use in a palliative care context. Because palliative care includes providing support to family caregivers both during caregiving and in bereavement, scales such as TRIG I and TRIG II are relevant and could be used by health professionals after the patient’s death to measure reactions of grief.
References
Beaton, D. E., Bombardier, C., Guillemin, F., & Ferraz, M. B. (2000). Guidelines for the process of cross-cultural adaptation of self-report measures. Spine (Phila Pa 1976), 25(24), 3186-3191. Bonanno, G. A., Moskowitz, J. T., Papa, A., & Folkman, S. (2005). Resilience to loss in bereaved
spouses, bereaved parents, and bereaved gay men. J Pers Soc Psychol, 88(5), 827-843. doi:10.1037/0022-3514.88.5.827
BrintzenhofeSzoc, K. M., Smith, E. D., & Zabora, J. R. (1999). Screening to predict complicated grief in spouses of cancer patients. Cancer Practice, 7(5), 233-239.
Brown, T. A. (2015). Confirmatory factor analyses for applied research (2nd ed.). New York: Guilford Press.
Candy, B., Jones, L., Drake, R., Leurent, B., & King, M. (2011). Interventions for supporting informal caregivers of patients in the terminal phase of a disease. Cochrane Database Syst Rev(6), CD007617. doi:10.1002/14651858.CD007617.pub2
Clark, L. A., & Watson, D. (1995). Constructing validity: Basic issues in objective scale development. Psychological Assessment, 7(3), 309-319. doi:Doi 10.1037//1040-3590.7.3.309
DiStefano, C., Liu, J., Jiang, N., & Shi, D. (2017). Examination of the Weighted Root Mean Square Residual: Evidence for Trustworthiness? . Structural Equation Modeling-a Multidisciplinary Journal, epub 2017. doi:DOI: 10.1080/10705511.2017.1390394
Faschingbauer, T., Devaul, R., & Zisook, S. (1981). The Texas revised inventory of grief manual. 1981, Houston; Texas: . Houston; Texas: Honeycomb publishing co.
Faschingbauer, T. R., Devaul, R. A., & Zisook, S. (1977). Development of the Texas Inventory of Grief. Am J Psychiatry, 134(6), 696-698. doi:10.1176/ajp.134.6.696
Futterman, A., Holland, J. M., Brown, P. J., Thompson, L. W., & Gallagher-Thompson, D. (2010). Factorial validity of the Texas Revised Inventory of Grief-Present scale among bereaved older adults. Psychol Assess, 22(3), 675-687. doi:10.1037/a0019914
Gadermann, A., Guhn, M., & Zumbo, B. (2012). Estimating ordinal reliability for Likert-type and ordinal item response data: a conceptual, empirical, and practical guide. Practical Assessment, Research & Evaluation., 17(3)(3), 1-13.
Garcia Garcia, J. A., Landa Petralanda, V., Trigueros Manzano, M. C., & Gaminde Inda, I. (2005). [Texas revised inventory of grief: adaptation to Spanish, reliability and validity]. Aten Primaria, 35(7), 353-358.
Garrido, L. E., Abad, F. J. & Ponsoda, V. (2013). A New Look at Horn's Parallel Analysis With Ordinal Variables. Psychological Methods, 18(4), 454-474.
Genevro, J. L., Marshall, T., & Miller, T. (2004). Report on bereavement and grief research. Death Stud, 28(6), 491-575. doi:10.1080/07481180490461188
Gilbar, O., & Ben-Zur, H. (2002). Bereavement of spouse caregivers of cancer patients. Am J Orthopsychiatry, 72(3), 422-432.
Holland, J. M., Futterman, A., Thompson, L. W., Moran, C., & Gallagher-Thompson, D. (2013). Difficulties accepting the loss of a spouse: a precursor for intensified grieving among widowed older adults. Death Studies, 37(2), 126-144. doi:10.1080/07481187.2011.617489 Holland, J. M., & Neimeyer, R. A. (2010). An examination of stage theory of grief among individuals
bereaved by natural and violent causes: a meaning-oriented contribution. Omega (Westport), 61(2), 103-120. doi:10.2190/OM.61.2.b
Hu, L. T., & Bentler, P. M. (1999). Cutoff Criteria for Fit Indexes in Covariance Structure Analysis: Conventional Criteria Versus New Alternatives. Structural Equation Modeling-a
Multidisciplinary Journal, 6(1), 1-55. doi:10.1080/10705519909540118
Hudson, P. L., Trauer, T., Graham, S., Grande, G., Ewing, G., Payne, S., . . . Thomas, K. (2010). A systematic review of instruments related to family caregivers of palliative care patients. Palliat Med, 24(7), 656-668. doi:10.1177/0269216310373167
Huisman, M. (2000). Imputation of missing item responses: Some simple techniques. Quality & Quantity, 34(4), 331-351. doi:Doi 10.1023/A:1004782230065
Kübler-Ross, E. (1997). On death and dying New York: Scribner.
Montano, S. A., Lewey, J. H., O'Toole, S. K., & Graves, D. (2016). Reliability generalization of the Texas Revised Inventory of Grief (TRIG). Death Studies, 40(4), 256-262.
doi:10.1080/07481187.2015.1129370
Nappa, U., Lundgren, A. B., & Axelsson, B. (2016). The effect of bereavement groups on grief, anxiety, and depression - a controlled, prospective intervention study. Bmc Palliative Care, 15, 58. doi:10.1186/s12904-016-0129-0
National Board of Health and Welfare. (2012). Anhöriga som ger omsorg till närstående - omfattning och konsekvenser. Retrieved from
http://www.socialstyrelsen.se/Lists/Artikelkatalog/Attachments/18811/2012-8-15.pdf (2018-03-23)
Neimeyer, R. H., N. (2001). Quantitative or qualitative? Measurement issues in the study of grief. In M. H. Stroebe, RO; Stroebe, W; Schut H (Ed.), Handbook of bereavement research:
Consequences, coping and care. (pp. 89-118). Washington DC: American Psychological Associatio.
Nunnally, J. C., & Bernstein, I. H. . (1994). Psychometric theory (3rd ed.). New York, NY.: McGraw-Hill. Park, E. M., Deal, A. M., Yopp, J. M., Edwards, T. P., Wilson, D. J., Hanson, L. C., & Rosenstein, D. L.
(2016). End-of-life experiences of mothers with advanced cancer: perspectives of widowed fathers. BMJ Support Palliat Care, 6(4), 437-444. doi:10.1136/bmjspcare-2015-000976 Paulhan, I., & Bourgeois, M. (1995). [The TRIG (Texas Revised Inventory of Grief) questionnaire.
French translation and validation]. Encephale-Revue De Psychiatrie Clinique Biologique Et Therapeutique, 21(4), 257-262.
Prigerson, H. G., Maciejewski, P. K., Reynolds, C. F., 3rd, Bierhals, A. J., Newsom, J. T., Fasiczka, A., . . . Miller, M. (1995). Inventory of Complicated Grief: a scale to measure maladaptive symptoms of loss. Psychiatry Res, 59(1-2), 65-79.
Rechel, B., Grundy, E., Robine, J. M., Cylus, J., Mackenbach, J. P., Knai, C. & McKee, M. (2013). Ageing in the European Union. Lancet, 381(9874), 1312-22.
Ringdal, G. I., Jordhoy, M. S., Ringdal, K., & Kaasa, S. (2001). Factors affecting grief reactions in close family members to individuals who have died of cancer. J Pain Symptom Manage, 22(6), 1016-1026.
Schildmann, E. K., & Higginson, I. J. (2011). Evaluating psycho-educational interventions for informal carers of patients receiving cancer care or palliative care: strengths and limitations of different study designs. Palliat Med, 25(4), 345-356. doi:10.1177/0269216310389223 Streiner, D. N. & Norman, R. (2015). Health measurement scales: a practical guide to their
development and use (5th Ed.). Oxford: Oxford University Press.
Stroebe, M., & Schut, H. (1999). The dual process model of coping with bereavement: rationale and description. Death Studies, 23(3), 197-224. doi:10.1080/074811899201046
Wilson, S. (2006). The validation of the Texas revised inventory of grief on an older Latino sample. J Soc Work End Life Palliat Care, 2(4), 33-60.
Yopp, J. M., Park, E. M., Edwards, T., Deal, A., & Rosenstein, D. L. (2015). Overlooked and
underserved: Widowed fathers with dependent-age children. Palliative & Supportive Care, 13(5), 1325-1334. doi:10.1017/S1478951514001321
Zigmond, A. S., & Snaith, R. P. (1983). The hospital anxiety and depression scale. Acta Psychiatr Scand, 67(6), 361-370.
Zisook, S., Iglewicz, A., Avanzino, J., Maglione, J., Glorioso, D., Zetumer, S., . . . Shear, M. K. (2014). Bereavement: course, consequences, and care. Curr Psychiatry Rep, 16(10), 482.
doi:10.1007/s11920-014-0482-8
Zisook, S., Simon, N. M., Reynolds, C. F., 3rd, Pies, R., Lebowitz, B., Young, I. T., . . . Shear, M. K. (2010). Bereavement, complicated grief, and DSM, part 2: complicated grief. J Clin Psychiatry,
Table 1. Characteristics of family caregivers (n=129) Age, m (SD) 61.0 (13.8) Gender, n (%) Men 43 (33.3) Women 86 (66.7) Education level, n (%) University 56 (43.4) Non-university 73 (56.6) Employment, n (%) Employed 56 (43.4) Retired 64(49.6) Other 9 (7.0) Relation to patient, n (%) Spouse 59 (45.7) Adult child 44 (34.1) Other 26 (20.2)
Trig I – past behaviors, Mdn (q1-q3) [m, SD] 31 (25-36) [29.7, 7.9] Trig II – present feelings, Mdn (q1-q3) [m, SD] 38 (26-45) [36.5, 11.9]
Table 2. Data quality and homogeneity for Texas Revised Inventory of Grief - past behaviors (TRIG I) Item score distribution, % a
Items 1 2 3 4 5 Missing data, % Mean (SD) Mdn (q1–q3) ITC b
1. After this person died I found it hard to get along with certain people
17.8 16.3 7.0 17.8 40.3 0.8 3.4 (1.6) 4 (2–5) 0.76 2. I found it hard to work well after this person died 9.3 10.9 13.2 20.2 41.9 4.7 3.8 (1.4) 4 (3–5) 0.78 3. After this person’s death I lost interest in my family,
friends, and outside activities
3.1 8.53 14.7 21.7 51.2 0.8 4.1 (1.1) 5 (3–5) 0.76 4. I felt a need to do things that the deceased had
wanted to do
10.9 18.6 17.8 19.4 32.6 0.8 3.4 (1.4) 4 (2–5) 0.65 5. I was unusually irritable after this person died 6.2 12.4 15.5 22.5 41.9 1.6 3.8 (1.3) 4 (3–5) 0.69 6. I couldn’t keep up with my normal activities for the
first 3 months after this person died
9.3 14.7 11.6 28.7 34.9 0.8 3.7 (1.3) 4 (3–5) 0.78 7. I was angry that the person who died left me 7.8 12.4 7.0 16.3 55.8 0.8 4.0 (1.4) 5 (3–5) 0.53 8. I found it hard to sleep after this person died 21.7 15.5 11.6 25.6 24.8 0.8 3.2 (1.5) 4 (2–5) 0.77
a Response options: 1 = Completely true, 2 = Mostly true, 3 = True and false, 4 = Mostly false, 5 = Completely false b Item-total correlations adjusted for overlaps, based on polyserial correlations
Table 3. Data quality and homogeneity for Texas Revised Inventory of Grief - present feelings (TRIG II) Item score distribution, % a
Items 1 2 3 4 5 Missing data, % Mean (SD) Mdn (q1–q3) ITC b
1. I still cry when I think of the person who died 23.3 21.7 7.0 31.8 16.3 0.0 3.0 (1.5) 3 (2–4) 0.82 2. I still get upset when I think about the person who
died
17.1 17.8 9.3 27.9 27.9 0.0 3.3 (1.5) 4 (2–5) 0.79 3. I cannot accept this person’s death 9.3 3.9 13.2 19.4 54.3 0.0 4.1 (1.3) 5 (3–5) 0.70 4. Sometimes I very much miss the person who died 64.3 22.5 3.1 10.1 0.0 0.0 1.6 (1.0) 1 (1–2) 0.61 5. Even now it’s painful to recall memories of the
person who died
31.8 31.0 10.1 18.6 8.5 0.0 2.4 (1.3) 2 (1–4) 0.74 6. I am preoccupied with thoughts about the person
who died
20.9 30.2 7.0 31.0 10.9 0.0 2.8 (1.4) 2 (2–4) 0.77 7. I hide my tears when I think about the person who
died
5.4 16.3 14.7 24.0 39.5 0.0 3.8 (1.3) 4 (3–5) 0.54 8. No one will ever take the place in my life of the
person who died
58.9 13.2 14.0 5.4 8.5 0.0 1.9 (1.3) 1 (1–3) 0.52 9. I can't avoid thinking about the person who died 31.8 24.0 13.2 20.9 10.1 0.0 2.5 (1.4) 2 (1–4) 0.70 10. I feel it’s unfair that this person died 33.3 16.3 12.4 16.3 21.7 0.0 2.8 (1.6) 3 (1–4) 0.57 11. Things and people around me still remind me of the
person who died
45.0 30.2 7.8 14.0 3.1 0.0 2 (1.2) 2 (1–2) 0.60 12. I am unable to accept the death of the person who
died
6.2 11.6 10.9 22.5 48.9 0.0 4.0 (1.3) 4 (3–5) 0.65 13. At times I still feel the need to cry for the person
who died
39.5 23.3 5.4 18.6 13.2 0.0 2.4 (1.5) 2 (1-4) 0.65
Table 4. Goodness-of-fit statistics of confirmatory factor analyses (CFA) models of the Texas Revised Inventory of Grief (TRIG)
χ2 Goodness-of-fit RMSEA
CFA models χ2 df p-value RMSEA CI 90% p-value CFI TLI WRMR
TRIG I One-factor, baseline 18.07 20 0.583 0.000 0.000-0.068 0.854 1.00 1.00 0.371 TRIG II One-factor, baseline 197.74 65 <0.001 0.126 0.106-0.146 <0.001 0.942 0.942 1.075 One-factor, modified a 120.58 62 <0.001 0.086 0.063-0.108 0.008 0.974 0.968 0.781 TRIG I & II
Two factors, baseline 363.22 188 <0.001 0.085 0.072-0.098 <0.001 0.948 0.942 1.005 Two factors, modified a 293.28 185 <0.001 0.067 0.052-0.082 0.029 0.968 0.964 0.858
The CFA models were based on bootstrapping with 1000 replications
Goodness-of-fit indices for excellent model fit: root mean square error of approximation (RMSEA ≤ 0.06); comparative fit index (CFI ≥ 0.95); Tucker-Lewis index (TLI ≥ 0.95); weighted root mean square residual (WRMR < 1.0)
a Correlated error variances between items; 1 and 13, 3 and 12, 6 and 9
Table 5. Factor loadings, residual variances (within brackets) and factor correlations of the final confirmatory factor analyses (CFA) models of the Texas Revised Inventory of Grief (TRIG)
Items TRIG I One-factor model TRIG II One-factor model TRIG I & II Two-factor model TRIG I
1 After this person died I found it hard to get along with certain people
0.80 (0.36) 0.75 (0.43)
2. I found it hard to work well after this person died
0.80 (0.36) 0.81 (0.34)
3. After this person’s death I lost interest in my family, friends, and outside activities
0.89 (0.20) 0.86 (0.26)
4. I felt a need to do things that the deceased had wanted to do
0.61 (0.63) 0.69 (0.53)
5. I was unusually irritable after this person died 0.75 (0.44) 0.68 (0.54) 6. I couldn’t keep up with my normal activities for
the first 3 months after this person died
0.83 (0.31) 0.83 (0.31)
7. I was angry that the person who died left me 0.51 (0.74) 0.61 (0.63) 8. I found it hard to sleep after this person died 0.76 (0.42) 0.78 (0.39) TRIG II
1. I still cry when I think of the person who died 0.86 (0.27) 0.84 (0.30) 2. I still get upset when I think about the person
who died
0.87 (0.25) 0.87 (0.25)
3. I cannot accept this person’s death 0.76 (0.42) 0.77 (0.41)
4. Sometimes I very much miss the person who died
0.79 (0.38) 0.77 (0.41) 5. Even now it’s painful to recall memories of the
person who died
0.78 (0.39) 0.78 (0.39)
6. I am preoccupied with thoughts about the person who died
7. I hide my tears when I think about the person who died
0.56 (0.69) 0.54 (0.71) 8. No one will ever take the place in my life of the
person who died
0.58 (0.66) 0.63 (0.60) 9. I can't avoid thinking about the person who
died
0.69 (0.53) 0.68 (0.54)
10. I feel it’s unfair that this person died 0.55 (0.69) 0.55 (0.70)
11. Things and people around me still remind me of the person who died
0.67 (0.55) 0.72 (0.49) 12. I am unable to accept the death of the person
who died
0.68 (0.54) 0.68 (0.54) 13. At times I still feel the need to cry for the
person who died
0.74 (0.45) 0.74 (0.45)
Factor correlation 0.80
The CFA model was based on bootstrapping with 1000 replications All factor loadings were significant at a level of p < 0.001