The Relationship Between
Corporate Taxation and
R&D Investments
Bachelor Thesis Within: Business Administration Number of Credits: 15 ECTS
Program of Study: Sustainable Enterprise Development Authors: Linus Brattlöf & Ida Mbenga
Tutor: Oskar Eng Jönköping June, 2021
A quantitative study of R&D expenditure in U.S. firms when subjected to reductions in
corporate taxation
Abstract
Corporate taxation is a very politicized topic, and policymakers have different perspectives on what level of corporate tax rate yields the optimal outcome for research and innovation activity. The argument is divided where one side believes that corporate taxation and R&D activity has a negative relationship, which implies that a decrease in corporate taxation yields a better outcome for firms’ R&D activity. Whilst the other side believes that there exists a positive relationship, implying that the prevailing strategy is to increase corporate taxes to further encourage R&D activity.
Therefore, the inherent purpose of this study focuses on the effect that corporate taxation has on the U.S corporate environment, whilst researching to understand the two polarized perspectives on corporate taxation and discover which perspective appears more prominent. To succeed in this regard, this study extracts internal financial information from firms located in the U.S states, by comparing the corporate tax change that the Trump administration implemented in 2018. Enabling this research study to compare firms’ R&D expenditure during the pre-tax reform (2017) with the post-tax reform (2018), indicating a firm’s differences in R&D expenditure.
The difference-in-difference method was used with a total sample size of 71 firms, which uses a control group and a treatment group to negate macro-environmental disruptions to indicate the accurate effects of the tax policy change. The results state that companies that experienced a reduction in corporate taxes raised their R&D expenditure, approximately by 11.60%. This showed that there was a very large increase in R&D activity when corporate taxation was significantly lowered, which would support the literature’s findings that suggested the existence of a negative relationship. However, the research yielded a result that would indicate that the 11.60% increase was not a statistically significant result and that further studies need to be conducted.
Keywords: Corporate taxation, R&D activity, R&D expenditure, Innovation, Tax policy,
Acknowledgements
We are grateful for all the knowledge and support made from Oskar Eng, our thesis supervisor. His wisdom and vast comprehension of research were pivotal for the success of this study. Other thanks and considerations go out to our friends that provided advantageous insights into the development of this thesis.
We thank Jönköping University for providing us with the knowledge-base and opportunity that has allowed us to grow as students.
Table of Content
1. Introduction ... 1
1.1. Problem formulation ... 1
1.2. Purpose ... 2
1.3. Research question ... 2
2. Delimitations ... 3
3. Definitions ... 3
4. Frame of Reference ... 4
4.1. Gathering scientific literature ... 4
4.2. CT’s effect on R&D, innovation, and risk-taking ... 4
4.3. CT’s effect on risk-taking in established and nascent firms ... 6
4.4. R&D credits, super tax credits, patent box regime ... 7
4.5. Tax policy effects on nascent and established firms ... 8
4.6. Fiscal policy on CT, entrepreneurship, and international R&D ... 8
4.7. Concluding remarks on the literature review... 10
5. Hypothesis Discussion ... 10
6. Methodology ... 11
6.1. Descriptive statistics ... 11
6.2. Difference-in-Difference ... 11
6.3. Additional distinction ... 12
7. Results ... 13
7.1. Data ... 13
8. Analysis ... 15
8.2. Correlation analysis ... 16
8.3. Additional implication of data collection ... 16
8.4. Sample analysis ... 17
8.5. Control and Treatment group ... 18
8.6. Compared differences ... 19
9. Discussion ... 20
9.1. Findings ... 20
9.2. Context to previous studies ... 21
9.3. Patent box regime ... 23
9.4. Validity and reliability ... 23
10. Conclusion ... 24
10.1 Official policy recommendation ... 25
10.2 Future studies ... 25
11. References ... 26
1
1. Introduction
Corporate taxation (CT) is a financial obligation where a firm needs to pay a certain percentage from business revenue in the form of taxes to which a firms’ headquarter is located in a domestic country. Taxes are a form of liabilities a firm is subjected to and carries further implications in its business performance. However, it is emphasized that corporate taxation is the specific interest of this study, and how changes to CT directly affects R&D and innovation activities. This study defines R&D activities as a firm's engagement to pursue and invest in researching and developing new products/services, or developing their existing products/services. This can often be observed by R&D budget expenditures from a firm’s internal documents. Moreover, innovation activity, as defined in this paper, is a firm’s pursuit to introduce products to the market that are either new (a quantity focus) or improving the quality of existing products in the market (a quality focus).
1.1. Problem formulation
Policymakers have aimed to create an environment where new technologies and innovations can flourish to increase the technological progression within a domestic country. The argument within this notion is that policymakers have different beliefs in what promotes such an environment with higher rates of R&D activity and levels of innovations. However, the policymakers holding these different beliefs have acknowledged that taxation is a major point that influences these aspects. The argument is that one side believes that taxation, especially corporate taxes, has a negative relationship to R&D activity and investments in innovations. This implies that lowering CT is the optimal strategy to encourage R&D and innovations. The reasoning is that firms that are able to lower their expenditure, which is impacted by taxation, will have more internal financing capabilities to invest in more R&D activities, and will also create a more competitive marketplace (McCarthy, 2017). Moreover, such capabilities will increase a firm’s R&D budgets and take on riskier product innovations to introduce to the market, which the literature review will further elaborate on.
The other side of the argument claims that CT has a positive relationship to R&D activity and innovations, which implies that the optimal strategy is increasing CT to be able to increase R&D and innovation efforts. For example, U.S treasury secretary Janet Yellen has been advocating for higher corporate tax rates in the United States as well as globally, which is the means to generate more innovation alongside economic growth in the U.S (BBC, 2021). Furthermore, Yellen notes that this tax reform is going to incentivize U.S firms to invest in research and manufacturing domestically (Rappeport, 2021). The reasoning behind this is that the increase in CT will have an increase in competitiveness, where firms need to invest more in high-quality innovation to obtain higher market shares. It arguably enforces firms to be more careful in investment approaches by focusing on technologies that are more likely to be successful. Moreover, from this increased competitiveness, it is argued that firms will increase their R&D budgets to find these innovations to thrive in the market or researching products that can reach a new customer segment. Furthermore, the literature review will inform on some other aspects that are influenced by higher levels of CT.
2
Although both sides have good intentions and supporting arguments, corporate taxation and its relationship regarding R&D/innovation activity can only have one outcome, either it has a positive or a negative relationship. However, one reason why these arguments are very active is that these notions are very politicised by the different political parties. Conservatives tend to believe that CT and R&D have a negative relationship to one another, whilst progressives believe that the relationship is positive. For example, during the Trump administration, the house of representatives successfully implemented H.R.1, which changed corporate tax rates (alongside other taxes) from 35% to a decrease of 21% (H. RES. 1, 2017). In contrast to the Biden administration that got into office in January 2021, it has been noted that there will be increases in corporate tax rates (alongside other taxes) from 21% to an increase of 28%, which is in consortium with an infrastructure bill (Politi, 2021).
1.2. Purpose
The topic of corporate tax rates is very active, and its impacts are very dispersed by the beliefs held by the different political parties. Therefore, this paper aims to understand the issue of the occurrence of different perspectives on the effects of corporate taxation. Moreover, to inform policymakers what the implications will be when introducing changes to corporate taxation, regarding R&D activity and innovation progression. This will potentially lead to this paper contributing to an added knowledge base of what happens when there are fluctuations in corporate taxes, and what its actual relationship is regarding R&D activity. However, to obtain clarification about what should be the proper response to corporate taxation, and its effect on R&D activity, we examine how corporations R&D expenditure changes when new fiscal policy is introduced. Consequently, adding to the realized relationships, supported by the literature established in this paper, that the relationship between corporate taxation and R&D activity has a predominantly negative relationship, and what its implications are on product innovations. Moreover, this paper strives towards political objectivity, where it should be noted that all data in this paper and all words written are in conjunction with both authors, where one is politically conservative and the other politically progressive.
1.3. Research question
Thus, the research question is as follows; Does corporate taxation and R&D activity have a
3
2. Delimitations
The limitations in this paper are issues of complexity, financial restraints, and time limitations. It is important to mention that the U.S tax system is very complex and has very different implications in different states and local regions. Therefore, the focus will be directed towards corporate taxation on the federal level. And the sample of firms will only come from states with similar regional state policies that are bordering each other. This is because the difference-in-difference1 approach will help negate macro-environmental events/disruptions, as neighbouring states will see similar effects to their market implications. Furthermore, as there will be a large financial constraint and time limit in this study, the sample size will only consist of 71 firms in total. This will have the implication of samples not being randomly selected, the human error of this research is that the authors could subconsciously have a bias when choosing which firms to analyse their R&D expenditure. This implies that the process of unintentionally including and excluding certain firms’ R&D expenditure is a form of limitation that is to be addressed. Additionally, the firms selected will only be private enterprises, meaning that the public sector is excluded, as well as firms that are in the financial sector, meaning stockbrokers etc. This is because the public sector may receive funding from the government and that the finance sector is not involved in manufacturing products. The quantitative analysis of R&D budget expenditure will also be collected using the difference-in-difference approach, it will be able to provide a numerical number that will indicate the effect on a monetary basis. This engagement will help build trustworthiness to the R&D activities, but as noted, will not help with the analysis of innovation activity.
3. Definitions
R&D tax credits are a form of tax relief provided for the company that is involved in
innovations and product development. The R&D credits act as a form of compensation, where the company is rewarded with less tax liability, as governments have the aim to create an incentive for firms to engage in innovation, which comes in the form of companies having the ability to direct more money to their R&D budget.
Patents are a form of intellectual property that an inventor issues to a trademark office. This
ensures that the inventor protects their assets from copyright infringement, where this protection is granted for a specific time frame.
Entrepreneurial activity is the involvement of creating and recognizing potential business
opportunities, within an organisation. It is the activity of continuously exploring business opportunities, with the intent to seek a competitive advantage for a firm’s product or service or within a market.
1The difference-in-difference method is used when comparing when one group has been exposed to a treatment, whereas the other group is unaffected. The difference-in-difference approach is applicable when analysing two different groups and two different points in time. (Schwerdt & Woessmann, 2020).
4
4. Frame of Reference
To support the aforementioned arguments regarding the relationship between CT and R&D activity, the presented literature introduced in this section will provide further information. This empirical literature will be the foundation for the theoretical framework, where we build on previous research which will help contribute to the optimal fiscal policy a domestic country could pursue.
4.1. Gathering scientific literature
The first step in the literature review was to understand the scientific consensus that previous researchers had established and examined before us. This would help provide the necessary information for us to understand what and how data have been collected in other scientific journals, and to further underline where the gaps were in the scientific community. To ensure that this scientific literature was appropriate, all articles in the literature review were collected and chosen from an established criterion. The literature had to derive from Primo, which is the library platform for Jönköping University. In this platform, all literature must have been peer-reviewed journals, where no articles were older than 2011, to ensure that articles are relevant when conducting this study. Furthermore, these articles were collected using these specific search terms: “corporate taxes” in combination with; “R&D”, “innovation”, and “entrepreneurship”. Which respectively resulted in 24,523 articles (with R&D as search term), 96,484 articles (with innovation as search term), and 38,788 articles (with entrepreneurship as search term). Where 13 numbers of peer-reviewed journals were collected.
4.2. CT’s effect on R&D, innovation, and risk-taking
Ljungqvist, Zhang, and Zuo (2017), and Mukherjee, Singh, and Žaldokas (2017) determined with significant data collection and analyses, that when CT is increased there is a significant reduction in the activity and expenditure in R&D. Where Ljungqvist et al. (2017) found additional insight in their article about how corporate taxations affect corporate risk-taking, by observing 64,447 firms. These findings suggest that when there is a 1% increase in taxation, it results in a 2.4% reduction in risk-taking. Additionally, it was found that when home-state taxes increase by 136 basis points, it results in an average reduction of 2.6% in corporate risk-taking. This means that corporate risk-taking is sensitive to changes in taxation, although the authors emphasize that the relationship between corporate taxes and corporate risk-taking is asymmetrical. Where Ljungqvist et al. (2017) informs that policy-makers only stand to gain tax revenue when corporations are successful in R&D projects, whilst having nothing to lose if the projects fail. This means that the reward for introducing a risky product that is unknown to be profitable or not carries less value, as the risk is still the same with less reward. Leading to all aforementioned authors to support the conclusion that firms will choose to reduce risk through investing in safer R&D projects, as the possibility to make further profits have been diminished. Moreover, it was also found that the R&D activity left in companies had a different approach. The change was that companies started reducing the focus in researching new products, and rather prioritized research on their existing products that are already in the market. This change indicates that businesses stop investing in new products (quantity) and rather focus on the features of their existing products (quality), as the firm’s internal financing capabilities are significantly reduced from the increased taxation.
5
However, when taxation was lowered, it was seen that the quantity of new products was significantly increased. This again is impacted by the risks and rewards involved with introducing new products, and since taxation is lowered, the reward for risky innovation is much higher. Ljungqvist et al. (2017), and Mukherjee et al. (2017) noted that when decreases in taxation are very low, there is not as much change in R&D expenditure. This is because low tax cuts do not have a significant effect that impacts the businesses decision to increase the R&D expenditure to a level that would be considered statistically significant. Moreover, businesses have experienced slight tax reductions often being removed when governments need more revenue. Thus, businesses have no reason to believe that tax reductions will be implemented in the long-term and will rather not bother changing their R&D budget to a significant degree. Nevertheless, both articles conclude that CT and its impact on R&D has a negative relationship, where it is more evident that increases in CT have a much higher impact on R&D than reductions in CT.
Darnihamedani, Block, Hessel and Simonyan (2018) also investigated the effects of corporate taxation and its impact on innovative entrepreneurship. Where they analysed a dataset of 632,116 participants, including 43,223 entrepreneurs, using cross-sectional and longitudinal regressions. The authors’ findings indicate that a 10% decrease in a country’s corporate tax rate results in approximately an increase of 6% in innovative entrepreneurship, indicating a negative relationship between CT and innovative entrepreneurship. Furthermore, Darnihamedani et al. (2018) argue that an entrepreneur’s willingness to innovate and invest in new R&D efforts are largely tied to the rewards it will receive. Such rewards are noted as the prize-effects and are directly impacted by CT; therefore, the authors inform that the lower the corporate taxation is, the bigger the prize-effect is. Moreover, Bruce, Gurley-Calvez, and Norwood (2020) also indicate in their findings that when a participatory survey in the U.S was conducted, it showed prominence to suggest that the relationship between entrepreneurial activity and corporate taxation has a positive relationship. However, the evidentiary founding of this one study could arguably be considered an aberration, as Bruce et al. (2020) note that far more studies in international as well as domestic settings concluded the existence of a negative relationship. Therefore, it can be argued that Bruce et al. (2020) found evidence for the existence of a negative relationship, with slight suggestions showing the existence of a positive relationship.
6
4.3. CT’s effect on risk-taking in established and nascent firms
Wasiluk and Białek-Jaworska (2020) research paper aim to investigate the relationship between R&D expenditure and tax burden, between two European countries France and Germany. The reasoning behind choosing France and Germany is due to the countries being one of the top-ranked OECD countries, in terms of innovation success. However, arguing that these countries achieve their innovation progress differently, where the tax policy in France takes the approach to focus on cutting the income taxes and implementing R&D tax credits and tax benefits. Whereas the strategy of Germany is to offer subsidies and non-refundable grants. Despite their difference in tax policy strategy, the authors argue that both countries have the aim to motivate firms to invest more in R&D expenditures, by making the circumstances around investing in R&D to be more accessible. The author continues to claim that more investments towards R&D activity come with more risk, as a company that invests in new research will have an unknown rate of success if implemented into the market, hence risk is inevitable. This puts more emphasis on the fact that having reliance and financial support from the government is essential, as its support and encouragement lead to firms taking upon riskier and additional R&D projects. Thus, this finding correlates with Dewit and Leehy (2020), as they agreed that less internal financing capabilities are especially not beneficial for firms in their first stages of the life cycle. Based on the empirical literature, Wasiluk and Bialek-Jaworksa (2020) conducted a study on Taiwanese manufacturing firms, which states that R&D intensity (measured as total R&D expenditure to turnover ratio) is more subjected to firms with more internal financing capabilities. Meaning that the more tax relief, the more it leads to an increase in R&D intensity. Additionally, the authors found that the strategy of direct support from the government, such as applied grants that decrease the tax burden, which leads to an increase in R&D expenditure as a result of more internal financing capabilities. Meanwhile, the results from the paper state that these capabilities vary depending on if the firm is nascent or established. Established firms have a better opportunity to obtain external funding whereas it would be more challenging for nascent firms. Leading to another finding from the research where Wasiluk and Bialek-Jaworksa (2020) agree that firms with more liquidity have a better ability to invest more in R&D spending. In addition to that, the author’s argued that nascent firms have another form of competitiveness, as they are new entrepreneurs who are more agile and adaptable towards implementing new strategies which will yield them a significant opportunity for business growth. Notably, Wasiluk and Białek-Jaworska (2020) conclude that governmental support, such as tax relief, will act as a tool that creates an incentive for firms to invest more in R&D activity, where the success of this instrument lays on the level of tax burden being lowered for the firms.
7
4.4. R&D credits, super tax credits, patent box regime
Another finding in the literature comes from Makeeva, Murashkina, and Milkhaleva (2019) where it was shown how certain fiscal tax incentive policies affect R&D expenditure. The result indicated that R&D tax credits had a marginal effect to a certain degree, as too favourable incentives start increasing the level of exploitation by companies to over abuse the incentive. Moreover, super tax credits, which provide enormous exemptions to tax, were indicated to almost always be exploited as it is far too favourable. However, Makeeva et al. (2019), and Gao, Yang, and Zhang (2016) showed that a patent box regime was very successful in its efforts to reward innovative products. A patent box regime lowers the corporate taxes obtained from the specific revenue that the innovative product generates. With exception of the super tax credit, it was shown that there was statistically significant evidence to indicate that CT and R&D has a negative relationship with each other.
Gao et al. (2016) continue by also suggesting that a patent box regime is a more efficient metric, as it incorporates measuring the R&D research success by the amount of patent citation. The authors discover that when a patent box regime is implemented, the quantity of innovations is increased, which compliments the findings by Ljungqvist et al. (2017), and Mukherjee et al. (2017). Furthermore, Gao et al. (2016) found in their data sample that firms situated in U.S states are more prone to tax avoidance when incentives are tax credits. This again confirms Makeeva et al. (2017) statement that tax credits could lead to tax avoidance if the rewards are too favourable. However, Gao et al. (2016) does not clarify at what specific point the tax credit starts having a negative effect. It was also discovered that when firms have less internal financing capabilities, then firms start focusing on safer innovations, which often indicate a focus on the quality of existing products. Nevertheless, Gao et al. (2016) discover that when corporate taxation is lowered on specific R&D innovations, then firms also start investing more in R&D activities, which also indicate the existence of CT and R&D having a negative relationship.
The previously discussed empirical literature focuses on analysing how effective tax instruments are to enhance R&D activity. However, Ernst, Richter, and Riedel’s (2014) research paper take a different approach by investigating the effect R&D tax incentives have on the quality of R&D projects. In their paper, quality is measured as the profitability and the project’s degree of innovation, in which the author’s claims the existence of a positive relationship between project profitability and innovation. Ernst et al. (2014) extracted data from the European Patent Office (EPO) between the years 1995-2007, as well as from the PATSTAT database. From the database, “profitability” is measured by incorporating the factors; the number of patent citations, number of countries, and industries the patents are being filed. This finding suggests that decreasing the patent income tax by 10% increases the patent quality by 1-5%. This would suggest the existence of a negative relationship between CT and R&D. However, the authors note that when tax allowances and R&D tax credits are too favourable, it starts decreasing the quality of R&D projects. That is why the authors advise policy-makers who have the intent to increase R&D project quality for enterprises, to look into decreasing patent income tax rate. As it was noted that R&D tax credits and tax allowances showed to be insufficient ways to encourage R&D.
8
4.5. Tax policy effects on nascent and established firms
Bruce, Liu, and Murray (2015) tackle the argument that an increase in corporate taxation leads to higher rates of competitiveness, which was the argument presented in favour of higher taxation. The authors inform that nascent firms are more liable to the increased taxation, which reduces their investment capabilities. This means that larger firms are less affected by the tax than the nascent firms, which negates the argument that companies will seek to grab more market shares through newer innovations introduced to the market. As large firms can drive out nascent firms, there is no need to invest in new technologies, as more market share is available. Interestingly, Bruce et al. (2015) discovered that individual state tax policies do not play a significant effect on entrepreneurial activity, as there was no statistically significant evidence to suggest such beliefs.
According to Baliamoune-Lutz (2015), a firm’s reaction towards changes in taxation is quite varying depending on if a firm is an established one, or if it is a nascent firm. More specifically, Baliamoune-Lutz examined the entrepreneurial effects tax implications imposes on such firms, analysing how entrepreneurial activity is diminished when taxes are increased. It was found that both types of firms are negatively subjected to increases in taxation, where it is found that established firms have a much higher impact on their entrepreneurial capacity. Interestingly, it was found that nascent firms were found to also be subjected to the tax implication but were more agile in their operations to negate proportions of the penalties to their entrepreneurial capacity. This meant that nascent firms are in a strategically stronger position to endure the impacts that excess taxation is imposed on their business and their ability to entrepreneurial activity. This arguably imposes limitations on the importance of internal financing capabilities, as it is found by Baliamoune-Lutz that nascent firms are more flexible and adaptable to change their operating procedures to survive changing circumstances in the market. This argument suggests that although all firms will be negatively subjected to the tax implications, nascent firms will have fewer implications towards their ability to innovate their products/services than the established firms are limited to. Which counter argues the claims made by Bruce et al. (2015), who claims that established firms are less subjected to financial constraints than nascent firms.
4.6. Fiscal policy on CT, entrepreneurship, and international R&D
Gao et al. (2016) examine the impacts of tax credit and tax allowances regarding R&D activity and investments in firms. Accordingly, it is argued that tax credits and tax allowances are great fiscal policies to stimulate higher levels of R&D investments, at least from conducted net present value (NPV) analyses when such policies are implemented. This suggests that reductions in the tax owed from firms increase the levels of R&D activity, which would suggest a negative relationship. Notably however, Gao et al. (2016) argue that when increasing the overall corporate tax rates, the amount of tax credits and allowances allowed is increased. This suggests that corporate tax rates should be increased to allow such tax credits and allowances to flourish, as certain OECD countries with such systems have seen R&D and innovation successes with such a strategy.
9
Montmartin and Herrera (2015) argue about the correct support that the government should invest in, in terms of incentivizing R&D activity. The authors find two claims that encourage such activities, direct support (governmental subsidies), and indirect support (tax incentives). However, it is emphasised by the authors that direct support is more efficient for firms to engage in R&D activities, as the firms get funding to cover the upfront cost of R&D projects, which lowers the risk for the firm. Importantly, the authors also inform that indirect support has not been measured on the same level as direct support, because the measurement of indirect support has been difficult to quantify. For context, $1 lost in tax revenue has an unknown effect on $X invested in R&D, which is why the authors are conducting the study to see its effects.
When Montmartin and Herrera (2015) conducts their descriptive statistics, where they examine the long-run effects of direct support and indirect support, they find an interesting discovery. It is shown that when there is a 1% increase in direct support, it leads firms to decrease R&D intensity by 0.08%. In contrast, it was found that when taxes were reduced by 1% (indirect support), it led firms to increase R&D intensity by 0.35%, which would indicate that indirect support is a better alternative for increasing R&D activity. However, what the authors note is that when a neighbouring country engages in indirect support, it hurts a domestic country’s R&D activity. Therefore, the policies a domestic country engages in will have a significant impact on foreign countries R&D activity, which implies that indirect support can have a significant impact to hurt global R&D capabilities. This finding provides an interesting crowding-out effect when suggesting fiscal policy solutions to encourage R&D activity. Nam (2011) also investigated the effects of direct vs. indirect support, where it also concluded that indirect support was more efficient, whilst also recognising the implications it has on the international effects on R&D intensity. Moreover, Nam continues to examine the effects that the indirect support has on the international scale, where it is discovered that OECD countries are not at their optimal corporate tax base. It was calculated using various NPV models that the optimal corporate tax rate is actually at 55%, and that the CT equilibrium rate should be increased from the OECD average. However, Nam informs that this is resulting from OECD countries having a “tax cut competition” between each other. Where theoretically, a global corporate tax rate could help negate the international implications that the individual tax rates are causing on R&D intensity. This would arguably support the claims made by U.S treasury secretary Janet Yellen’s plan to try and implement a global increased corporate tax rate which would increase R&D activity (BBC, 2021).
According to Dewit and Leehy (2020), the optimal fiscal policy for retaining R&D investments and minimizing the level of company offshoring involves creating a favourable business environment. Furthermore, it is argued that increases in CT and R&D subsidies should never coexist, as reducing internal financing capabilities motivates firms to start engaging in tax havens, which is in accordance with Montmartin and Herrera (2015). Additionally, reductions in CT are far more favourable to retain companies in your country, as well as maintaining R&D innovations in the domestic country. However, the authors argue that CT should match the level of the offshoring country, which can be unrealistic depending on the foreign country’s CT level. Nonetheless, Dewit and Leehy (2020) still argue that CT and R&D has a negative relationship, as lower levels of taxation stimulate the level of R&D activity.
10
4.7. Concluding remarks on the literature review
The presented literature has provided several insights on the discussion about corporate taxations and its effect on R&D activity. There appears to be a large consensus of the literature which agrees that when CT is increased the R&D activity is reduced, which indicates a negative relationship. It was also seen that when CT was lowered, companies focused on increasing the quantity of new R&D projects. Additionally, a few articles concluded that when CT is lowered, firms tend to increase their level of risk-taking, whilst vice-versa when CT is increased. There appears to be a dispute regarding the abilities of nascent and established firms, where some articles claim that established firms are more capable of R&D activity through their financial strength. Whilst it is recognised that nascent firms are more adaptable to change their operating procedures, which ensures their capabilities to continue investing in R&D.
Moreover, several findings have agreed that indirect support generates the most efficient results. Although, it was also recognised that when countries lower their corporate taxes it has a severe effect on the international R&D intensity and tax revenue. Where countries compete to attain the lowest corporate tax rate, in the hopes of obtaining large firms to their country. Not only does such competition negate foreign R&D activity, but creates an endless cycle of competition between countries, which arguably implies the limitations of the effects of changing corporate tax rates. Therefore, it was an optimistic finding to see that the patent box regime (taxation on individual patents) seemed quite successful, as lowering it appears to encourage R&D, whilst not aggravating foreign countries to compete in CT levels.
5. Hypothesis Discussion
Based on the previously stated literature and its inherent arguments, we have affirmed the following hypothesis. If firms are exposed to a reduction in corporate tax rates, then it is expected that firms’ R&D expenditure will increase. Whilst exposed to an increase in corporate tax rates, it is expected that firms R&D expenditure will decrease. This would proclaim that corporate taxation and its relationship towards R&D expenditure has a negative relationship. Although the authors recognise that the patent box regime seems the most prominent, the study will only investigate the relationship between the two variables. Where the independent variable is corporate tax rates, and the dependent variable is R&D expenditure. This is done to either accept or reject the null hypothesis at a 95% confidence level, where these are the following hypotheses.
The null hypothesis in this study states that there is no relationship between corporate tax rates and a firm’s R&D expenditure. Indicating that when there is a change in corporate tax rates it will not indicate a change in R&D expenditure. Thus giving the following null hypothesis; H0: ΔCorporate tax rates ≠ ΔR&D expenditure.
The alternative hypothesis in this study states that there is a relationship between corporate tax rates and firms’ R&D expenditure. Indicating that when there are changes in corporate tax rates it will have an effect on the R&D expenditure. Thus, giving the following alternative hypothesis;
11
6. Methodology
6.1. Descriptive statistics
After the literature review was finalized and our hypothesis was established, it was time to marshal data to evaluate our hypothesis and answer our research question. However, we needed to decide how we would conduct the descriptive statistics before gathering data. Interestingly, when reading Bruce, Gurley-Calvez, and Norwood (2020), it was recommended that future studies that are examining the effects between corporate taxation and its relationship towards innovation, entrepreneurship, and R&D should apply a regression with a discontinuity design, or a difference-in-difference approach. The difference-in-difference regression seemed the most attributable and most applicable to help provide us with the descriptive statistic needed to answer our research question. Furthermore, it was also feasible given the time limitations and financial constraints that this study is exposed to. Therefore, the research method used in this study also came with recommendations from previous literature, which suggested that it might bring further insight into this topic. Which served as the inspirational standpoint to help determine an effective research approach that would add value to the research topic.
To measure the effects of what happens when corporate taxation is altered, we will have to obtain data of R&D expenditure from firms located in the United States. The method is to procure internal finance information regarding firms’ R&D expenditure, specifically between the corporate tax change that the Trump administration changed in H.R.1 in 2017 (H. RES. 1, 2017). This will enable the measurement of what a firms’ R&D expenditure was before the tax change (2017), and then compare it with how it was after the tax change (2018). By using a difference-in-difference regression approach, it will enable the data collection from being distorted by macro-environmental events/disruptions and show what the effects were from the fiscal policy change.
Moreover, as the data collection will be procured from U.S firms in the same state or in bordering states with similar state and local tax policies, we can minimize the level of distortion that happens by regional state/local policies that affect firms. This will ensure that state policies are not fundamentally different to one another, for example, states like Florida and Georgia are geographically close and governed in a similar fashion. For illustration, if a hurricane were to impact Florida, then Georgia would see similar effects to market disruptions given their close distance to each other, which ensures that changes in firms are similarly impacted by environmental disruptions across state lines. Therefore, data collection points will be procured from firms located in or near the state of Florida.
6.2. Difference-in-Difference
The process that was explained in the previous segment will be applied to the treatment group for our difference-in-difference regression, where again gathering firm data from the year 2017 (pre-tax reform) and 2018 (post-tax reform), which will indicate a firm’s difference in R&D expenditure. However, it would be absurd to claim that all the difference in R&D expenditure is resulting from the tax reform, as factors such as economic growth, market regulations, lawsuits etc. could have impacted firms’ R&D budgets. Therefore, when conducting difference-in-difference regressions, researchers need to apply a control group to account for cross-sectional differences. Where this control group is not affected by the policy implication, which
12
shows what would have happened if no tax policy were introduced for our treatment group, ceteris paribus. This is because the macro-environmental effects would have happened to both cases regardless of the tax policy, which means that we can use a control group’s R&D expenditure to negate the effects the treatment group possesses. For example, if the treatment group had a 12% increase in R&D expenditure, and the control group had a 10% increase, we can account for the cross-sectional difference and see the actual effects the tax policy had. Which in this example would be a 2% (12% - 10%) increase in R&D expenditure. Therefore, fiscal agencies, governmental institutions, and actors such as the EU widely apply difference-in-difference regression to measure the effects of their policy enactments.
However, as this study is examining the effects of corporate taxation, we will need to use a control group that did not see the effects of changes in corporate taxes. Gathering such a control group might arguably be unconventional in this study, as the control group firms are going to be companies who had an effective tax rate of 0% during 2017 & 2018, who have been widely reported on (Pound, 2019). The reasoning behind choosing a control group with an effective tax rate of 0% is that firms in such groups are applying tax exemptions to lower their overall taxes, which is a legal practice that is commonly used in large firms. This is because we cannot find firms who evaded their taxes illegally, as no reasonable firm would advertise that they are committing tax evasion, as they would most likely be arrested. Therefore, firms who use tax avoidance (legal loophole)2 can be applied in our study and will act as the control group, which accounts for the cross-sectional difference with our treatment group. Importantly, this study assumes that our treatment group is not applying any tax avoidance in their business practice, as the authors do not have the financial resources, nor time to make such an audit.
After the data collection has been finalized, we will use the SPSS software provided by Jönköping University to conduct our descriptive statistics. Where this software will be the final stage needed for us to finalize the quantitative process in this study. After which we can interpret the statistics and conclude the remarks found, which will help answer the research question previously established.
6.3. Additional distinction
It is important to note that this study will only undertake the fiscal policy change of H.R.1, as the Biden administration has yet to vote and fully underline their tax policy initiative, as it is made in conjunction with an infrastructure bill that has yet to be introduced to congress. In Layman’s terms, this study analyses the impact of Trump’s corporate tax rate reduction from 35% to 21% that was implemented into practice on January 1, 2018 (H. RES. 1, 2017). As it is still a tax reduction, it will still show if the impact to R&D/innovation activity had a negative impact or a positive impact, which still indicates the relationship between these factors.
2Tax avoidance is the practice of using certain tax exemptions set by a domestic country, it is a legal practice that allows firms
and individuals to negate a portion of their taxes. It is important to mention that tax avoidance should not be confused with tax evasion, as tax evasion is illegal, whilst tax avoidance is perfectly legal (Murray, 2020).
13
7. Results
Although the established literature provided good arguments for a lot of aspects regarding R&D and its relation to CT, it is now time to test these theories by conducting the previously mentioned descriptive statistics, then analyse the results found in them. However, here are some important notes needed to be mentioned. The process of obtaining financing information of firms R&D expenditure consisted of strategically overviewing approximately 650 companies from the state of Florida and Georgia. This was conducted by searching for private companies on the search site Google, and then finding firms’ consolidated income statements to then combine all the collected data to perform a difference-in-difference method in SPSS.
For the control group, there was an examination of approximately 150 companies, which resulted in the final sample size being 31 companies. This indicates that the sample is large enough to warrant the classification of being normally distributed (LaMorte, 2016). For the treatment group, we examined approximately 500 companies, which resulted in a total of 40 companies for its sample size, see Table 1 in the appendix. The reason for the sample size being relatively small is that a large number of firms kept their R&D expenditure confidential. Moreover, the limitations of excluding public and financial firms, as well as considering the time and resource constraint, resulted in those specific sample sizes.
7.1. Data
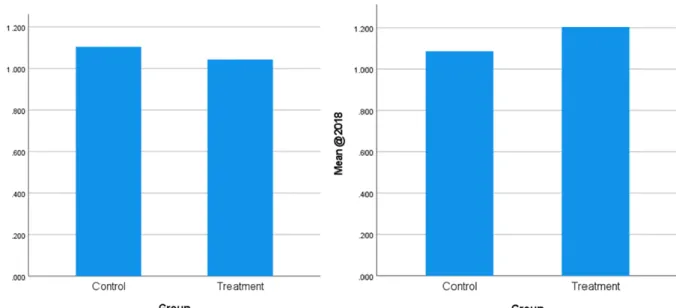
To conduct the mean value between the control group and the treatment group, an independent samples T-test at a 95% confidence interval was performed. It showed that after the H.R.1 policy change, the average increase of R&D expenditure for the control group was approximately 8.83%, whilst an increase of approximately 20.4% for the treatment group, see Table 2. This would indicate that the policy effects for H.R.1 led to an average R&D increase of approximately 11.6% (20.4% minus 8.83%) for businesses, see Figure 1.
Importantly however, the independent samples T-test also indicated that the variances between our two test scores. Where it indicated that the variances in differences were not statistically significant enough to suggest their correlations to be different, more precisely at a 23.5% correlation, see Table 3. Furthermore, as observed in this table, the significance value of 0.211 of this test means that the p-value > 0.05, which also indicates that the results are not statistically significant at a 95% confidence interval. Meaning the test fails to reject the null hypothesis and inherently implies that our test cannot suggest that a change in corporate tax rates has a statistically significant impact on changes in R&D expenditure.
14
Table 2. Independent Samples T-Test, Including Group Statistics.
Note. From IBM SPSS Statistics Viewer.
Note. From IBM SPSS Statistics Viewer.
Figure 1. Graphical Illustration of the Independent Samples T-Test.
Note. From IBM SPSS Statistics Viewer.
15
8. Analysis
8.1. Analysis of main findings
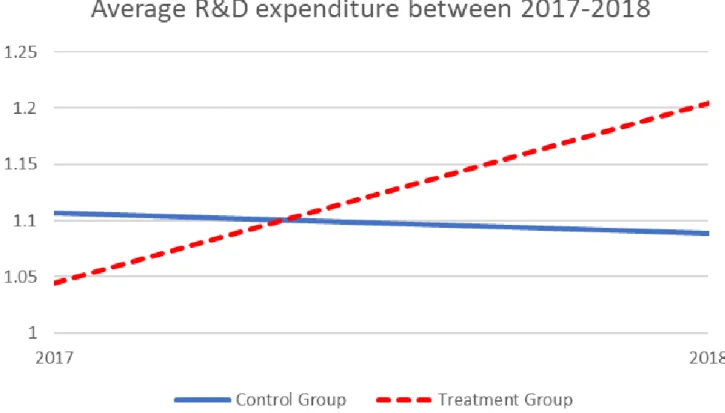
The main objective of this thesis paper was to understand the different perspectives on the effect the independent variable (corporate taxation) has on the dependent variable (R&D expenditure). As mentioned throughout the text, there exist opposing views between the political parties on the matter of how firms will react when corporate taxation is either lowered or increased. The main finding from the results can be seen in Figure 2, which shows that the blue line represents the control group, and the red/striped line represents the treatment group. The graphs tell us that the control group who has a 0% effective federal tax rate to the government was not sensitive to the policy change, as their level of R&D expenditure had an insignificant decline, after the policy change. Whereas the treatment group, who were liable to the regular federal tax rate, was significantly sensitive to the policy change (2018), as shown by a significant increase of investment towards their R&D expenditure. Expanding in these areas is the main purpose of this analysis part, where a discussion of potential implications in the data and what could have affected the results if things were performed differently.
Figure 2. Graphical Illustration of Different R&D expenditure means for control & treatment
group, years 2017-2018.
16
8.2. Correlation analysis
Another interesting remark found when conducting the descriptive statistics was within the correlations between the control group and the treatment group, see Table 3. As can be noted during 2017 which tested the mean R&D expenditure for both groups before any tax policy had been implemented. What should be expected before the H.R.1 policy is that both groups maintain a high correlation to each other, which is arguably true in this case as the correlation between the treatment and control group provided a value of 0.784 or 78.4%, see Table 3. An indication of 78.4% correlation is a high number when conducting a Levene’s test, which indicates that for 2017 both groups were quite similar. However, as was mentioned during the data section, the correlation between the two groups had a correlation of 23.5% after the tax policy changed in 2018. In plainer words, during 2017 the correlation was 78.4%, but after the treatment group was exposed to the fiscal policy, it got reduced to 23.5% during 2018. Furthermore, as the data retrieval was designed to target firms in Florida and Georgia to minimize the level of distortion, it still had a significant impact of changing the correlation. What is being argued here is that this study took a lot of steps to minimize the level of distortion and yet yielded a significant reduction of 54.9% (78.4% – 23.5%).
This means that the treatment group had a significant impact on its correlation to the control group, meaning the fiscal policy significantly impacted the treatment group. However, even though it had a significant impact it is paramount to repeat that the impact is not high enough to be considered statistically significant to reject the null hypothesis, but only an interesting interpretation that can be made of the impact the fiscal policy had on both groups between the years of 2017-2018. Although the findings were not statistically significant, the big reduction between 2017-2018 could indicate a sampling error when the data collection proceeded. As the assumption was made that none of the companies in the treatment group was utilizing tax avoidance strategies and that all the control group companies had an effective tax rate of 0%. However, these assumptions could have been wrong for an undetermined number of samples used in the statistics, as determining these factors would be beyond the financial capabilities and available resources for the authors to confirm. Meaning if another organization with such capabilities, or if another study conducted the same test with a sample including different companies, then it could lead to another finding in the statistics, which could be useful in future studies.
8.3. Additional implication of data collection
What could have interfered with the results might have been how firms were chosen when extracting data. Where several large technological and manufacturing firms were unintentionally chosen for the basis of the data collection. This might have some implications, as technology and manufacturing firms are commonly leading industries with high priority regarding R&D investments. The results might have been altered if small-medium firms from different types of industries would have been chosen, this would have portrayed a broader representation of the firms’ different levels and prioritization of their innovation activity.
17
In addition to the above-mentioned point, what could have been done differently when conducting the data collection, is to only focus on one specific industry. This could have ensured an in-depth understanding of how an entire industry reacts to a fluctuation of the tax policy. Taking the aforementioned approach would require more time and research to fully concentrate on one specific industry, for instance only researching the technological industry or medical industry as well as taking into account both small-medium firms and larger corporations. Such a constructed study would have arguably provided a more significant indicator than the original study had, as it would again minimize the level of distortion that happens in different industries.
8.4. Sample analysis
Another point that should be pointed out is regarding the sample sizes. Most large corporations were chosen for the control group such as Netflix, General Motors & Amazon where their R&D expenditure is significantly larger than most firms. Moreover, choosing larger firms such as those mentioned, is due to that they were reported to have a 0% effective tax rate, this requires the ability to take upon legal tax loopholes, which is significantly more difficult for small and nascent firms to do. Additionally, the people who investigate firms’ effective tax rates are far more interested in large firms, as their impacts are far greater and more interesting for investigators to discover and inform the public about. Which would explain why the control group sample contained a majority proportion of large firms.
When taking upon a critical viewpoint on this matter, large firms are more likely to invest much more in their R&D expenditure, as they are leading front organizations who have to keep up their competitiveness and be resilient for macro-environmental trends3. Having large firms could also create implications in the data collection phase, as it creates more deviation of innovation activity level from the other chosen firms. Moreover, as only the two states of Florida and Georgia were chosen for the treatment group, there is a potential implication in the data collection where the authors argued in the text that the reason for choosing two states in or near the area of Florida would ensure that the states around Florida would have similar state policies. Therefore, an occurrence happening in Florida would for instance be felt similar in Georgia, however, this can be critically discussed as the authors may be wrong in this assumption. Moreover, it is inevitable to disregard the macro-environmental uncertainty that comes with a new changing presidential administration. This fact is essential to account for, as this could arguably affect the economic environment. In other words, these unknown uncertainties could imply a firm's decision-making on their R&D expenditure during 2018, leading to the possible implication of the result of this thesis.
3The occurrence of macro-environmental factors that can impact organisations includes, changes in the political environment
such as changes in laws, legislations, and governmental events. The economic factors are those that concerns inflations, fluctuations in GDP rates. Additionally, that the technological factors such as the creation of new inventions. All these are some of the macro-environmental factors that have the ability to impact organisations, as it can create uncertainties. (Corporate Finance Institute, n.d.).
18
In essence, it is important to keep in mind external effects such as changes in economic growth, political uncertainty, market regulations, and that lawsuits can influence firms’ decisions on their R&D budget. Therefore, Florida and Georgia are indeed different states, with somehow different local governance, as well as different amounts of specialized companies within the states. For instance, Florida is more surrounded by water and has its main industries within tech companies such as aerospace, life science, and others like agriculture and tourism (Litwin, 2017; Leone, 2015). Whereas Georgia is leading in the area of manufacturing, agriculture, energy, and tourism industries (Wozny, 2015). What should be extracted from this is that all states have differences in their competitive advantage, culture, and environment which is important to argue for both their potential differences and similarities when choosing the U.S states to include in the data collection.
In addition to the data collection of the treatment group, a total of 40 firms were chosen for the sample size, and out of that amount, exactly 20 firms from Florida and 20 firms from Georgia were chosen, which indicates a fair representation of firms extracted from the two states. Moreover, an important occurrence in the data collection could potentially interrupt the method. During the extraction of the data collection as well as the time and resource constraint of the authors, the sample size of the control group consists of 31 firms. The reason for this is due to some firms having their R&D expenditure confidential for the public, although, despite this challenge, the authors did go through approximately 150 firms. This indication results in a non-identical level of sample size between the control group and the treatment group, where the treatment group has a sample size of 40. This challenge should be recognized as it could have potentially interrupted the results of the thesis, due to uneven representation, whereas if the sample size was much larger and consisted of an even amount of representation, the result could have yielded an alternative conclusion.
8.5. Control and Treatment group
The purpose of this thesis is to understand the issues of the different perspectives on the effect of corporate taxation. Which has been successfully constructed, as during the frame of reference the authors found that there do exist different viewpoints on how firms react to fluctuations of corporate taxation. For instance, U.S treasury secretary Janet Yellen advocates for a global increase in corporate taxation, where she argues that it would provide increased innovation activity and economic growth, as firms invest more heavily in research (BBC, 2021; Rappeport, 2021). Whereas the viewpoints obtained by house minority leader Kevin McCarthy (2017) argues for lowering corporate taxation, for the reason being that firms can lower their expenditure. Resulting in more financing capabilities where they can internalize the saved money and thus invest more in R&D activities.
19
However, despite the different perspectives on if lowering or increasing corporate taxation is more effective, the result from this thesis shows an insignificant degree of evidence to indicate that there exists a negative relationship between R&D expenditure and corporate taxation. Although what is shown in Figure 2, is that the control group invested less in their R&D budget when the tax rate decreased, compared to the years before and after the policy change, and the treatment group invested more in their R&D budget when the tax rate decreased. This might depend on the fact that the treatment group reacted the way McCarthy (2017) predicted, meaning more internal financing capabilities gives room for an increased R&D budget. However, this phenomenon does not correlate with the reaction of the control group as with decreased tax rate they invested less in their R&D budget.
This goes against the assumption made in this thesis, although what can be speculated for this occurrence is that the control group who pay 0% effective tax rate then has more space for their large R&D budget, and thus the tax rate fluctuation would not affect them. However, what is seen in Figure 2, indicates that the control group experienced a slight decrease in their R&D investment compared to the years before and after the tax policy, which is a large difference compared to the treatment group as their R&D investments increased significantly. Perhaps it lays the ground for the fact that external macro-environmental trends, economic growth, or uncertainties with a new presidential administration made the control group decrease their R&D budget and choose to move money from their R&D budget to other parts of the organization, which could be one of the justifications of the result shown in Figure 2.
8.6. Compared differences
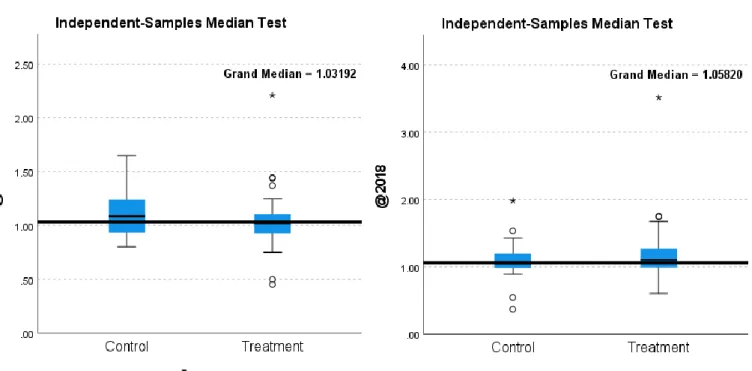
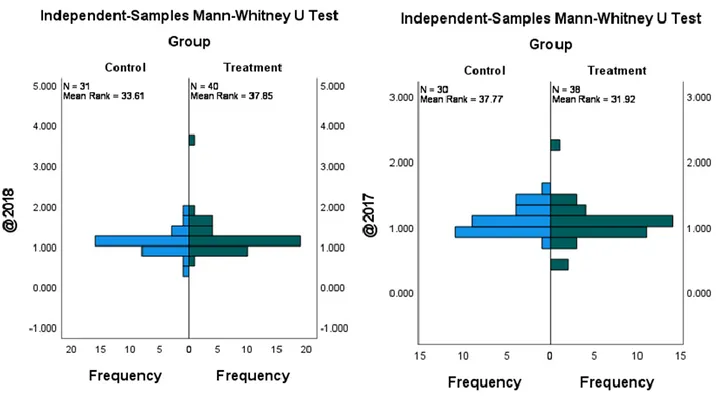
What seemed appropriate to conduct concerning the statistical results presented in the data section was an independent samples Mann-Whitney U Test, which is going to be presented graphically. The point of this test is going to be able to visually analyse the difference in the two groups in the years of 2017-2018, which will help to visually show the shapes of the groups and help identify possible outliers, and possible skewness. What is observed when looking at the Mann-Whitney Tests, see Figure 3 in the appendix, is that the groups are almost identifiable in their shapes, with exception to certain outliers, which have been identified as Veru Inc. during 2018, and during 2017 World Fuel Services and Mohawk Industries were identified as possible outliers. Additionally, to ensure that no other outliers are effectively nullifying the original data results, an independent sample median test is performed in SPSS. What can be observed in the hypothesis test summary is that the medians for both 2017 and 2018 are the same across categorical groups, see Table 4 in the appendix. Additionally, Figure 4 visually represents the outliers and each categorical group's median placement in the figure, see Figure 4. What is confirmed in this performed test is that even when the outliers are negated from the test the null hypothesis is still retained.
20
9. Discussion
The purpose of this study was to contribute to an added knowledge base of CT’s relationship to R&D activity and examining how R&D expenditure changes in response to fiscal tax policy. Furthermore, to provide nonpartisan advice to policymakers on how to maximize the level of R&D activity through fiscal policy, by analysing the impact that H.R.1 has towards stimulating R&D expenditure in firms. As it was acknowledged in the introduction section that the issue of corporate taxes is highly politicized and that any effects resulting from corporate taxation will arguably be broken down by party lines. However, the primary goal of this study was to answer the research question: Does corporate taxation and R&D activity have a relationship? As extensive research was conducted to establish the existing literature, it predominantly indicated a negative relationship between CT and R&D activity. As such, the difference-in-difference methodology was established to test the theory, with the null hypothesis stating the absence of a relationship between CT & R&D expenditure.
9.1. Findings
What was discovered and mentioned in vivid details in the results, is that companies that experienced a reduction in corporate taxes also raised their R&D expenditure, approximately by 11.60%. This showed that there was a very large increase in R&D activity when corporate taxation was lowered, which would support the literature’s findings that suggested the existence of a negative relationship. However, the findings in the statistics were not significant to indicate the existence of a negative relationship, meaning the results were too weak to reject the null hypothesis. Therefore, the statistics led the authors of failing to reject the null hypothesis, but it is important to mention that even though the statistics failed to indicate a significant result, it does not mean that CT and R&D have a positive nor that it does not have a negative relationship. Figure 4. Median Test, Graphically Illustrating Outliers.
21
It only means that this study has insufficient confidence to establish a negative relationship, which could be the results of sampling errors or other factors discussed in the analysis part. Furthermore, if another researcher conducts the same test with other samples, or through another methodology, then the results could indicate a significant result. Additionally, there are no claims made by the authors regarding the effects of increasing CT has on R&D expenditure, as no statistics were made on that notion. Meaning the results indicated in this study only addressed the changes to R&D when corporate taxes were lowered. Therefore, the answer to the research question is as follows: Based on the sample of 71 companies containing their R&D expenditures from 2018, 2017, and 2016, the results indicate the existence of a negative relationship, but not to the extent that can be considered statistically significant.
Additionally, an interesting finding in the study was that before any policy implementation, the control group and the treatment group had a large correlation to each other, meaning they were quite similar. However, after the treatment group was exposed to the corporate tax reduction of H.R.1, it had a significant impact that reduced its correlation to the control group. This means that the policy implementation caused a significant impact of the different groups to receive different effects, indicating the policy was effective. But again, not to a statistically significant degree, but enough to warrant recognition of a difference in behaviour, see analysis part for more specificity. Moreover, another statistic was conducted to negate specific outliers in the first study, which again yielded the same results and meant that no outliers were significant enough to cause the first study to fail, see analysis part for additional details.
9.2. Context to previous studies
The previous studies of Ljungqvist, Zhang, and Zuo (2017) and Mukherjee, Singh, and Žaldokas (2017) investigated small reductions in corporate taxation and discovered a negative relationship, however, with effects that were not statistically significant. This again is consistent with the findings in this study as well, although this study investigated the big reductions in corporate tax rates. Meaning that the size of the reductions led to the same conclusion, which indicates a negative relationship, but not to a degree that is considered statistically significant. This means that the previously mentioned authors’ findings are in consensus with this study’s findings, indicating a commonality when examining the effects of lowering CT has on R&D activity. Although, the findings made in this study also negates their argumentation of why small reductions in CT are not statistically significant, where they argued that only small tax changes would be ineffective in encouraging R&D activity. Whereas this study examined a large decrease in CT and still came to the same conclusion, which could indicate a weakness in their arguments. Additionally, Ljungqvist et al. (2017) found in their research regarding CT and corporate risk-taking, that a 1% increase in taxation resulted in a 2.4% reduction in risk-taking, meaning that corporate-risk taking is sensitive to fluctuations in CT. However, this study’s findings can neither confirm nor deny such claims, as it only investigated the impacts when corporate tax rates were lowered and not when it was increased.
22
Another interesting finding in the results is that for every 1% decrease in corporate taxation, R&D activity is increased by approximately 0.2892%. This is in accordance with the findings of Montmartin and Herrera (2015) that found in their study that for every 1% decrease in corporate taxation, R&D activity is increased by 0.35%. Although these figures are not the same, the differentiation is arguably considered minimal, which could be the result of possible sampling errors or other factors discussed in the analysis part. However, the underlying point here is the close consistency with previous findings in this subject by Montmartin and Herrera, meaning their results and this study’s results help support each other’s statistical findings. There is also a comment that could be made regarding the arguments between Baliamoune-Lutz (2015), and Bruce, Liu, and Murray (2015), who argue about the implications for nascent and established firms to invest in R&D from changes in CT. Although the study was not designed to tackle nascent and established firms, it was discovered that most companies in the control group were large established firms, whilst the treatment group contained smaller and nascent firms. The interesting discovery that might add some insights into this argument is that the smaller and nascent firms had a significant increase in their R&D expenditures, whilst large and established firms lost an insignificant portion in R&D expenditure or maintained a similar level before the tax change. This would therefore give some supporting evidence for Baliamoune-Lutz’s argument that nascent firms are more agile to take advantage of the lower corporate tax rate than established firms.
The results do support some of the previous studies, with the existence of a negative relationship. For instance, McCarthy (2017) supports the finding of a negative relationship, which the author then continues to claim that a reduction in CT encourages an increased investment of R&D activity. The same goes for Darnihamedani, Block, Hessel, and Simonyan (2018) who in addition claims that the incentive to invest in R&D is connected to an organization's ability to gain reward. This can be argued further, as for the finding shown by the control group and their reaction to a very slight decrease of approximately 1.8% in their R&D activity, can be discussed that those firms were not expected to gain significant reward when the reduction solely came from a reduction in CT. As seen in Figure 2, the change for the control group’s R&D expenditure appears almost stagnant, as it only reduced by approximately 1.8%, which is arguably not a significant result, which its underlying cause could be the result of macro-environmental factors. This claim could with little significance justify one of the many reasons why the control group experienced only an 8% increase in their R&D activity after the tax policy reduction, which is a decrease in their total innovation activity compared to the year before the tax policy.