1
Population policy and childbearing behavior in Ghana since the late 1960s: An Individual level perspective
Nicholas Kofi Adjei
Master’s Thesis in Demography
Multidisciplinary Master’s Program in Demography, spring term 2015
Demography Unit, Department of Sociology, Stockholm University Supervisor: Sunnee Billingsley
2
Table of Contents
1.0 Introduction ... 4
2.0 The Population Policies and Fertility Decline in Ghana ... 5
3.0 Theoretical Framework of Ghanaian Fertility Transition ... 10
4.0 Data and Methods ... 15
5.0 Findings and Discussion ... 18
6.0 Summary and Conclusions ... 30
Acknowledgement ... 34
References ... 35
3
Population policy and childbearing behavior in Ghana since the late 1960s: An Individual level perspective
Nicholas Kofi Adjei
Demographic Unit, Department of sociology, Stockholm University
ABSTRACT: Due to the high population growth rate in the mid-20th century, the
government of Ghana introduced population policies to reduce the population growth rate. Encouraging girls’ education and increasing contraceptive use were the two main policy measures to reduce population growth. Subsequently, the total fertility rate (TFR) declined rapidly from 6.0 in 1985 to 4.3 in 2003. Using 2003 Ghana Demographic Health Survey data, this study seeks to examine the effect or non-effect of the policies using individual level data and more accurate measures than the TFR. The estimated result shows that the population policies may have had some effect on fertility. We observed a mixed pattern relationship between education and births in the earlier periods. From the 1990’s onwards, we observe that women with secondary and a higher level of education have a slower transition to the next birth or are less likely to have it at all. This effect grew stronger over time. We also observed that achieving even primary education had some effect on fertility, especially at higher parities.
4
1.0 Introduction
Ghana is one of the countries in Sub-Sahara Africa that was characterized with a high fertility rate in the mid-20th century (Malmberg, 2008; Tabutin & Schoumaker, 2004).
Statistics from the United Nations report a total fertility rate (TFR) of 6.4 children per woman for the period 1950-1955 (United Nations. Department of Economic and social Affairs, 2013). This high rate of fertility was a major concern for the government due to inadequate resources and infrastructure to support the population growth rate (Winckler, 1998). As a result, different measures and policies were introduced to reverse the trend. The first of these policies was introduced in 1969. Later, statistics from United Nations (2013) indicated that the TFR slightly increased from 6.4 children per woman to 6.9 for the period 1970-1975. This increase in TFR indicates that the 1969 policy was a “paper policy” because the set objectives and targets were not achieved (NPC, 1994). The government’s inability to meet the set objectives compelled it to introduce new policy measures in 1994. Subsequently, the Ghana Demographic Health Survey (GDHS) report in 2008 indicates that Ghana has achieved its fertility target with a TFR of 4.0 children per woman. The use of TFR is commonly use in Ghana to assess the effect of family planning policies and fertility trend (see GSS & Macro, 1999; GSS & Macro, 2009).
However, the TFR as a measure of fertility does not give a true reflection of women’s childbearing behavior. It is a crude measure of fertility and does not really depict woman’s reproductive behavior. To follow women’s reproductive behavior closely, which is necessary to examine the effect of policy on reproductive behavior, a crude measure of fertility is inadequate. Neither effects nor non-effects of policy can be measured if we rely solely on aggregate measures of behavior (Neyer & Andersson, 2008). The effect of policy on childbearing can be assessed if researchers “study the impact of policies on individual behavior, taking into account the features of family policies and their various connections with time, space and uptake’’ (ibid: 700).
The studies that have used other measures than the TFR in Ghana have established fertility decline and differences according to urban-rural residence, religion and ethnic group. The few reproductive studies that examined the role of education on reproductive behavior in Ghana also established fertility differentials according to the level of education (see Gyima, White, & Maxim, 2005; Gyimah, 2003). However, none of these studies examined the influence of education on fertility by comparing the patterns over time. Period analysis becomes more important considering the structural changes in the Ghana education
5
system especially female education as a result of the policy implementation. This study therefore, distinguishes itself by examining the effect of education on reproductive behavior, comparing the patterns before and after the population policy in 1994.
Bearing in mind the gap in the aforementioned existing literature, we aim to address both methodological and substantive issues in Ghana’s fertility decline. The methodological objective centers on the use of a more accurate method other than the TFR to analyze reproductive behavior; that is using individual level data to investigate parity-specific effects or non-effects of the 1994 population policy.
The second objective, more substantive in nature, seeks to investigate the effect of education and other socio-demographic factors on the childbearing behavior of women at each birth order independently to analyze the effect or non-effect of the 1994 population policy. Analyses are based on the Ghana Demographic & Health survey (GDHS) conducted in 2003.
2.0 The Population Policies and Fertility Decline in Ghana
Fertility has remarkably declined in Ghana in recent years, with the rate among the most rapid decline in sub-Saharan Africa (Parr, 2002). After the increase in TFR from 6.4 children born per woman in the 1950-55 period, the fertility rate increased to 6.8-6.9 between 1960-1975 and then substantially decline to 5.3 for the period 1990-1995, and 4.3 for the period 2005-2010. The decline from 6.4 children per woman in the 1950s to 4.3 children per woman in the 2000s is almost 33 percent, which is more than the 10 percent rule that has come to be conventionally accepted as indicating the onset of irreversible fertility transition (Caldwell, Orubuloye, & Caldwell, 1992). A further decline to 3.6 children per woman has been projected for 2015-2020. (See Fig 1) below
6
Fig 1: Period Total Fertility Rate Ghana: 1950 to 2020
Source: Authors own display of United Nations data, 2013.
The main objective of the 1969 and 1994 population policies was to decrease the high TFR due to lack of adequate resources and infrastructure to support the increasing population growth rate. Both policies had two main objectives. However, the implementation strategies were different and therefore yielded different outcomes.
The first objective was to increase the modern contraceptive prevalence rate by 2020. Previous research and findings from other countries indicate that increased awareness and use of various modern contraceptive methods greatly reduce fertility rates as compared to the traditional methods, because modern contraceptive methods are significantly more effective in preventing pregnancy (Trussell & Kost, 1987). According to Bongaarts (1978) contraceptive use is a major determinant of fertility rate. Therefore, the proportion of women who use modern contraceptive method will determine how fast or slow fertility will decline. Consequently, both policies aimed to increase awareness as well as the use of modern contraceptive methods such as condoms and pills (GSS & Macro, 1989, 1999, 2009) to reduce the high fertility rate.
The second objective of the policies was to encourage girls’ education up to the secondary level. Girls’ education was viewed as a tool through which women would be more informed of their reproductive rights and learn more western views on fertility related issues
0 1 2 3 4 5 6 7 8 TFR Period
Total Fertility Rate
7
(Caldwell, 1982). Education was also seen as a powerful tool that could influence women’s reproductive behavior, by increasing their knowledge of reproduction and fertility patterns (Martin & Juarez, 1995). In addition, prolonged education itself was seen as a strong motivation for postponing childbearing to later years. The postponement effect is a well-documented explanation for declining fertility rates in developed countries (Cygan-Rehm & Maeder, 2013).
In spite of the similarities in the overall aim and objectives of both policies, the implementation strategy adopted in 1994 differed significantly from the policy introduced in 1969. The 1969 policy lacked well-modulated and functional institutions to translate the policy into action; thus several factors account for the dismal performance.
The first limitation of the 1969 policy was that no accurate family planning measure was taken after its introduction. Even though no active measure was taken, TFR declined slightly from 6.9 children born per woman to 6.4 in 1988 (GSS & Macro, 1989). The reason for this decline was not attributed to the population policy of 1969; instead some researchers suggest that the amendment of the 1985 criminal code, which liberalized abortion, may have been a factor in this minor fertility decline. Nonetheless, the abortion law was “precipitated by famine” and economic crisis from the late 1970s until mid-1980s in Ghana (Finlay & Fox, 2013, p. 12) and may have also contributed to the minor decline. Research conducted by Finlay and Fox (2013) examined whether the liberalization and decriminalization of abortion in 1985 contributed to the rapid fertility decline in Ghana after the introduction and implementation of the 1969 policy. Results from the analyses indicated that the abortion law contributed to the fertility decline; especially among “women in school” and “women who indicated that they wanted no more children at the time of the survey”. Conversely, analysis of key interviews indicated that the law was poorly executed and that many women were oblivious of it. Therefore the decline could be incidental (ibid).
The second limitation of the 1969 policy was its failure to implement the education aspect of the policy. However, in order to fulfil one of the main policy objectives, the Free Compulsory Universal Basic Education (FCUBE) program was implemented in 1995 in conjunction with the 1994 policy (MOE & GES, 2001). FCUBE eliminated school fees in order to increase the demand for school and encourage girls to continue their education up to at least secondary school. According to Gyimah (2005) since there have been structural changes in the secondary education system, more women have enrolled up to the
8
secondary level, and this has affected their reproductive status and reduced the fertility rate. This suggests that women who stayed in school delayed the entrance to parenthood. Statistics from United Nations Educational, Scientific and Cultural Organization (UNESCO) shows that gross female enrolment ratio for secondary education decreased from 31.0% in 1980 to 28.6% in 1989 then substantially increase to 36.3% in 1999 and 40.9% in 2004 (UNESCO, Institute for Statistics, 2014).
Evidence from Ghana Demographic Health Survey also reveals that knowledge of modern contraceptive rose significantly from 73.8 percent in 1988 to 97.5 percent in 2003(GSS & Macro, 1989, 2004). The most commonly known were condoms, pills, injectable, foam tablets, and implants. However, the use of these methods was low; only about 20 percent of women reported using any contraceptive method between 2000-2009 (Finlay & Fox, 2013). Ghana continues to have a very low rate of modern contraceptive use (See Table1)
in comparison to other African countries.
Table 1: Percent of women currently using modern contraception in Low- and middle income countries, estimated from DHS
1985-89 1990-94 1995-99 2000-04 2005-09 Currently Using Any Contraceptive method (% Women)
DHS Americas 31.0 32.4 39.8 42.5 46.6
DHS Asia 54.7 38.8 31.3 33.0
DHS Europe 57.8 50.5 50.4
DHS Northern Africa 30.9 22.9 33.3
DHS Sub Saharan Africa 16.5 15.8 18.3 19.2 21.8
Ghana 12.3 18.9 18.0 20.7 19.3
DHS total 28.2 21.0 28.9 28.3 31.4
Currently Using Any Modern Contraceptive method (% Women)
DHS Americas 24.3 23.8 33.3 35.4 40.7
DHS Asia 46.4 28.5 17.6 21.1
DHS Europe 33.5 5.6 35.6
DHS Northern Africa 25.7 19.7 29.0
DHS Sub Saharan Africa 9.3 8.9 12.0 14.2 16.2
Ghana 3.7 9.3 10.7 15.3 13.5
DHS total 21.3 13.7 20.6 20.6 24.1
9
Despite low contraceptive prevalence, the total fertility rate (TFR) declined substantially from the early 1980s (see fig.1). How can we explain the fertility decline following the 1980s?Can it be linked to the strategy adopted by the government to influence fertility such as female education and modern contraceptive use?
From a time and space perspective, an earlier study on patterns of fertility change conducted by Agyei‐Mensah and Aase (1998) in Ghana indicated that fertility change occurred in a “socioeconomic and geographically’’ distinct manner. Using samples of three birth cohorts from the 1950s, 1960s and 1970s, the study revealed that fertility decline is normally greater among those in urban areas than in the rural areas but there seems to be even more variation in the urban areas where ‘’indigenous’’ dwellers have higher fertility than the ‘’elite’’ among the 1970 cohorts (ibid).
With regards to timing of births in Ghana, Oheneba-Sakyi and Heaton (1993) used 1979-80 Ghana Fertility Survey (GFS) data of four birth cohorts from 1930-1939, 1940-1949, 1950-1954 and 1955-1964 by applying accelerated failure time model to examine the effects of birth intervals from parity one to ten. The studies revealed that older cohorts, women born between 1930-39 experienced their second birth earlier than the most recent cohorts. In addition, the recent cohort waited slightly longer to have another birth. This pattern continues for 3-4, 4-5 and 5-6 parities. However, he also noted that the recent cohort did not show a consistent pattern of delayed births.
Gyimah (2005) studied socio-cultural differences in timing and spacing of births in Ghana using 1998 Ghana Demographic and Health Survey (GDHS) data . The study shows that the birth interval is affected by ethnicity, education and religion. In regards to first birth, the Traditionalists, the Gas and the Mole- Dagbanis have a longer transition between marriage and first birth. However, in terms of the interval between successive births, the traditionalists seem to have shorter birth intervals. The Catholics and Muslims also have shorter intervals than the protestant. The Akans shows variations in the intervals between successive births as compared to the Ewes and Mole Dagbanis, who show longer and consistent intervals between successive births. The study provides insight about how religious differences with different beliefs, practices and norms on reproductive behavior influence the timing and spacing of birth.
No study that looks carefully at childbearing behavior (instead of TFR) has examined the impact of the 1994 population policy. This study therefore seeks to analyze the effect or non-effect of the population policies on reproductive behavior. Since the policy was
10
implemented in 1994, we thus consider this year as the critical juncture. We pay special attention to changes after 1994 in reproductive behavior that might be related to the policy. One could say that a simple before-after comparison would be useful for inferring an effect of policy changes because of the vigorous pursuit to reduce the fertility rate. Nevertheless, the effect of a policy can take immediate effect or take a longer period of time before the impact is evident, depending on the strategy used to implement the policy and its efficacy. By using individual-level data and childbearing histories of women across time, we can analyze whether the policy has an effect or not immediately and in the years following implementation. We can also identify the behaviors influenced by the policy by examining the parity specific effects.
3.0 Theoretical Framework of Ghanaian Fertility Transition
Developing countries have experienced significant decline in fertility in recent decades (Bongaarts, 2008) and this decline has been faster in sub-Saharan Africa (Parr, 2002). A variety of factors and theories ranging from economic, social to cultural have been proposed to explain this transition, related to patterns of family formation, family size and fertility control behaviors. In Ghana’s case, we focus on how norms and attitudes influence fertility behavior using the theory of planned behavior and the Innovation-Diffusion theory. 3.1 Theory of Planned Behavior
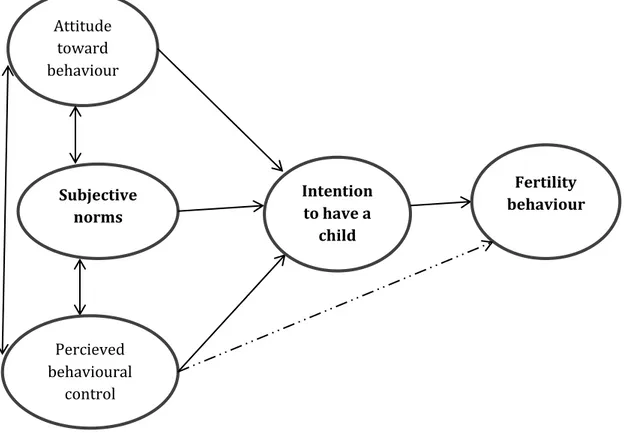
Norms and beliefs play a critical role in shaping individuals’ fertility behavior. These norms are prescriptive or proscriptive in the sense of “should” or “should not”, which are supported by consensus (Settersten Jr & Mayer, 1997) and are backed by sanctions ranging from punishment to stigmatization (Durkheim, König, & König, 1984). The theory of planned behavior (Ajzen, 1991) underscores how subjective norms impact fertility behavior. According to the theory, the intention of a particular act is the immediate determinate and single best predictor of certain behavior. See figure2 below
11
Figure 2 establishes the link between subjective norms, attitude and behavioral control and how they influence the intention to have a child or more children. Subjective norms influence perceived behavioral control of individuals’ intention or decision to have a child (Ajzen, 1991). Fertility related norms are often attached to age at first birth, timing norms (where women of childbearing age are considered too old or too young to have (more) children) and quantum norms which is the number of children an individual should have (Liefbroer & Merz, 2009).
Ghana is one of the countries in sub-Saharan Africa that has several ethnic groups and beliefs based on tribal associations and common socio-cultural identity. These beliefs vary across the various tribes and ethnic groups. Therefore the decisions of an individual, especially reproductive rights or decision are influenced by the ethnic and family setting, which influences the timing of birth and the number of children an individual can have. The Akans for instance are predominately pro-natalist but have relatively long birth intervals, whereas the other ethnic groups such as Ga-Adangme have shorter birth intervals (Oheneba-Sakyi & Heaton, 1993). Religion is also another important predictor of fertility in sub-Saharan Africa (Adongo, Phillips, & Binka, 1998; Gyimah, Adjei, & Takyi, 2012).
Attitude toward behaviour Subjective norms Percieved behavioural control Intention to have a child Fertility behaviour
12
For instance, the traditionalist believes that children are lineage, therefore if there are no children, lineage will break so a woman should give birth to many children. However a study conducted by Adongo et al. (1998) in the northern region of Ghana, where these practices are common, shows that preference for a small family size is now evident even in these rural communities.
A number of studies on fertility have pointed to education especially female education as an important factor in reducing family size in developing countries (see Bbaale & Mpuga, 2011; Kravdal, 2002; Vavrus & Larsen, 2003). The question is how does female education reduce family size?
A high level of women’s autonomy or power through education in decision making is one mechanism of having fewer children. In a much cited paper, Dyson and Moore (1983:45) define Autonomy as ‘‘the capacity to manipulate one’s personal environment and the ability- technical, social and psychological to obtain information and to use it as the basis for making decisions about one’s private concerns and those of one’s intimates’’. Women’s education and labor participation are the two main proxy variables used as women’s autonomy. Many studies (e.g., Basu, 1996; Jejeebhoy, 1995; Sathar, 1996) used female education as a proxy to measure women’s autonomy and reproductive behavior. Although it is widely held that women’s autonomy leads to fertility decline, results from these studies are more complex. Sathar’s (1996) findings indicate that education gives women more autonomy and a greater role in fertility decision making to have fewer children, whereas Basu’s (1996) study concluded that women’s education and autonomy is not sufficient for fertility decline. She argued that although women’s education is essential in the fertility decision making process, contraceptive use and other family planning measures should not be ignored.
Even though women’s autonomy plays a role in the reproductive decision making, the role of the man and his fertility desire cannot be overlooked. In a male-dominated society like Ghana where males dominate over fertility decision, work by DeRose and Ezeh (2005) on men’s influence on fertility decline in Ghana revealed that although a man’s influence on fertility decision outweighs a woman’s, her education plays a role in the reproductive decision making process. Thus, a high level of education empowers women in decision making to question traditional roles (McDonald, 2006) and reject traditional beliefs and values supporting a large family size (Weinberger, 1987), hence fertility decline.
13
3.2 Innovation-Diffusion Theory
The diffusion of innovation theory is one of the oldest theories in the social sciences developed by E.M Rogers in 1962 (Rogers, 2010). This theory provides an alternative explanation to the main stream socio-economic demographic theories to explain fertility decline (Casterline, 2001). Over the last two decades, a number of studies using this theory assert that fertility decline is not only an adaptive response to socio economic changes but also is due to the spread of key attitudes and behaviors as well as social interactions (Casterline, 2001; Montgomery, Casterline, & Heiland, 1998; Palloni, 2001). This theory has not only been applied to fertility transition, but also to mortality change (Montgomery, 2000).
The innovation diffusion theory consists of two components that are linked but distinguishable-“innovation” and “diffusion”. The former being the increased prevalence of attitudes and behavior that were hitherto absent in society and the latter involving the spread of attitudes and behavior due to increased prevalence (Casterline, 2001). The spread of ideas, behavior and technique from one social group or individual to another (Retherford & Palmore, 1983) is often through channels such as language, ethnicity and religion. According to the theory, during the diffusion process, individuals can be categorized into five stages: innovators, early adopters, early majority, late majority and laggards. The early adopters and innovators of contraceptive use are individuals who are well educated (Casterline, 2001; Weinberger, 1987), live in urban areas (Casterline, 2001) and then later spread their ideas and behavior to other parts or segments of society. For instance, if a woman of reproductive age begins using modern contraceptives, other women in the community might also start using them through either formal or informal social learning. This form of social influence leads to attitudinal change in reproductive behavior in the population, which may lead to fertility decline.
Research has consistently shown that female education is an important element of contraceptive behavior because it supports the ability to use modern contraceptive and even switch from one method to another in developing countries (see Bbaale & Mpuga, 2011; Benefo, 2006; Cleland, 2002; Curtis & Blanc, 1997; Parr, 2002). There are several reasons why contraceptive use increases as female education increases. To summarize briefly, these studies indicate that educated women have adequate information about modern family planning methods and use them effectively as compared to women with no or less education. Also, less educated women are less capable of understanding television
14
and radio messages on family planning methods as compared to highly educated women due to differences in literacy rates (Parr, 2002).
Education also increases spousal communication (Weinberger, 1987), which can lead to fertility decline (Oyediran & Isiugo-Abanihe, 2002). Avogo and Agadjanian (2008) study on the impact of traditional religion on fertility in the northern region of Ghana revealed that the social networks of partners and communication on reproductive matters significantly increases the likelihood of contraceptive use among women.The availability of family planning methods and the use of modern types of contraceptives by women may contribute to the reduction in the demand for children as well as influence the spacing and timing of births contributing to fertility decline.
The recent rapid fertility decline in Ghana may be the result of the increased prevalence of attitudes and behaviors that were previously rare in the society. The use of modern contraceptives and other family planning methods which were hitherto not practiced in Ghana have now become diffuse throughout the country. Even modern birth control measures that were previously unknown or unacceptable by some segment or ethnic groups due to religious and ethnic beliefs are now practiced (Adongo et al., 1998). This is due to the intensive campaign of family planning methods and education expansion across the country by the government. As indicated earlier, there has been a rise in knowledge and use of modern contraceptives over time after the policy implementation; because educated women are more likely to be aware of these family planning methods and even use them effectively as compared to women without any education.
Recent studies conducted by Parr (2002) on contraceptive use and fertility decline in Ghana indicate that knowledge about family planning methodsincreases the likelihood of usage. The finding of the study further shows that contraceptive use is higher among highly educated women as compared to low educated women. With respect to trends, the late 1990s and early 2000s witnessed higher usage of modern contraception among women with secondary education as compared to the periods before the policy implementation. The difference in percentage between women with no education and those with secondary education is non negligible. This is evident in the Ghana Demographic Health survey (GDHS) report. The report revealed that, women with secondary and higher education who were current users of modern contraception was about 6.7% in 1988, 13.8% in 1993, then increased to 20.3% in 1998 and 28.1% in 2003 as compared to 3.2% in 1988, 3.6% in 1993, 8.9% in 1998 and 11% in 2003 for women with no education (GSS & Macro, 1989, 1994, 1999, 2004). The effect of increase contraceptive use especially among highly educated
15
women might lead to postponing childbearing to later years; which can lower the chances of giving birth to many children.
4.0 Data and Methods
The data for the study was obtained from the Ghana Demographic & Health survey (GDHS) conducted in 2003. The survey was undertaken by the Ghana Statistical Service (GSS) in collaboration with the Noguchi Memorial Institute for Medical Research (NMIMR) and Ghana Health Service (GHS) and was conducted between July and October in 2003. The GDHS in 2003 was a national representative survey of women and men in their reproductive age, 15 to 49 years from 6,251 households. A total of 5,691 women and 5,015 men were interviewed yielding a response rate of 96% and 94% respectively. Only women were included in the analyses because the population policy was mainly targeted at women. The survey obtained detailed information on fertility, marriage, sexual activity, fertility preferences and awareness of and the use of family planning methods.
4.1 Method of Analysis
The analytical design of this study is to estimate the propensity of having had a first, second, third, fourth and fifth birth. Examining the risk of birth using retrospective information brings to bear some problems where some of the events of interest may not have occurred yet to some portion of the sample (Allison, 2010). This brings about the problem of right censoring caused by incomplete experience of the event studied. In this regard, “censored cases need special attention and treatment when estimating the exposure time; for this reason, normal regression procedures are unsuitable. To overcome this problem, survival models are more appropriate for such analyses, since they make the assumption that censored individuals will eventually experience the event at some time” (Gyimah, 2003, p. 8) or not.
The study is done using piece-wise exponential hazard model based on exponential distribution to estimate the relative risk of births controlling for the relevant covariates that affect the risk of birth. The choice of exponential hazard regression model over other models, especially the non-parametric model, is that the exponential model completely specifies the hazard function h(t) and the survival function s(t) and is more consistent with theoretical s(t) (Hamilton, 2012).
The exponential distribution has a constant hazard 𝜆(𝑡) = 𝜆. Thus, the survival function is 𝑆(𝑡) = exp{−𝜆𝑡} and the density is 𝑓(𝑡) = 𝜆 exp{−𝜆𝑡}. (1)
16
In this study, we used 𝑆𝑡𝑎𝑡𝑎´𝑠 𝑠𝑡𝑟𝑒𝑔 command to fit a piece-wise exponential proportional hazard model, thus the explanatory variables were introduced into the hazard model using the proportional hazard model specification below;
𝜆
𝑖𝑗= 𝜆
𝑗𝑒
𝛽1𝑥𝑖1+𝛽2𝑥𝑖2+⋯+𝛽𝑝𝑥𝑖𝑝(2)
Where
𝜆
𝑖𝑗is the hazard corresponding to the individual i in interval j,
𝜆
𝑗 is the baseline hazard for interval j, and𝑒
𝛽1𝑥𝑖1+𝛽2𝑥𝑖2+⋯+𝛽𝑝𝑥𝑖𝑝 is the relative risk for an individualwith covariate 𝑥𝑖, compared to the baseline, at any given time. 4.2 Variables
The dependent or outcome variable in our study is the risk of bearing a(nother) child (or survival time of women until the time they bear a(nother) child), up to the fifth birth. To observe childless women at risk of having a first child, the trajectory is followed since they turn 15 until the first birth, or turn 50, or were interviewed (by October 2003), whichever comes first. In the case of higher order births, duration since first birth, duration since second birth, duration since third birth and duration since fourth birth are measured for second, third, fourth and fifth birth analyses, respectively, or were censored at age 50 or the interview, whichever comes first.
Calendar period is the most essential time-variant covariate used in this study, because the main goal of the study is to evaluate the population policy of Ghana. Since women who turned 49 years in 2003 were born in 1954 and turned 15 years in 1969, we used 1969 as the base year. Calendar years is aggregated into seven year groups (1969-73, 1974-78, 1979-83, 1984-88, 1989-93, 1994-98, 1999-03) for first birth, second birth and third birth and six year groups (1969-78, 1979-83, 1984-88, 1989-93, 1994-98, 1999-03) for fourth and fifth birth, where special attention will be given to childbearing trends after the 1994 population policy. We categorized calendar year systematically so that the year the policy was implemented will be at the beginning of the period instead of putting it in the middle or at the end. This will enable us to see easily the effect or non-effect of the policy.
Education is an important variable that helps to explain women’s reproductive behavior and the impact of the policy. Because one of the main objectives of the policies is to increase the proportion of females with secondary and higher education, women’s education is one of the main independent variable used for the study. According to Gyimah (2003), because the educational attainment of women in Ghana does not change once childbearing starts, it
17
is always assumed that the educational level at the time of the survey is similar to the educational level at the birth of the first child. Nevertheless, we reconstruct the educational histories of women at first birth to avoid anticipatory analysis (see Hoem & Kreyenfeld, 2006). The reconstruction of the educational histories follows the (6-3-3-4) education system in Ghana, which starts at the age of 6 years. The system represents 6 years of primary school, 3 years of junior high school, 3 years of senior high school and 4 years of university or 3 years for other tertiary institutions like the polytechnic or teachers training college. We combined the variable “highest educational level” and “highest year of education” to reconstruct a time varying education variable and categorized it into three groups: no education, primary and secondary / higher.
Ethnicity is an important variable that influences fertility in Ghana. It is one of the predictors of the study and a time constant variable. In sub-Saharan Africa, reproductive behavior is influenced by ethnic norms. There are several ethnic groups characterized on the basis of language and cultural practices in Ghana. These ethnic groups differ in terms of tradition, values and attitude towards fertility and other reproductive behaviors (Oheneba-Sakyi & Heaton, 1993). In general, the ethnic groups in southern Ghana (that is, the Akans, Ga-Adangmes and Ewes) are more exposed to modernization than those in northern Ghana (that is, the Mole-Dagbanis). Ethnicity is thus categorized into five groups: Akan, Ga-Adangme, Ewe, Mole-Dagbani, and Others. This categorization is based on the major ethnic group classification in Ghana.
Religion is one of the main predictors of the study and a time constant variable as well. It is an important variable to consider when examining fertility in sub Saharan Africa (Adongo et al., 1998; Gyimah et al., 2012) and the risk of birth in Ghana.In Ghana, there are three main religious views and these religions have different perspectives on reproductive behavior. The traditional religion believes in a large family size to maintain lineage. These beliefs sometimes make the reception of family planning activities irrelevant. Hence, family planning programs sometimes fail with little or no impact on reproductive decisions. Christians and Muslims on the other hand also have different forms of beliefs, practices and norms about fertility-related behaviors. The Christians- Catholics and Muslims are also less likely to use birth control methods; hence they have shorter birth intervals as compared to the Christians-Protestants and those with no religion. While we acknowledge that religious norms affect the risk of birth, we used religious affiliations as a proxy due to data limitations (Gyimah, 2003). We thus categorized religion into four groups: Christian, Muslim, Traditionalist and No religion.
18
Childhood place of residence is another time constant variable used for the study. We used this variable to measure the importance of being raised in an urban or rural environment. A woman’s childhood environment, either social or physical, might influence her beliefs and behavior related to fertility as an adult. We categorized this variable into two groups: urban and rural residence.
Woman’s age is a significant time varying variable in all parity analyses and is the basic time scale variable for the first birth study. Women are followed since 15 years old until first birth or the time of the interview, whichever comes first.We thus categorized age into five levels 15-19, 20-24, 25-29, 30-34 and 35+ years. For the subsequent births, the basic time scale factor is duration since the previous birth. This variable is categorized into six levels: 0-2 years, 3-4 years, 5-6 years, 7-8 years, 9-10 years and 11-12 years.
Sex composition of previous child(ren) is another factor that may affect a family`s decision making. The sex distribution of previous child(ren) influences fertility decision when women or couples have preferences for a particular sex or sex composition of a family. The existence of gender preference may lead to higher fertility in a population (Bongaarts, 2001). “The term son preference is usually used to refer to the attitude that sons are more important and more valuable than daughters” (Clark, 2000, p. 95). In Ghana, the agriculture sector is the predominant form of occupation (Duncan, 1997; Sutton, 1983), which means that couples especially in the rural areas prefer sons to provide economic assistance. In this regard, women whose surviving children are all daughters are expected to have a higher risk of subsequent births as compared to their counterparts with male children. We considered the importance of this factor only for the second and third birth analyses, where sex composition is more likely to be unbalanced and categorized families as having: a boy or girl for the second birth model and all boys, all girls, or mixed composition for the third birth model.
5.0 Findings and Discussion
In this section, we estimated the relative risk, together with the p-values and standard errors for first, second, third, fourth and fifth births in order to evaluate the significance of each covariate used for the study. For each covariate, a relative risk greater than one implies a higher risk of birth than the reference category while a relative risk less than one implies a lower risk of birth than the reference category. We also standardised annual relative risks for all births relative to 1993 to get a clear picture of the calendar-year trend. This enables us to observe closely the effect or non-effect of the policy.
19 5.1 First birth risk
5.1.1 Relative risk of first birth
Table 2 shows the estimated risk of first birth. We grouped calendar period into seven levels controlling for woman´s age, childhood place of residence, educational level, ethnicity and religion.
Table 2: Relative risk of first birth for Ghanaian women 1969-2003 by woman´s age, calendar period education level, ethnicity, religion and childhood place of residence.
Covariates Relative Risks Std. Err.
Woman's age 15-19 1 - 20-24 2.24*** 0.08 25-29 2.14*** 0.13 30-34 1.27* 0.17 35+ 0.56*** 0.13 Calendar period 1969-73 0.81* 0.09 1974-78 1.01 0.07 1979-83 1.04 0.06 1984-88 1 0.06 1989-93 1.00 - 1994-98 0.81*** 0.04 1999-03 0.85*** 0.04 Education level No education 1.30*** 0.06 Primary 1 - Secondary/Higher 0.88*** 0.04
Childhood place of residence
Rural 1.21*** 0.04 Urban 1 - Ethnicity Akan 1 - Ga-Adangme 0.87** 0.06 Ewe 0.90** 0.05 Mole-Dagbani 0.87*** 0.05 others 0.90* 0.05 Religion Christians 1.10* 0.06 Muslims 1 - Traditionalist 1.17* 0.10 No religion 1.17** 0.09 # of subjects 5499 # of failures 3813 Time at risk 363778 Log Likelihood -5781.53 prob>chi2 0.0000
Source: Ghana DHS, authors own calculations.
Notes: *** Significant at the 1% level, ** significant at the 5% level, *significant at the 10% level. See Table A (appendix) for Occurrence and Exposure distribution of all covariates to study first birth risk.
20
From table 2, we can observe that the first birth risk is higher among relatively younger ages. The age for first birth risk shows an “n-shape” pattern with the peak risk between 20-24 years and falling rapidly towards the end of the reproductive life span. The risk of first birth among the latter diminishes by almost 45% when compared with women between 15-19 years. The link between younger ages and higher risk at first birth is attributable to the “enormous pressure” put on women by society to prove their ability of childbearing soon after marriage (Gyimah, 2003). In Ghana, the average age at first marriage is 19 years (Chuks, 2002). Soon after marriage, they start childbearing which may eventually affect their reproductive behavior.
We can observe no difference in the first birth risk from 1974-1993. Compared to that period, and the 1984-1993 specifically, we found two periods where the risk was 19% lower (1969-1973 and 1994-1998, although the former was significant at only 10% level), and the final time period observed has a slightly less lowered risk of 15%.
Examining the effect of socio-cultural variables, as expected, we can observe that women with secondary or higher education have the lowest risk of first birth, which means they wait the longest to enter parenthood. The risk for women with secondary or higher education is about 12% lower when compared with women with primary education. On the contrary, the risk of first birth for women with no education is about 30% higher than the risk for women with primary education, leading to a perfect negative education gradient.
In terms of the effect of ethnicity on first birth risk, we observe significant differences in first birth risk. Compared to all the other ethnic origins, Akans have a significantly higher risk of first birth. Their risk is about 10% higher than the other ethnic groups. The result supports previous findings by Gyimah (2003), that the Akans have a relatively higher risk of first birth compared to other ethnic groups and this could be attributed to differences in “lineage” and “residential patterns” (ibid: 16). In terms of the effect of religion on the risk of first birth, traditionalist, christians and women with no religion have a higher risk at first birth compared to Muslims. As expected, women who are brought up in the rural areas have a higher risk of first birth compared to their urban counterparts. Their risk of first birth is around 21% higher than those who were brought up in the urban areas.
21
5.1.2 Period trend in first birth
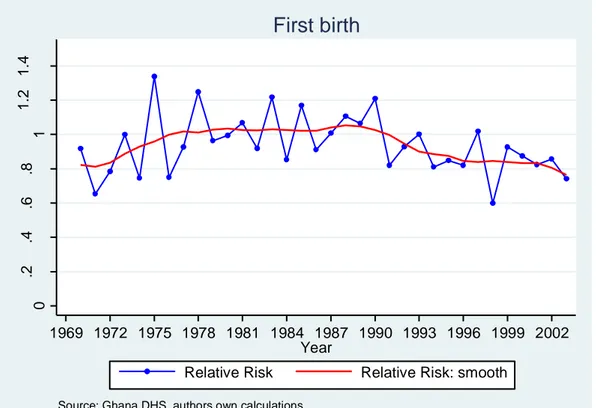
Figure 3: Annual first birth risk, relative to 1993, Ghanaian women 1969-2003, standardized by woman´s age, education level, ethnicity, religion, and childhood place of residence.
The figure above takes a closer look at the difference in first birth risk over time than the previous model results and shows the relative risk of first birth for Ghanaian women between 1969-2003, standardized by woman´s age, education level, ethnicity, religion, and childhood place of residence. We can observe that the relative risk of first birth is relatively higher during the first two decades of the observation period and peaks in the late 1980s. Thereafter, we see a gradual decline in the relative risk till the end of the study period. The effect of the 1994 population policy is however, not visible for the first birth since we do not observe a sharp decline after 1994 or subsequent years after the population policy was enacted.
5.1.3 Interaction effect
In order to gain insight into the differential trend according to women’s educational level over time, we ran an interaction between calendar period and education level. This will enable us to see the effect or non-effect of the policy as well as enable us to discern the sub-group of women influenced by the policy. In the previous sections, we argued that increased enrolment in girls’ education and knowledge of contraception after the policy might lead to fertility decline over time. The introduction of the 1994 population policy led to a widespread (diffusion) of modern contraceptives and increased use among educated
0 .2 .4 .6 .8 1 1 .2 1 .4 R e la ti ve ri sk 1969 1972 1975 1978 1981 1984 1987 1990 1993 1996 1999 2002 Year
Relative Risk Relative Risk: smooth
Source: Ghana DHS, authors own calculations.
22
women. As a result, the relationship between education and fertility is expected to be negative after the policy implementation. We examine the interaction effect in two ways: column wise and row wise examination. Column wise examination will enable us see how the first birth risk is affected by women’s educational level in each period and a row wise examination will enable us to see the pattern of first birth risk by women’s educational level over time.
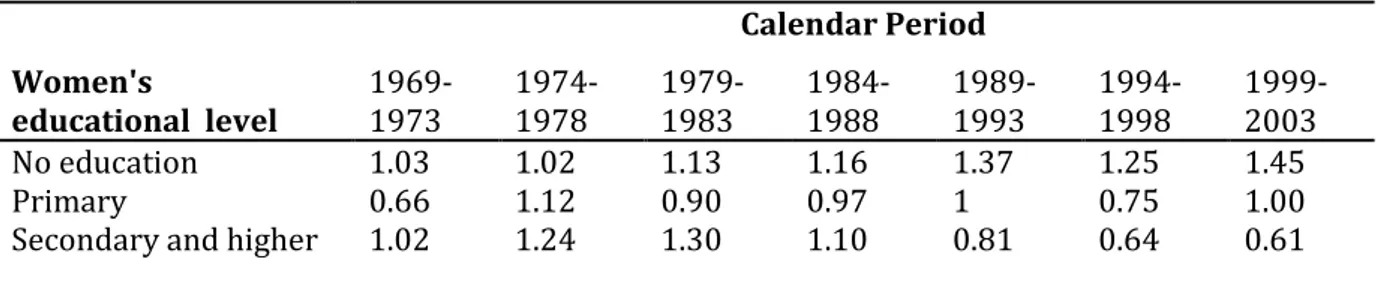
Table 3: Relative risk of first birth for Ghanaian women, by interaction between calendar period and women’s educational level.
Calendar Period
Women's
educational level 1969-1973 1974-1978 1979-1983 1984-1988 1989-1993 1994-1998 1999-2003
No education 1.03 1.02 1.13 1.16 1.37 1.25 1.45
Primary 0.66 1.12 0.90 0.97 1 0.75 1.00
Secondary and higher 1.02 1.24 1.30 1.10 0.81 0.64 0.61 Source: Ghana DHS, authors own calculations.
Note: The interaction is controlled for all other variables presented in Table 2.The interaction is significant according to the likelihood-ratio test. LR chi2 (33) = 914.51 Prob>chi2 = 0.0000
From the results of the interaction as shown in Table 3 and Figure 6(appendix), we can observe that the relationship between women’s education and first birth risk appeared to be mostly U-shaped from the late 1960’s to the late 1980’s. During these periods, the risk of first birth was lower among women with primary education and higher for women with no and secondary education except in the mid-1970’s where we observe a more positive gradient. From the 1990’s onwards, the pattern transformed where we see a negative gradient for first birth risks. The difference is more pronounced among the various educational levels as compared to the earlier periods. A row wise examination shows a general increase in first birth risk for women with no education. Their risk of first birth increased over time; however, we cannot discern a clear pattern for women with primary education. We see up and down turns in the risk of first birth over time. Meanwhile, we can observe a decrease in the risk of first birth from the mid-1980’s among the more educated women.
23 5.2 Second and third birth risk
5.2.1Relative risk of second and third birth
Table 4: Relative risk of second and third birth for Ghanaian women 1969-2003, by duration, woman’s age,
calendar period, sex of previous child, educational level, ethnicity, childhood place of residence & religion.
Second birth Third birth
Covariates Relative Risks Std. Err. Relative Risks Std. Err.
Duration since first & second birth
0-2 years 0.39*** 0.02 0.35*** 0.02 3-4 years 1 - 1 - 5-6 years 0.56*** 0.04 0.57*** 0.05 7-8 years 0.45*** 0.05 0.51*** 0.06 7-10 years 0.24*** 0.04 0.44*** 0.08 11-12 years 0.16*** 0.03 0.09*** 0.03 Woman’s age 15-19 0.61*** 0.04 0.58*** 0.06 20-24 0.92* 0.04 0.89* 0.04 25-29 1 - 1 - 30-34 0.96 0.09 0.90* 0.06 35+ 0.61*** 0.11 0.68*** 0.08 Calendar period 1969-73 1.14 0.22 0.61 0.36 1974-78 1.14 0.10 1.04 0.13 1979-83 1.10 0.07 1.08 0.08 1984-88 1.02 0.06 0.96 0.06 1989-93 1 - 1 - 1994-98 0.93 0.05 0.87** 0.05 1999-03 0.91* 0.05 0.79*** 0.05
Sex of previous child
Male 0.97 0.03
Female 1 -
2 males 1 -
2 females 0.96 0.06
Male and Female 1.00 0.05
Childhood place of residence
Rural 1.14*** 0.04 1.11** 0.05 Urban 1 - 1 - Educational level No Education 1.08 0.06 1.15** 0.07 Primary 1 - 1 - Secondary/Higher 0.70*** 0.04 0.80*** 0.05 Ethnicity Akan 1 - 1 - Ga-Adangme 0.81*** 0.06 0.96 0.06 Ewe 0.91 0.05 0.85** 0.06 Mole-Dagbani 0.90* 0.05 0.92 0.06 Others 0.95 0.06 0.93 0.06 Religion Christians 1.02 0.06 0.96 0.06 Muslims 1 - 1 - Traditionalist 1.15 0.10 1.18* 0.11 No religion 1.16* 0.09 1.08 0.09
24 # of subjects 3949 3143 # of failures 3163 2472 Time at risk 173518 133132 Log Likelihood -4032.35 -3123.09 prob>chi2 0.000 0.000
Source: Ghana DHS, authors own calculations.
Notes: *** Significant at the 1% level, ** significant at the 5% level, *significant at the 10% level. See Table B1&B2 (appendix) for Occurrence and Exposure distribution of all covariates for second and third birth risk respectively.
From table 4, we can observe from the estimated relative risks that Ghanaian women are prone to have another child 3-4 years after the previous child. The propensity to have another child is slightly significant higher for one-child women as compared to two-child women before 3 years. We however, cannot see any clear pattern after 4 years among the two groups. The second and third birth risk is higher among the relatively younger ages. Older women are less likely to bear a second and third child. The relative risk of second and third birth for women who are over 34 years is about 39% and 32% lower for second and third birth respectively compared to those between 25-29 years. With regard to calendar year, we see a lower relative risk for the last period as compared to the 1989-93 period. The risk for the last period is around 10% and 21% lower for second and third births, respectively, than for the 1989-93 period. We also see a decline or postponement of third births already in the 1994-98 period. Looking at the sex composition of previous children, we cannot see any significant or clear evidence of sex preference among Ghanaian mother in the progression to second and third child.
Examining the effect of socio-cultural variables, we can observe that women with secondary or higher education have a lower risk of second and third births. The risk for women with a higher level of education is about 30% and 20% lower for second and third births, respectively, when compared with women with primary education. We also observe that women with no education have about 15% higher risk at third birth compared with women with primary education. For second births, the relationship was not significant. In terms of the effect of religion on the risk of second and third births, women with no religion have a higher risk at second birth. Their risk of second birth is 16% higher compared to Muslims. The traditionalists have 18% higher risk at third birth third compared to Muslims. With respect to the effect of ethnicity on second and third birth risk, we observe a significant difference. The pattern is similar for both second and third births. The Akans have a significantly higher risk of second and third births than the other ethnic origins. The risk of second birth is 14% higher for women who are brought up in rural areas as compared to their urban counterparts. With regards to third birth, the risk is 11% higher as compared to their urban counterparts.
25 5.2.2 Period trend in second and third birth
In order to get a clear picture of the calendar period, we construct second and third birth risks, relative to 1993, standardized by woman´s age, education level, ethnicity, religion, duration since first & second birth and childhood place of residence.
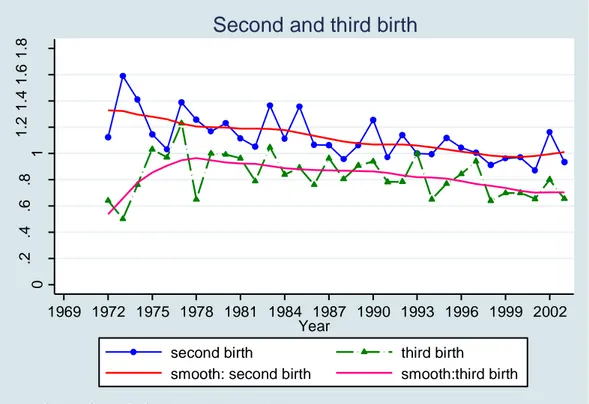
Figure 4: Annual second and third birth risk, relative to 1993, Ghanaian women 1969-2003, by woman´s age, education level, ethnicity, religion, duration since first & second birth and childhood place of residence.
From Figure 4, we can observe that second and third birth risks follow a similar trend after the mid- 1970s. From the early 1980s onwards, we see a gradual decline in second and third birth risks until the end of the study period. Second birth risks have declined gradually about 30% from the mid-1960s until 1996. From 1999 onwards, the trend levels off. With regards to the third birth, the relative risk declined gradually around 20% from the mid-1970s until the early 1990s. We further observe an additional decline of 10% in the risk from the mid -1990s until the end of the study period.
0 .2 .4 .6 .8 1 1 .2 1 .4 1 .6 1 .8 R e la ti ve ri sk 1969 1972 1975 1978 1981 1984 1987 1990 1993 1996 1999 2002 Year
second birth third birth
smooth: second birth smooth:third birth
Source: Ghana DHS, authors own calculations.
26
5.2.3 Interaction effect
Table 5: Relative risk of second and third births for Ghanaian women, by interaction between calendar period and women’s educational level
Calendar Period Women's educational level 1969-1973 1974-1978 1979-1983 1984-1988 1989-1993 1994-1998 1999-2003 Second birth No education 1.28 1.18 1.05 0.93 1.03 0.98 0.98 Primary 0.91 0.91 1.10 1.12 1 0.76 0.82
Secondary and higher 0.57 0.80 0.75 0.71 0.61 0.63 0.56
Third birth
No education 0.68 1.30 1.28 1.16 1.35 1.15 1.02
Primary 2.31 0.89 1.18 0.98 1 1.06 0.96
Secondary and higher 0.01 1.28 1.10 0.96 0.86 0.70 0.66 Source: Ghana DHS, authors own calculations.
Note: The interaction is controlled for all other variables presented in Table 3. The interaction is significant according to the likelihood-ratio test. Second birth: LR chi2 (39) = 997.97 Prob > chi2 = 0.0000 Third birth: LR chi2 (39) = 777.30 Prob > chi2 = 0.0000
Table 5 above and Figure 7&8 (appendix), shows the interaction between calendar period and educational level for second and third birth risk; women with primary education in 1989-1993 were used as the reference category. A look at the results in a column wise direction shows a negative gradient on second birth risk in the late 1960’s to the late 1970’s. This trend reversed in the early 1980’s to the late 1980’s where we see an inverse U-shaped relationship. From the early 1990’s onwards, we again observe a negative gradient like the earlier periods. However, we see somewhat smaller differences across educational level in the risk of second birth compared to the earlier period. We cannot observe any clear pattern in the relationship between women with no education and the risk of second birth over time when we do a row wise examination. We however, see a decrease in the risk of second birth for women with primary education from the early 1990’s. Meanwhile, among the highly educated women, the decrease in second birth risk began in the late 1970’s and declined gradually over time. We see a different trend for third birth risk. If we examine the result in in a column-wise manner, we can see an inverse U-shaped relationship between women’s education and third birth risk in late 1960’s and a U-shaped pattern in the early 1970’s. From the mid 1980’s onwards, the pattern changed where we see mostly a negative gradient for third birth risk. Women with higher education have a lower risk of third birth. A row wise examination indicates a decrease in the risk of third birth from the early 1980’s for women with secondary and higher education. We observed fluctuations in the risk of third births for women with no and primary education over time.
27
5.3 Fourth and fifth birth risk
5.3.1Relative risk of fourth and fifth birth
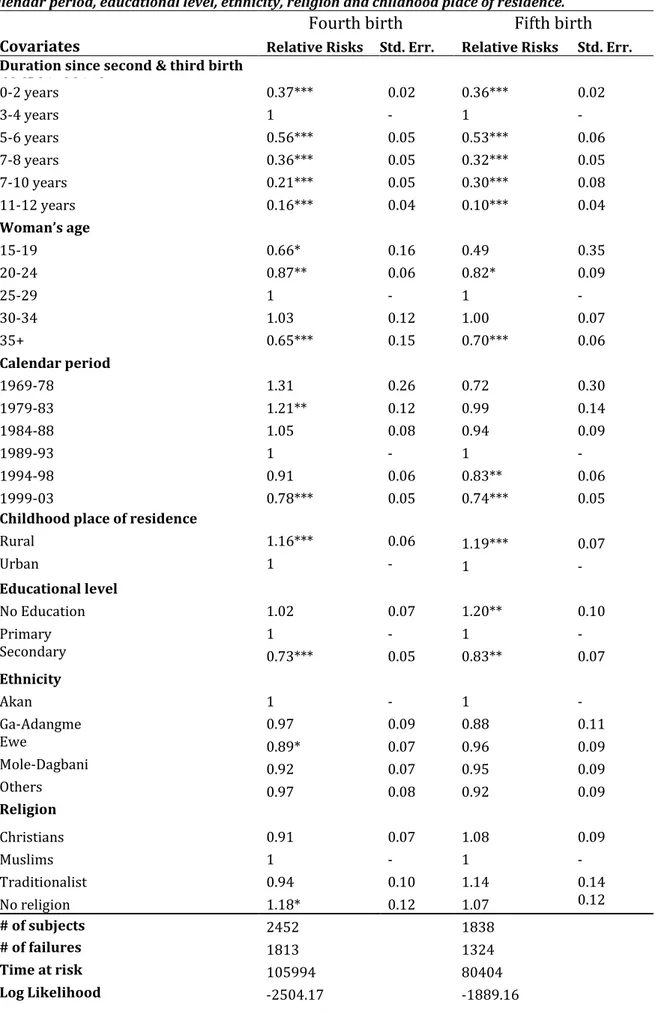
Table 6: Relative risk of fourth and fifth birth. Ghanaian women 1969-2003, by duration, woman’s age, Calendar period, educational level, ethnicity, religion and childhood place of residence.
Fourth birth Fifth birth
Covariates Relative Risks Std. Err. Relative Risks Std. Err. Duration since second & third birth
dfrffbbirthbirth 0-2 years 0.37*** 0.02 0.36*** 0.02 3-4 years 1 - 1 - 5-6 years 0.56*** 0.05 0.53*** 0.06 7-8 years 0.36*** 0.05 0.32*** 0.05 7-10 years 0.21*** 0.05 0.30*** 0.08 11-12 years 0.16*** 0.04 0.10*** 0.04 Woman’s age 15-19 0.66* 0.16 0.49 0.35 20-24 0.87** 0.06 0.82* 0.09 25-29 1 - 1 - 30-34 1.03 0.12 1.00 0.07 35+ 0.65*** 0.15 0.70*** 0.06 Calendar period 1969-78 1.31 0.26 0.72 0.30 1979-83 1.21** 0.12 0.99 0.14 1984-88 1.05 0.08 0.94 0.09 1989-93 1 - 1 - 1994-98 0.91 0.06 0.83** 0.06 1999-03 0.78*** 0.05 0.74*** 0.05
Childhood place of residence
Rural 1.16*** 0.06 1.19*** 0.07 Urban 1 - 1 - Educational level No Education 1.02 0.07 1.20** 0.10 Primary 1 - 1 - Secondary 0.73*** 0.05 0.83** 0.07 Ethnicity Akan 1 - 1 - Ga-Adangme 0.97 0.09 0.88 0.11 Ewe 0.89* 0.07 0.96 0.09 Mole-Dagbani 0.92 0.07 0.95 0.09 Others 0.97 0.08 0.92 0.09 Religion Religion Christians 0.91 0.07 1.08 0.09 Muslims 1 - 1 - Traditionalist 0.94 0.10 1.14 0.14 No religion 1.18* 0.12 1.07 0.12 # of subjects 2452 1838 # of failures 1813 1324 Time at risk 105994 80404 Log Likelihood -2504.17 -1889.16
28
prob>chi2 0.000 0.000
Source: Ghana DHS, authors own calculations.
Notes: *** Significant at the 1% level, ** significant at the 5% level, *significant at the 10% level. See Table C1&C2 (appendix) for Occurrence and Exposure distribution of all covariates for fourth and fifth birth risk respectively.
Table 6 shows that Ghanaian women are prone to have a fourth and fifth birth 3-4 years after the third and fourth birth, respectively. We can see a similar pattern for both second and third births. From the results, we see no difference in birth intervals for any parity. Meanwhile, we can observe that the relative risk of fourth and fifth birth declines as duration increases.The age for both fourth and fifth birth risk shows an inverted U-shape pattern with the peak risk between 30-34 years and falling rapidly towards the end of the reproductive life span. With respect to calendar year, we can observe a lower relative risk for the last period as compared to the 1989-93 period. At the last period, the risk is about 22% and 26% lower for fourth and fifth births, respectively, compared to the 1989-93 period.
In regards to the socio-cultural variables, as expected, we can observe that women with secondary or higher education have a lower risk of fourth and fifth birth. The risk for women with the highest level of education is about 27% and 17% lower for fourth and fifth birth, respectively, when compared to women with primary education. In terms of the effect of religion,we find no strong effect or clear pattern for the risk of fourth and fifth birth. Nevertheless, women with no religious affiliation have the highest risk of a fourth birth. Their risk of fourth birth is about 18% higher than Muslims. We find no strong effect in fourth and fifth birth risk among the various ethnic origins of women. The Ewes have a weakly significant lower risk of fourth birth compared to the Akans. Their risk of fourth birth is around 11% lower. Women who were brought up in rural areas or the countryside have a higher risk of fourth and fifth birth compared to those who were brought up in the urban areas or cities. Their risk of fourth and fifth birth is 16% and 19% higher, respectively, compared to those who were brought up in the cities.
29 5.3.2 Period trend in fourth and fifth birth
Figure 5: Annual fourth and fifth birth risk, relative to 1993, Ghanaian women 1969-2003, standardized by woman´s age, education level, ethnicity, religion, duration since third & fourth births and childhood place of residence.
We can see that the fourth and fifth birth trends are almost, but not quite, identical. With regards to the fourth birth, we can observe a higher relative risk in the mid- 1970s. The risk declined dramatically from the late 1970s until mid-1980s. We however observe a rather gradual decline in the early 1990s until the end of the study period. In the case of the fifth birth, the relative risk is higher in the late 1970s followed by a down turn in the early 1980s.The risk then declined gradually from the mid-1980 until 2003.
5.3.3 Interaction effect
Table 7: Relative risk of fourth and fifth birth for Ghanaian women, by interaction between calendar period and women’s educational level
Calendar period Women's educational level 1969-1978 1979-1983 1984-1988 1989-1993 1994-1998 1999-2003 Fourth birth No education 1.46 1.23 1.07 1.14 1.11 0.91 Primary 1.26 1.53 1.23 1 0.98 0.90
Secondary and higher 1.37 1.10 0.97 0.86 0.66 0.58
Fifth birth
No education 0.70 1.23 1.18 1.27 1.13 0.99
Primary 0.45 1.60 1.05 1 0.88 0.84
Secondary and higher 0.36 0.76 0.98 0.97 0.69 0.60 Source: Ghana DHS, authors own calculations.
Note: The interaction is controlled for all other variables presented in Table 4. The interaction is significant according to the likelihood-ratio test. Fourth birth: LR chi2 (37) = 553.37 Prob > chi2 = 0.0000. Fifth birth: LR chi2 (35) = 405.08 Prob > chi2 = 0.0000
30
From table 7 and Figure 9&10 (appendix), a column wise examination reveals an inverse U-shaped relationship between women’s educational level and the risk of fourth birth in the late 1970’s to the late 1980’s. The propensity to have a fourth birth was highest among women with primary education while women with no and higher education had a lower risk of fourth birth. From the early 1990’s onwards, the pattern transformed, where we see a more negative relationship between the risk of fourth birth and educational level. The effect of secondary and higher education on fourth birth continued to be strong and negative over time. For instance, in the last period, women with secondary and higher education had 36% lower risk of fourth birth as compared to women with primary education. A row wise examination shows a general decrease in fourth birth risk at each educational level over time. The pattern by period with regards to fifth birth differs from fourth birth. The relationship between woman’s education and progression to fifth birth appeared to be mostly negative over the entire time period observed. The propensity to have a fifth child is lowest among women with secondary and higher education, and lower among women with primary education than women with no education. Unlike the fourth birth risk, where we observe a general decrease in birth risk at all levels of education from the mid-1970’s onwards, a row wise pattern examination of fifth birth shows variation over time. However, we can observe a decrease in the fifth birth risk from the mid-1990’s onwards at all levels of education.
6.0 Summary and Conclusions
The Government of Ghana introduced population policies to reduce the population due to the high population growth rate in the mid-20th century; Encouraging girls’ education and increasing contraceptive use were the two main policy measures to reduce the population growth. The free compulsory universal basic education (FCUBE) was introduced in 1995 immediately after 1994 population policy to improve girls’ enrolment as well as improve the primary and secondary level of education. Over the last two decades, educational attainment has improved. The enrolment rate between men and women is virtually not different at the primary level. There exists some gender gap at the secondary and higher level (World_Bank, 2004), but the gap has improved over time (MOE & GES, 2006). Evidence from the Ghana Demographic Health Survey report also indicates an increased knowledge of contraception from 73.8 percent in 1988 to 97.5 percent in 2003.
31
Studies have been conducted to examine the effect of these policy measures on reproductive behavior. Some of these studies used the TFR to examine the impact of these policy measures on fertility; we however argued that the TFR does not give a true picture of women’s fertility behavior because it is a crude measure and might be misleading. The other few studies that examined the role of education in Ghana’s fertility decline, did not observe the effect over time. We therefore argued that since there have been structural changes in the educational system, it is imperative to do a trend analysis in order to detect the effect or non-effect of the policy.
In order to get a clear picture of the childbearing dynamics of Ghanaian women in response to the population policy, we used individual level data on fertility and the proportional hazard regression method to analyze women’s propensities to have a first, second, third, fourth and fifth child from 1969-2003. We hoped to discern the effect or non-effect of the policy and whether women of different educational levels were influenced differently by the population policy.
Our results, according to the standardized annual relative risk, show that first birth risk is relatively higher in the 1970’s until the late 1980’s, and we thereafter observed a gradual decline. For second and third births, we see a decline of about 30% from the mid 1970’s until the early 1990’s and then less change in the late 1990’s. The pattern for fourth and fifth births is slightly different from the lower parities. We observe a general downturn in fourth and fifth birth risk in the late 1970’s and early 1980’s and a gradual decline from the late 1980’s onwards. We speculate that the economic crisis in Ghana from the late 1970s until mid-1980s (Baden, Green, Otoo-Oyortey, & Peasgood, 1994) may have contributed to the dramatic decline in the risk of both fourth and fifth births. During this period, inflation was very high—around 100% (Konadu‐Agyemang, 2000), coupled with a high cost of living and low standard of living among the populace (ibid).The argument of economic conditions as a stimulus for fertility decline is well discussed in the work of Becker (1981). Meanwhile, we cannot attribute the decline after the 1990’s to the population policy since it appears to be part of a longer-term decline.
Aside from the general fertility pattern, we assessed whether the influence of educational level changed over time to discern whether fertility have been influenced by the population policy. The structural changes in the educational sector and widespread knowledge of contraceptive in the mid-1990s and early 2000s after the policy implementation, compared to the earlier periods, might be reflected in birth trends by the level of education over time.
32
We thus expected that women with higher education would have lower fertility compared to those with less education.
The study revealed fertility differentials by level of education over time. Like previous studies in sub Saharan countries, we found a general negative gradient for women’s educational and fertility but our analyses revealed variation over time in the gradient. With regards to first birth, we observed a U shape relationship in the late 1960’s to the late 1980’s. Conversely, from the early 1990’s onwards, the shaped transformed where we see a negative association between education and the risk of first birth. The propensity for first birth during this period was lowest among women with the secondary and higher education and highest among women with no education. Comparing the pattern before and after the policy, this negative association becomes stronger for women with primary and secondary education. The difference appeared to be larger from the mid 1990’s until early 2000’s for these educational levels. For second and third birth, since late 1960’s we observe a general negative association between second and third birth risk. Although we observe a negative gradient over time, the risk of second and third birth becomes weaker over time at all levels of education. The relationship between fourth and fifth birth and women’s educational level is somewhat similar to second and third birth. We see a negative gradient from the 1960’s to the early 2000’s with a clearly strong and negative relationship for women with secondary and higher education compared to women with primary or no education. To sum up, the interaction between calendar period and educational level reveals differences in fertility by educational level. For all births, from the 1990’s onwards, we observe that women with secondary and a higher level of education have a slower transition to the next birth or are less likely to have it at all. This effect grew stronger over time. We also observed that achieving even primary education had some effect on fertility, especially at higher parities.
Consistent with our argument, the negative relationship between women’s educational level and fertility could be attributed to a higher level of women’s autonomy achieved through education. Juxtaposing our findings to the two main theories discussed earlier, we observed that the role of education in fertility decision making cannot be overemphasized. The family planning programs and the universal education program by the government after the 1994 population policy has led to diffusion of contraceptive and increase educational enrolment for women throughout the country. As postulated by the innovation-diffusion theory, well-educated women are early adopters and innovators of contraceptive use. This is evident in the Ghana Demographic Health survey (GDHS) report,