Bibliometric evaluation of
SEPA-funded large research
programs 2003–2013
ULF SANDSTRÖM
REPORT 6636 • DECEMBER 2014
SEPA-funded large research
programs 2003–2013
ULF SANDSTRÖM
SWEDISH EPA ISBN 978-91-620-6636-9 ISSN 0282-7298
Naturvårdsverket utvärderar återkommande sin forsk-ning. Denna rapport är skriven på engelska med svensk samman fattning, och presenterar en bibliometrisk utvärde-ring av sju forskningsprograms vetenskapliga publiceutvärde-rings- och citeringsresultat. Programmen startade någon gång under 2001-2007 och avslutades någon gång mellan 2006 och 2012. Sammantaget citerades de sju programmens artiklar ca 50 % mer än artiklar i genomsnitt inom respek-tive ämnesområde globalt, tre av programmen uppvisade svagare resultat.
The Swedish Environmental Protection Agency (SEPA) evaluates its funded research continuously. This report presents the results of a bibliometric evaluation of the scientific citation performance of seven SEPA research programs, which started sometime during 2001–2007 and ended sometime during 2006–2012. Overall, the relative citation performance was ca. 50% above international reference levels. Three programs had weaker impacts.
Swedish EPA SE-106 48 Stockholm. Visiting address: Stockholm – Valhallavägen 195, Östersund – Forskarens väg 5 hus Ub. Tel: +46 10-698 10 00,
fax: +46 10-698 10 99, e-mail: registrator@naturvardsverket.se Internet: www.naturvardsverket.se Orders Ordertel: +46 8-505 933 40, The author assumes sole responsibility for the contents of this report, which therefore cannot be cited as representing the views of the Swedish EPA.
SWEDISH ENVIRONMENTAL PROTECTION AGENCY
of SEPA-funded large research
programs 2003–2013
E-mail: natur@cm.se
Address: Arkitektkopia AB, Box 110 93, SE-161 11 Bromma, Sweden Internet: www.naturvardsverket.se/publikationer
The Swedish Environmental Protection Agency
Phone: + 46 (0)10-698 10 00, Fax: + 46 (0)10-698 10 99 E-mail: registrator@naturvardsverket.se
Address: Naturvårdsverket, SE-106 48 Stockholm, Sweden Internet: www.naturvardsverket.se
ISBN 978-91-620-6636-9 ISSN 0282-7298 © Naturvårdsverket 2014 Print: Arkitektkopia AB, Bromma 2015 Cover photos: Jesper Johansson, Örebro University
Preface
The Swedish Environmental Protection Agency (SEPA) continuously evaluates its research according to the following criteria: 1) Process 2) Relevance in rela-tion to 16 Narela-tional Environmental Quality Objectives and 3) Scientific quality.
Bibliometric methods concerning publication and citation performance were applied for the last criterion and the results are presented in this report. Seven research programs which started sometime during 2001–2007 and finalized during 2006–2012 were investigated. The research programs reach over subject areas and issues such as climate change adaptation, methods for public participation, enforcement of environmental law, statistical methods to assess and discern environmental change, life-cycle based decision support systems, wildlife and fish management, and how environmental policies and intentions are perceived by citizens.
Professor Ulf Sandström – Örebro University – who also carried out a similar bibliometric evaluation of SEPA research programs in 2009, was com-missioned by the SEPA to undertake the analysis. He alone is responsible for all evaluations in the report. Dr Per Sjögren-Gulve, principal research officer at the Research & Assessment Department, has been the SEPA project leader of the study.
The Swedish Environmental Protection Agency in December, 2014. Eva Thörnelöf, Director
Contents
PREFACE 3
SAMMANFATTNING 6
SUMMARY 7
THE BIBLIOMETRIC STUDY 8
SEVEN RESEARCH PROGRAMS 9
QUESTIONS FOR THE EVALUATION 13
DATA – VALIDATION AND CONCERNS 16
PROGRAM OUTPUT ANALYSIS 21
1. ALL TEAM MEMBER SCHOLARLY PUBLICATIONS 22
2. TEAM MEMBER SCHOLARLY PUBLICATIONS REPORTED TO SEPA 49
3. GOOGLE SCHOLAR DOCUMENTS AND CITATIONS 54
CONCLUSIONS 56
APPENDIX 1: THEORIES AND METHODS IN EVALUATIVE BIBLIOMETRICS 57
APPENDIX 2: PUBLISH OR PERISH 71
Sammanfattning
Naturvårdsverket inledde 2001–2002 en satsning på större forsknings-program, vilka finansierades över en femårsperiod. I denna rapport utvärde-ras, med tonvikt på bibliometriska metoder, sju av de program som startades i slutfasen av denna programsatsning.
Inledningsvis kan konstateras att en huvudsaklig effekt har varit att ge förutsättningar för ett 30-tal nya forskare att med sina avhandlingar bidra till forskningsområdets expansion. I takt med att ett antal av dessa flyttar till andra verksamheter i företag och myndigheter kommer samhällets absorp-tionsförmåga av ny kunskap inom området att förbättras.
Publiceringar i vetenskapliga tidskrifter utgör navet för utvärderingen och de specifika metoder som tillämpas bygger på idén att normalisera antalet artiklar och antalet erhållna citeringar till jämförbara områden.
Analysen har i första hand inriktats på de artiklar som forskarna själva, enligt sina slutrapporter (eller motsvarande), redovisat som resultat av pro-gramrelaterade aktiviteter. Utöver detta har analyser utförts dels på publice-ringar som hänför sig till programandeltagarnas samtliga publicepublice-ringar under programperioden dels på de publiceringar som på motsvarande sätt indexerats i Google Scholar. Dessa båda senare undersökningar ger i huvudsak resultat som är något svagare än analysen på basis av egenrapporterade publiceringar.
Noterbart är att påfallande få av de publiceringar som programmen uppger vara relaterade till Naturvårdsverkets finansiering har uppgett finan-siären i sina tack och tillkännagivanden, dvs. funding acknowledgements.
Vad gäller produktivitet, dvs. antalet producerade artiklar i relation till nordiska referensvärden, uppvisar programmen en nivå som ligger i paritet med eller högre än vad som kunde förväntas av forskare inom dessa områden. I klara verba betyder det att Naturvårdsverket fått förhållandevis god utväx-ling på insatta resurser.
Med avseende på citeringsgrad – påverkan på internationella kolleger inom de vetenskapliga nätverken – har utfallet varit likaledes gott om vi ser till den generella nivån. Med en citeringsgrad som uppgår till närmare 50 procent över världsgenomsnittet har Naturvårdsverket finansierat starka forskar grupper även om intrycket dras ned av att tre av sju program har förhållandevis svaga prestationer.
Tar vi forskningsprogrammen inrapporterade publikationer till utgångs-punkt erhåller vi följande: Ett program uppnår en nivå som motsvarar högsta betyg, dvs. Outstanding. Ett annat program uppnår nivån Excellent och ytterligare två program får betyget Very Good. Vidare har två program en citeringsgrad som motsvarar betyget Good. Slutligen ges ett program, som till följd av låg aktivitet inte når tillfredsställande nivåer, betyget. Insufficient. Betygssättningen bygger på drygt trehundra svenska forskargrupper som varit inbegripna i olika finansieringsprogram för excellens och starka forsknings-miljöer (se nedan sid. 66–67).
Summary
In 2001–2002 the Swedish Environmental Protection Agency (SEPA) initiated an investment in larger research programs, funded over periods of six years. This report evaluates, with emphasis on bibliometric methods, seven of the programs established in the final phase of this initiative. The programs started around 2003–2004, in one case a bit later, and ended around and after 2010.
Initially, it can be stated that one of the program’s primary effect has been to allow for more than 30 young scientists to contribute to the expansive research area with their dissertations. A number of these PhDs will in due time move to other activities in companies and government agencies and at the same time society’s absorptive capacity for new knowledge in the environ-mental field will be expanded and transformed.
This main message of this report concerns the publication production and citation performance of researchers within the above mentioned seven research programs. Papers published by more than 100 researchers are com-pared with papers published by their international colleagues during the same time period and in the same areas of science.
The analysis primarily focuses on those scientific papers the researchers themselves have reported as a result of program-related activities. In addition, analyses have been carried out based on (1) all publications from all program members in the Web of Science database, and (2) on all team member publi-cations similarly indexed in Google Scholar. These latter two studies provide results which basically indicate lower performances than the analysis based on self-reported publications.
It is worth noting that remarkably few of the publications specifically men-tioned the SEPA as financier in the respective “funding acknowledgements” in the articles.
Concerning publication productivity, i.e. production of papers in relation to Nordic reference values, the SEPA funded programs exhibit an activity at levels that would be expected by researchers in these areas. This implicates that the Swedish Environmental Protection Agency is likely to have received results in parity with the resources invested.
With respect to the relative citation performance, the outcome was even better, about 50 per cent above international reference levels. Therefore, the impression is generally very good but the evaluation points out that three out of seven programs have weak impact.
Concerning the grading of each programme based on self-reported publi-cations: One of the research programs achieved levels equivalent to the high-est rating, i.e. Outstanding. Another program reached the level of Excellent. Two programs had a citation score that corresponds to the grade Very Good and two programs were rated as Good. Finally, one program with low level of activity, did not achieve satisfactory levels, i.e. Insufficient.
The bibliometric study
Background
The objective of the study is a bibliometric analysis based on citations to pub-lications from the following SEPA research programs: ADAPT, Climatools,
ENFORCE, ENGO, FLIPP, MIST and SHARP. In the analysis there is one
research program – Climatools – which was started as late as 2007, years after the other mentioned programs. Five years of funding is quite unusual in the Swedish research system but there are exceptions to that rule as the strategic foundation MISTRA since 1995 has initiated a number of long-term managed programs with funding up to ten years. The second round of SEPA programs consisted of seven programs funded with 200 MSEK in total over the program period. That was a considerable share of SEPAs total research funding as the budget was not larger than about 80 MSEK per year.
Table 1. Program, Duration and Funding123
Program ABBR Start Yr End Yr MSEK1
Adaptive Management of Wildlife ADAPT* 2004 2009 40
Climatools2 CLIMA** 2007 2012 20
Enforcing Environmental Law in Europe ENFORCE 2003 2008 20
Assessment of Environmental Goal …3 ENGO 2001 2006 20
Furthering Life Cycle Considerations FLIPP 2001 2006 40
Tools for Environmental Assessment MIST 2001 2006 40
Sustainable Households SHARP 2002 2007 20
Note: *Abbreviation used in this report. **Climatools is often abbreviated CLIMA in this report. Source: Naturvårdsverket – Swedish Environmental Protection Agency.
1 http://www.cere.se/sv/forskning/forskningsprojekt/158-adaptiv-foervaltning-av-vilt-och-fisk.html 2 http://www.foi.se/sv/Kunder--Partners/Projekt/Climatools/Climatools/Kontakt/
Seven Research Programs
This section goes a little further into the specific research programs to reflect the specific objectives that they worked with. The following is entirely based on text from their funding applications, from websites or from reports to the financier:
ADAPT (Adaptiv förvaltning av vilt och fisk)
“The program’s overall objective can be summarized as follows, namely: developing: (1) a scientific basis for adaptive management of wildlife and fish populations, (2) an integrated communication between management and research. Stimulate: (1) scientific collaboration between researchers in wildlife and fish oriented disciplines, (2) close cooperation between different scientific disciplines in the natural and social sciences, (3) international coop-eration. (4) Transferring knowledge to local, regional and national manage-ment of fish and wildlife. (5) Taking a national perspective and responsibility. (6) Educating a new generation of researchers with a broad scientific base.” (From the program proposal/application)4
Unfortunately, the program web site is no longer available.5
“Perhaps Sweden has never before had more wildlife animals than now. Swedes are a growing population, but fewer and fewer people live in rural areas in close contact with wildlife and its habitats. Yet engagement in wild-life policy questions getting stronger, and many issues are both important and controversial. How big the Swedish moose population should be is a matter of great socio-economic importance. The large carnivores evoke strong emo-tions. The book “Wildlife, Man, Society” is aimed at anyone who is interested in hunting and wildlife issues in a changing environment.” 6 [from one of the
main results from the project: a book published by Liber Publishing House (2010) with the title: Vilt, människa, samhälle. 320 pp.; Eng.: “Wildlife, Man, Society”.]
4 Programmets övergripande målsättning kan sammanfattas på följande sätt, nämligen att: Utveckla: (1)
en vetenskaplig bas för adaptiv förvaltning (AF) av vilt- och fiskpopulationer; (2) en integrerad kommu-nikation mellan förvaltning och forskning. Stimulera: (1) vetenskapligt samarbete mellan forskare inom vilt- och fiskorienterade discipliner; (2) nära samarbete mellan olika vetenskapliga discipliner inom natur- och samhällsvetenskap; (3) internationellt samarbete. Överföra kunskap till lokal, regional och nationell förvaltning av vilt och fisk. Ta ett nationellt perspektiv och ansvar. Utbilda en ny generation forskare med en bred vetenskaplig bas.” (Ansökan)
5 http://www.cere.se/sv/forskning/forskningsprojekt/158-adaptiv-foervaltning-av-vilt-och-fisk.html 6 “Sverige har kanske aldrig haft mer vilt än nu. Vi svenskar är också fler än någonsin, men allt färre bor
på landsbygden i nära kontakt med viltet och dess livsmiljöer. Ändå engagerar viltet allt fler och många frågeställningar är både viktiga och kontroversiella. Hur stor den svenska älgstammen ska vara är en fråga
Climatools
“In short: The aim is to develop tools for climate change adaptation.”
“The main task of CLIMATOOLS is to develop new tools that can be used for climate adaptation work by sectors and local/regional authorities. The main focus is the capacity to handle uncertainties relating to climate change in the short-term and the long-term. (The program) plan to develop the following eight new tools and test these out in collaboration with practitioners: 1) A new decision support tool – scenario-based convergence seminars – designed to deal with adaptation to climate change. 2) Scenario templates that facilitate the development of local scenarios for decision support to local and regional decision-makers. 3) Methods for adaptability analyses, based on vulnerability methods. 4) Guidelines for assessment of health impacts associated with cli-mate change. 5) Guidelines for economic analysis of clicli-mate change and adap-tation to it. 6) A manual describing the methods that can be used to handle goal conflicts that arise as society adapts to climate change. 7) A manual for the inclusion of gender issues in climate adaptation work. 8) A checklist that can be used to detect and handle ethical problems that arise as society takes measures to adapt to climate change.” (From proposal/application)7
ENFORCE
“The overall objective of the programme is to find appropriate public law instruments and procedures for the purpose of enforcing environmental law, including both the means for supervisory authorities and criminal sanctions and, not least important, the interaction between supervisory means and the sanctions. The methodology is comparative: Analyses of different European administrative and criminal law systems on the environmental area, concen-trating on organisational matters and the authorities’ access to instruments for enforcing. As indicated above, a thorough comparison of different national systems would surely reveal both similarities and differences and give rise to fruitful general discussions on the appropriateness of different alternatives.”
“The programme will put much effort on the comparison of the role of environmental authorities. Firstly, the programme will focus on the authori-ties’ use of classic tools of administrative law and criminal law and the inter-action between these rules. The relation between the supervisory authorities and the courts will be discussed. Also the authorities’ possibility to use civil law instruments will be analysed. Secondly, the programme will discuss how the public law instruments could be developed and improved in order to more efficiently reach the environmental objectives, reflected in the basic material legal instruments. A vital part of this discussion will of course be the relation between national enforcement instruments and the demands from EC-law and the European Convention on Human Rights.” (From proposal/application)
7 At <http://www.foi.se/sv/Kunder--Partners/Projekt/Climatools/Climatools/Kontakt/ > information on the
ENGO
“ENGO is an interdisciplinary research programme in which the development of tools and procedures for data analysis are integrated with studies of com-munication processes between scientists and practitioners and between different levels of the environmental administration. More specifically, the programme aims to:
(I) develop generic principles and user-friendly software for extracting anthro-pogenic signals from environmental data influenced by natural variation; (ii) develop cost-effective procedures for the collection of multivariate
environ-mental data and the evaluation of temporal changes in such data;
(iii) identify and handle obstacles for communicating progress or lack of pro-gress towards environmental quality objectives.
Special attention will be paid to the handling of different forms of uncertainty that may impair the estimation, interpretation and communication of tempo-ral changes in the indicators that shall be used to follow up and assess goal achievement.” (From proposal/application)8
MIST
“The MiSt-programme is applied, multidisciplinary striving towards interdis-ciplinarity. Research is carried out in co-operation and interaction with agen-cies, organisations and other stakeholders. The programme is proposed as an integrated network with major other research projects giving an added value. Projects in three themes: SEA-implementation: processes and tools for assess-ment of programme and plans but also of national policy for sustainability and implementation at regional and local level. Scenario techniques: application in strategic decision-making, policy and regional/ local planning. Effectiveness of tools and combinations of tools in complex processes of policy, planning and implementation; especially the use of environmental systems analytical tools. There are two “horizontal perspectives”: (1) Public participation: Methods of effective and efficient public participation at different levels; the problem of openness and transparency in pursuing complex scientific or technical tools and in complex processes of decision-making; the meaning of participation at different levels of decision making. (2) The issue of effectiveness of regulation of tools and processes. The programme addresses decision-making in existing decision structures and under change. There are four components: Concurrent programme activities aiming at integrating projects; concrete, empirical research projects; Future research preceded by exploratory projects; Synthesis and sum-mary including communication with users.” (From proposal/application)
FLIPP
“The FLIPP program aims at developing knowledge and understanding of the dynamics, mechanisms and interactions in complex product chains necessary to underpin life cycle based decision support systems. The knowledge gener-ated from its multidisciplinary applied research approach aims to support poli-cymakers in decisions on how and when to intervene in product chains, when to facilitate processes already set in motion by market actors and when to leave be. It will also support the actors in the product chains, in their chain-related decisions, such as procurement, product design, production and marketing.
The program will strengthen Swedish research on product-oriented envi-ronmental policy. The research projects are adjusted to the needs of relevant users, primarily policymakers and businesses. The program will create a national competence centre for Swedish research within the field, and be a main actor on the international arena. The research will have two main focus areas: 1) the relations between different actors within the product chain (the industry perspective), and 2) the possibilities of governments to control the environmental impacts in the product chain (the policy perspective). Research in these two areas has traditionally been divided, and FLIPP aims to better integrate the two perspectives.” (From proposal/application)
SHARP
“The multi-disciplinary SHARP Program combines political, economic, legal, psychological and time-geographical methods and employs a bottom-up spective to understand how environmental policies and intentions are per-ceived and implemented within Swedish households. The overall objectives of the proposed project are to: (a) investigate the correspondence between environmental policy intentions and the environmental values and attitudes held by households; (b) explore the resource constraints that people face when engaging in ‘sustainability’-promoting activities in their daily life, and how they choose to organize their activities given these constraints; and (c) use this information to clarify under what circumstances different environmen-tal policies will be effective and perceived as legitimate.” (From proposal/ application)9
The program produced one edited book published by the Earthscan publishing company: Environmental policy and household behaviour :
sustainability and everyday life / edited by Patrik Söderholm and with
chap-ter contributions from each of the team members. The book was published in 2010.
Questions for the evaluation
This evaluation was commissioned by SEPA to undertake a bibliomet-ric investigation of the above mentioned programs. The report presents a detailed bibliometric analysis based on publication data from 2003–2012. The main question to be answered through the analysis concerns the perfor-mance of groups in two dimensions: 1) production perforperfor-mance (productivity
of research); and 2) citation performance (“quality” of research)10.
This is the second bibliometric evaluation of SEPA long-term programs. The first report (Sandström 2009) also evaluated seven programs; the results were overall promising and positive. However, due to different publication cultures an additional approach to the performance question is used in this report. This subsequent report will add Google Scholar metrics in order to be able to evaluate other types of output than the usual scientific publications indexed in Web of Science.
Output and Impact of research
The evaluation is based mainly on a quantitative analysis of scientific articles in international journals and serials processed for the Web of Science versions of the Citation Indices (SCI, SSCI and A&HCI). Therefore, the first part of the report is not a bibliographic exercise trying to cover all publications from the SEPA-funded researchers. Instead, the focus is put on contribution in scientific journals which are indexed by their references and thereby making it possible to measure impact and use by colleagues all over the world.
The Web of Science database represents roughly 90 per cent of the most prestigious journals and serials in major fields of science. The database was set up in the early 1960s by an independent research-oriented company in order to meet the needs of modern science in library and information services. Evidently, the database is also a valuable asset for evaluative bibliometrics as it indexes the references in articles and connects references to articles (cita-tions).
With the Web of Science it is known what types of material are included, scholarly (refereed) journals and no more, with all other databases (except for Scopus) there are included many different types of data, which makes it more or less impossible to judge whether the impact is coming from the scholarly side or from any other side. As will be dwelled upon in the theoreti-cal chapter, scholarly contributions cannot be judged by stakeholder groups but has to be scrutinized in a peer process before it is concerned as accepted (core) knowledge.11
Another consideration that has guided the evaluation approach is a require-ment to make use of multiple indicators in order to describe the complex pat-terns of publications from research programs performed by universities and research institutes. The study makes use of several methods, each deepening the understanding generated by the publication output from a different angel of incidence. No single indices should be considered in isolation.
Publications and citations form the basis of indicators used. Citations are a direct measure of impact; however, they measure the quality of an article only indirectly and imperfectly. Whilst we can undoubtedly measure the impact of a research unit by looking at the number of times its publications have been cited; there are limitations. Citation-based methods enable us to identify excel-lence in research; these methods cannot, with certainty, identify the absence of excellence (or quality).
However, the research programs scrutinized in this evaluation are not only scientific exercises, they are to a large extent devoted to and understood as applied research undertakings. Therefore, it is necessary to put forward the question on what other types of results and outputs are there from the respec-tive programs. Partly, this will be answered in a companion evaluation report (Professional Management, 2015), but, here, is first to be discussed whether it is possible to evaluate research without taking these results into considera-tion? To answer that question we go to the theory of bibliometric peer review.
Bibliometric peer review
Why bibliometric peer review? The reason is simple and alludes on everyday scholarly behavior; every time a scientific colleague uses an article produced by a SEPA-funded researcher comprises a valuation of the article; is it valuable and instrumental for that specific peer? The stream of articles is thus forming a base for calculations on the number of such collegial decisions made by the respective researchers. Together, these decision processes build a large amount of material that can be normalized and calculated so that it can form the basis for a scientific evaluation. This valuation is based on systematic methods and does not lend itself to random factors like selection of assessors or alike. Bibliometric peer review is the only way to implement peer review in a way that is stable over time, comparable over time, and should be fair and provide interpretable results. Bornmann & Marx (2013) calls it the wisdom of crowds and this wisdom can only be held by the large group of peers. In the words of Thomas Kuhn: ”For a scientist, the solution of a difficult conceptual or instru-mental puzzle is a principal goal. His success in that endeavor is rewarded through recognition by other members of his professional group and by them alone.” (Kuhn, 1970, p.21).
This study is based on a quantitative analysis of scientific articles pub-lished in journals and serials processed for the Web of Science (WoS) versions of the Science Citation Index and associated citation indices: the Science
Citation Index (SCI), the Social Science Citation Index (SSCI), and the Arts & Humanities Citation Index (A&HCI). Using advanced bibliometric tech-niques, it assesses the publication output and citation impact of research performed within the above mentioned SEPA funded programs. Non-serial literature is included in the alternative analysis (part three) based on Google Scholar.
Impact, as measured by citations, is compared with worldwide reference values. Citations to articles until August, 2014 are used for the analysis. The investigations reported here use a decreasing time-window from the year of publication until August, 2014. However, some of the indicators are used for time-series and in these cases a fixed two year citation window is applied. Publications from year 2003 receive citations until 2005; publications from 2004 receive citations until 2006 and so on.
Productivity of research is measured using a model for Field Adjusted Production (FAP, see Appendix 1) developed for the Swedish Ministry of Education (SOU 2007:81). In that model, paper production is compared to reference values based on Nordic “normal researchers” production (for a mathematical expression see Appendix 1).
Indicators used in the report are listed in Table 2.
Table 2. Sample of Indicators Used in the Report
1 P NUMBER OF PAPERS Number of papers (articles, letters and reviews) during 2003-2012.
2 Frac P NUMBER OF
FRACTIONALIZED PAPERS Sum of author fractionalized papers (articles, letters and reviews) published during 2003-2011.
3 FAP FIELD ADJUSTED
PRDODUCTION Sum of weighted papers based on Nordic reference values 2008-2011.
4 NCSj JOURNAL NORMALIZED
CITATION SCORE CPP normalized in relation to the unit journal set (average=1.00).
5 NJCS NORMALIZED JOURNAL
CITATION SCORE The impact of the journal set normalized in relation to its sub-fields (average=1.00).
6 NCSf FIELD NORMALIZED
CITATION SCORE CPP normalized in relation to the sub-field set (average=1.00).
7 TOPx% TOP x% Percentage of papers above the xth citation
percentile.
8 VITALITY REFERENCE RECENCY Mean reference age normalized in relation to the sub-field set (average=1.00,
higher=younger).
A further description of citation indicators and the bibliometric approach is given in Appendix 1 “Theories and Methods in Evaluative Bibliometrics”.
Data – validation and concerns
The SEPA administration made available the applications and final reports from each program. How is research done in each program adequately repre-sented? Should we focus on program leader’s activities or all researchers that has been involved? Should the focus be put on program-related activities only, distinguishing to other activities? If the latter is the case, then a full analysis of all papers from researchers would cover too much as some probably have been involved in work not funded by SEPA. Several other financing arrange-ments are usually set in motion together with (almost) any program fund-ing. Accordingly, it is necessary to clarify the options for a more delimited approach.
In the current bibliometric evaluation, lists of publications from the respective programs final reports and/or the program websites are used. In consequence, for some programs PhD students and other research personnel are among the personnel publishing from the programs as they are presented as researchers with a connection to the program. In all, the list of researchers consists of more than 100 researchers from the seven research programs. The former evaluation report (Sandström, 2009) made a more detailed analysis of data and material and could show that there were only small parts of the publishing activities that would be missed with a strategy focussing on the senior personnel but that does not seem to be the case in the current evalua-tion. Furthermore, an exclusive focus on the senior personnel would include too many publications without relevance for the SEPA initiative. Therefore, in this report results are shown using several different and complementary strategies.
Limiting the exercise to publications related to SEPA funded research only is, of course, a question of highest sensitivity. It has been possible to identify a list of publications from each program even though some have been more challenging to find than others. Combinations of reports to SEPA and docu-ments on web pages have made it possible.
Still, there are problems concerning how to interpret the question of what to evaluate. One example: the ADAPT program, which is one of the two largest considering the level of funding (40 MSEK), have listed about 100 publications in their final report. When searching for all their Web of Science papers many more papers from these researchers show up. Numbers indicate that only 40 per cent of the total production from the group is listed in the final report. Consequently, this can be taken as an indication that researchers reports can be trusted and that researchers do not play the game.
At the same time there are room for using the margins as there are no clear-cut distinctions between different projects and programs. The actual time period for the SEPA initiative can be characterized as a moment in Swedish research policy when almost all financiers, public and private, joined
the bandwagon and went for large-scale funding. Strategic research centres, Linnaeus grants, strong research environments etc. are all examples of this Zeitgeist (for further discussion, see Sandström, Wold et al. 2010).
A couple of the SEPA programs do have joint personnel and joint pub-lications, ADAPT and CLIMA, as is shown in Figure 1. Two of the leading researchers in the ADAPT program were also included in applications for strong research environments financed by Formas. In connection to this it should be mentioned that a couple of researchers are visible in two different SEPA programs (illustrated with connections to the left).
SEPA FORMAS ADAPT Climatools ENFORCE ENGO FLIPP MIST SHARP RESILIENCE FUNC FIBER LAKE ECOSYST MICROBIOMICS FUNC GENETICS
Figure 1. Relations of the SEPA research programs to programs financed by the research council Formas
In all, the amount of information that has been funnelled to the evaluation, including the modified validation of program-related publications, provides a rather solid foundation for a thorough bibliometric description of the research performed based on grants from SEPA.
The period covered extends into 2013 when the last granted group, Climatools, delivered their final report to SEPA. Several programs were, as mentioned above in Table 1, finished way before and publication lists ends at about 2009-2011.
For Web of Science publications (with some exceptions depending on the question under discussion) the analysis can use data until 2013, e.g. acknowl-edgement data.
For citation analysis the time period is restricted to publications until 2012
with citations up until 2014.
Depending on when the program was started all publications during the program period have been used and performance data are given per year in order to make possible the detection of whether the program years coincide with better or less good performance from the group.
Figure 2 shows the publishing activities (in Web of Science) for the ADAPT sub-program leaders in two different ways:
1. (legend 1) Inside the SEPA programme (publications listed in final report) 2. (legend 0) Outside the SEPA programme (all publications)
Figure 2. ADAPT Sub-Program Leaders Inside (1) and Outside (0) Publications Over Time.
This illustrates that the SEPA program does not affect the total activities from the ten sub-program leaders (of the ADAPT program). Measured in article fractions (Frac P) they do 4–5 full articles per year. The start of the ADAPT program in 2004-2005 decreases the rate of publication as it takes time to hire personnel (PhD:s) and to organize and relate the different projects to the over-all goal of the program. ADAPT had nine different projects to integrate and four of them had more than five researchers involved.
During the program period of 2006-2010 almost all publications are devoted to the ADAPT program (blue and red lines in Figure 2 are close to each other). Finishing the project in 2010 seems to implicate harmful effects to production; there are many things that have to be handled, e.g. the final report, dissertations, administrative work etc. Among them are, of course, applying for new funding from agencies and councils, and finding job oppor-tunities for PhDs involved in the program.
Evidently, there’s an increase in publications when all personnel in the pro-jects are included. That would be expected – to some extent there are people from other areas (in the ADAPT political science was included) and a number of new people (PhDs) were invited to do scientific work together with senior scientists.
That said, it should be mentioned that there is a lack information for two programs: There was no final report with lists of publications from FLIPP (Lund University), but that could be built from information from the web site of the research nexus (the project leader) and those publications that could be related to the program. The same applies for ENFORCE (Uppsala & Lund University) which has not produced a final report. From the latter program it is known that there are two manuscripts and one dissertation considered as output.
Acknowledging SEPA
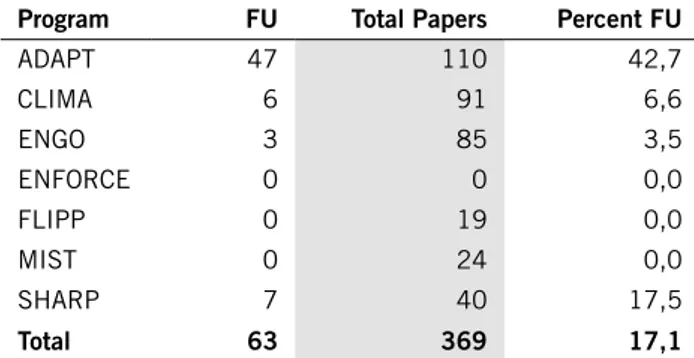
Normally, research papers hold information on organizations that have sup-ported the research financially. This information has been included into the bibliographical information by indexing companies, e.g. Web of Science (WoS) and is available on a larger scale since 2008. Financial information is available for about 60–80% of papers in several areas, but the coverage varies for spe-cific journals. The number of articles with funding acknowledgement to SEPA is displayed in Table 3.
Table 3: Number of Funding Acknowledgements to SEPA per Program
Program 2006 2008 2009 2010 2011 2012 2013 Total ADAPT 1 3 9 15 20 20 15 83 CLIMA 1 2 2 1 3 9 ENGO 1 1 1 4 7 ENFORCE 0 FLIPP 0 MIST 0 SHARP 3 2 1 1 1 1 9 Total 1 7 14 19 23 25 19 108
Although it is a large scale funding scheme the number of articles that acknowledges SEPA funding is quite low, especially if we do not count the ADAPT program. ADAPT do have a considerable part of the total number of articles. Actually, there are programs that do not acknowledge SEPA at all. The FLIPP program is one example of this as they have published a number of articles and these articles do have funding acknowledgements, but not to SEPA. See Table 4 for further details on this. The percentage of papers with acknowledgement is low, not more than one fifth of papers do have an acknowledgement to SEPA. For the two programs with zero credits to SEPA, FLIPP and MIST, the former mainly credits Formas and the latter MISTRA and Formas.
Table 4. Articles Acknowledging SEPA 2008‑2011 in Relation to Total Articles Program FU Total Papers Percent FU
ADAPT 47 110 42,7 CLIMA 6 91 6,6 ENGO 3 85 3,5 ENFORCE 0 0 0,0 FLIPP 0 19 0,0 MIST 0 24 0,0 SHARP 7 40 17,5 Total 63 369 17,1
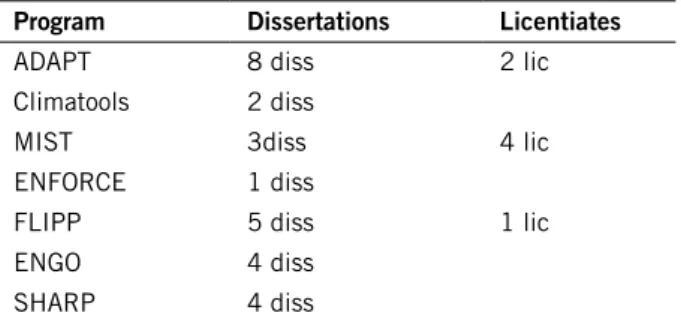
Output - PhD Students
Many of the sub-programs to the respective research programs have been able to recruit PhD-students based on the SEPA funding. This is probably one of
the main effects of the SEPA long term initiative.
Table 5. Number of Dissertations per Program
Program Dissertations Licentiates
ADAPT 8 diss 2 lic
Climatools 2 diss
MIST 3diss 4 lic
ENFORCE 1 diss
FLIPP 5 diss 1 lic
ENGO 4 diss
SHARP 4 diss
Source: Final reports to SEPA; www.libris/kb.se; http://www.sea-mist.se/tks/mist.nsf/bilagor/ Intro_%20Lars%20Emmelin_pdf/$file/Intro.%20Lars%20Emmelin.pdf
Basic and/or applied research
In view of the above it would be unwise to perform an evaluation without taking the project aims into consideration, but how should that be done? What would it mean to take the applied aims into account? First, we assume that if and how the respective programs are connected to the international research front is of vital importance for those who are to follow or assess the recommendations given from the research programs. This we can only assess if we have a look at the knowledge base used in articles or reports that dis-cusses different types of recommendations and guidelines.12
Program output analysis
The output analysis will be organised into three different parts:
1. Scholarly WoS publications from all team members of the respective SEPA programs over the actual program period (starting 2003 and end-ing 2012);
2. Scholarly WoS publications listed in the final reports to SEPA;
3. Publish or Perish registered publications (based on Google Scholar) from all team members of the SEPA program.
1. All team member scholarly
publications
First, in Table 6 is highlighted the results based on all publications by all
(identified) team members, where the time periods have been restricted to the actual duration of each program depending on start and end of financing from SEPA. In short, Table 6 gives an overview and account of the performance for all groups taken together, and given the conclusions from Figure 2 above, it should give a fairly good account of program activities.
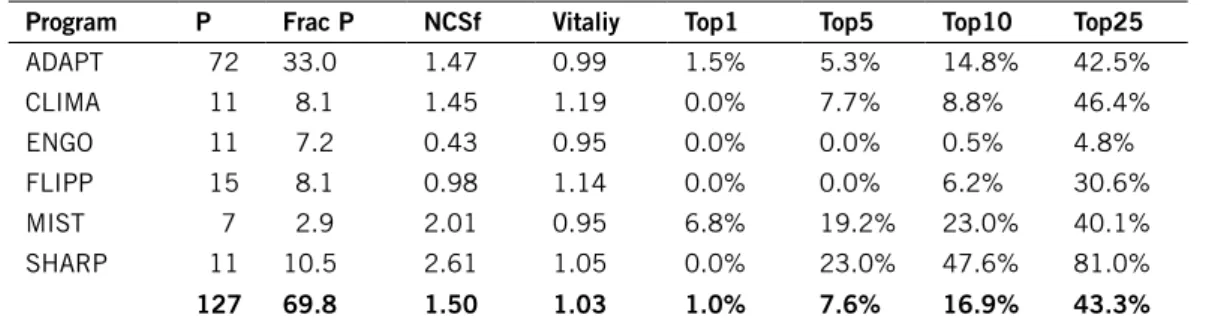
The NCSf indicator, the field normalized citation score and the most inter-esting indicator in this evaluative context, points to a performance just above the normal levels for Swedish universities (1.15). Also, the TOP5%-indicator suggests performance on par with expected values.
Table 6. Results by Indicator (all programs) all years (2003‑2012) Name of Indicator Indicator Result
Number of papers Full P 457
Number of fractionalized papers Frac P 213
Field normalized citation score NCSf 1.24
Percentiles, above the 95th TOP5% 4,5%
Reference recency VITALITY 1.00
Source: Web of Science Online.
Note: Global averages are 1.00 (SCSf average is 0.00), except for TOP5%.
Secondly, the following pdf-pages (automatically created from the
bibliomet-ric tool BMX) for each program are analyzed using indicators, especially the NCSf(2yr) indicator, statistical diagrams and visualizations for publication profile and collaboration network inside of the program. Each program is illustrated using four pages (Illustration 1-6). N.B! There is no illustration for the ENFORCE program due to lack of publications.
2005 2006 2007 2008 2009 2010 2011 5 10 15 20 25 30 35 40 45 50 2005 2006 2007 2008 2009 2010 2011 0.25 0.5 0.75 1.00 1.25 1.50 1.75 2.00 2.25 2.50 adapt
PROJ_ADAPT_2014_V3 - BIBLIOMETRIC INDICATORS
NUMBER OF PAPERS (P) 190
Number of papers (articles, letters and reviews) published by UoA "proj_adapt_2014_v3" during 2005-2011.
NUMBER OF FRACTIONALIZED PAPERS (Frac P) 64.0
Sum of author fractionalized papers.
CITATIONS PER PAPER (CPP) 15.0
Number of citations per paper.
JOURNAL NORMALIZED CITATION SCORE (NCSj) 0.99
CPP normalized in relation to the UoA "proj_adapt_2014_v3" journal set (average=1.00).
NORMALIZED JOURNAL CITATION SCORE (NJCS) 1.32
The impact of the journal set normalized in relation to its sub-fields (average=1.00).
FIELD NORMALIZED CITATION SCORE (NCSf) 1.20
CPP normalized in relation to the UoA "proj_adapt_2014_v3" sub-field set (average=1.00).
SUM OF FIELD NORMALIZED CITATION SCORE (Sum NCSf) 76.5
NCSf times Frac P.
STANDARD FIELD CITATION SCORE (SCSf) 0.0
Z-score standardized citation score in relation to the UoA "proj_adapt_2014_v3" sub-field set (N.B! average=0.00).
TOP 5% (TOP5%) 4.05
Percentage of papers above the 95th citation percentile.
VITALITY 0.97
adapt
PROJ_ADAPT_2014_V3 - BIBLIOMETRIC INDICATORS
PERCENTAGE SELF CITATION (SelfCit) 0
Percentage self-citation.
PERCENTAGE NOT CITED PAPERS (Pnc) 3
Percentage of not cited papers during the period.
HIRSCH INDEX (H-INDEX) 29
The h number papers that have at least h citations each.
AUTHOR MEAN (AUm) 4.7
Mean number of authors per paper.
INTERNATIONAL COLLABORATION MEAN (IntCOLLm) 1.7
Mean number of countries per paper.
uncited NCSf>0<0.125 >0.125<0.25_ >0.25<0.5_ >0.5<1_ >1<2_ >2<4_ >4<8_ >8_ 5% 10% 15% 20% 25% 30%
Citation profile: The distribution of field normalized citation score for proj_adapt_2014_v3 (bars) compared with all papers attributed to Swedish Universities (line).
competition dynamics cannibalism herbivory boreal forests woody-plants predation lynx lynx conservation contingent valuation attitudes public-goods northern sweden dead wood saproxylic beetles conservation winter ungulates moose policy networks weak ties strength selection fitness dynamics risk extinction effective size ursus arctos hunter observations aerial counts insect harassment upstream migration travel time transmitters trophic interactions songbird protandry software sea salinity gradient
environmental kuznets curve trade structural-change models habitat selection herbivores wildlife savanna water partition-coefficients population-dynamics pontoporeia-femorata adapt
PROJ_ADAPT_2014_V3 - PUBLICATION PROFILE
The map shows papers (nodes) published by proj_adapt_2014_v3. Relations (edges) are based on bibliographic coupling. Most frequent keywords are displayed for groups of related papers. Papers with high field normalized citation score (>3) are marked with a pink border. Edges between publications with high vitality (>1.2) are drawn in pink.
MOST FREQUENT JOURNALS
WILDLIFE BIOL (14) OIKOS (14) BIOL CONSERV (10) EVOL ECOL RES (9) AM NAT (9) J ANIM ECOL (6) CAN J ZOOL (5)
SCAND J FOREST RES (4) P R SOC B (4)
OECOLOGIA (4)
MOST FREQUENT COLLABORATORS
SWEDISH UNIV AGR SCI (121) UMEA UNIV (71)
LUND UNIV (28) AMSTERDAM UNIV (25) NORWEGIAN INST NAT RES (20) FORESTRY RES INST SWEDEN (17) UPPSALA UNIV (12)
STOCKHOLM UNIV (11) HEDMARK UNIV COLL (11)
NORWEGIAN UNIV SCI & TECHNOL (6)
MOST FREQUENT SUBFIELDS
ENVIRONMENTAL SCIENCES & ECOLOGY (126) ZOOLOGY (38)
EVOLUTIONARY BIOLOGY (30) BIODIVERSITY & CONSERVATION (17) MARINE & FRESHWATER BIOLOGY (15)
LIFE SCIENCES & BIOMEDICINE - OTHER TOPICS (13) GENETICS & HEREDITY (11)
FORESTRY (10) FISHERIES (10)
BUSINESS & ECONOMICS (8)
adapt
PROJ_ADAPT_2014_V3 - BIBLIOMETRIC INDICATORS
PERCENTAGE SELF CITATION (SelfCit) 0
Percentage self-citation.
PERCENTAGE NOT CITED PAPERS (Pnc) 3
Percentage of not cited papers during the period.
HIRSCH INDEX (H-INDEX) 29
The h number papers that have at least h citations each.
AUTHOR MEAN (AUm) 4.7
Mean number of authors per paper.
INTERNATIONAL COLLABORATION MEAN (IntCOLLm) 1.7
Mean number of countries per paper.
uncited NCSf>0<0.125 >0.125<0.25_ >0.25<0.5_ >0.5<1_ >1<2_ >2<4_ >4<8_ >8_ 5% 10% 15% 20% 25% 30%
Citation profile: The distribution of field normalized citation score for proj_adapt_2014_v3 (bars) compared with all papers attributed to Swedish Universities (line).
persson, l_adapt danell, k_adapt andren, h_adapt ericsson, g_adapt bergstrom, r_adapt bystrom, p_adapt leonardsson, k_adapt persson, il_adapt laitila, t_adapt kristrom, b_adapt eriksson, t_adapt paulrud, a_adapt adapt
2007 2008 2009 2010 2011 2012 5 10 15 20 25 30 35 40 45 50 2007 2008 2009 2010 2011 2012 0.25 0.5 0.75 1.00 1.25 1.50 1.75 2.00 2.25 2.50 clima
PROJ_CLIMA_2014_V2 - BIBLIOMETRIC INDICATORS
NUMBER OF PAPERS (P) 131
Number of papers (articles, letters and reviews) published by UoA "proj_clima_2014_v2" during 2007-2012.
NUMBER OF FRACTIONALIZED PAPERS (Frac P) 59.4
Sum of author fractionalized papers.
CITATIONS PER PAPER (CPP) 5.4
Number of citations per paper.
JOURNAL NORMALIZED CITATION SCORE (NCSj) 0.79
CPP normalized in relation to the UoA "proj_clima_2014_v2" journal set (average=1.00).
NORMALIZED JOURNAL CITATION SCORE (NJCS) 0.9
The impact of the journal set normalized in relation to its sub-fields (average=1.00).
FIELD NORMALIZED CITATION SCORE (NCSf) 0.94
CPP normalized in relation to the UoA "proj_clima_2014_v2" sub-field set (average=1.00).
SUM OF FIELD NORMALIZED CITATION SCORE (Sum NCSf) 56.0
NCSf times Frac P.
STANDARD FIELD CITATION SCORE (SCSf) 0.0
Z-score standardized citation score in relation to the UoA "proj_clima_2014_v2" sub-field set (N.B! average=0.00).
TOP 5% (TOP5%) 4.30
Percentage of papers above the 95th citation percentile.
VITALITY 0.86
Mean reference age normalized in relation to the sub-field set (average=1, higher=younger).
persson, l_adapt danell, k_adapt andren, h_adapt ericsson, g_adapt bergstrom, r_adapt bystrom, p_adapt leonardsson, k_adapt persson, il_adapt laitila, t_adapt kristrom, b_adapt eriksson, t_adapt paulrud, a_adapt adapt
clima
PROJ_CLIMA_2014_V2 - BIBLIOMETRIC INDICATORS
PERCENTAGE SELF CITATION (SelfCit) 0
Percentage self-citation.
PERCENTAGE NOT CITED PAPERS (Pnc) 15
Percentage of not cited papers during the period.
HIRSCH INDEX (H-INDEX) 18
The h number papers that have at least h citations each.
AUTHOR MEAN (AUm) 4.4
Mean number of authors per paper.
INTERNATIONAL COLLABORATION MEAN (IntCOLLm) 2.1
Mean number of countries per paper.
uncited NCSf>0<0.125 >0.125<0.25_ >0.25<0.5_ >0.5<1_ >1<2_ >2<4_ >4<8_ >8_ 5% 10% 15% 20% 25% 30%
Citation profile: The distribution of field normalized citation score for proj_clima_2014_v2 (bars) compared with all papers attributed to Swedish Universities (line).
risk ethics uncertainty temperature mortality weather asthma exposure logic belief revision revision functions particulate matter health air pollution sweden households remediation contaminated sites tournaments particulate air-pollution health vehicle emissions rationality objectives management climate change model future weather vector transmission values toxicity data reach chemicals pollen uncertainty subjective risk strong program susceptibility shared epitope alleles
risk-factor
clima
PROJ_CLIMA_2014_V2 - PUBLICATION PROFILE
The map shows papers (nodes) published by proj_clima_2014_v2. Relations (edges) are based on bibliographic coupling. Most frequent keywords are displayed for groups of related papers. Papers with high field normalized citation score (>3) are marked with a pink border. Edges between publications with high vitality (>1.2) are drawn in pink.
MOST FREQUENT JOURNALS
GLOBAL HEALTH ACTION (9) ENVIRON HEALTH-GLOB (6) REGUL TOXICOL PHARM (5) INT J ENV RES PUB HE (4) EUR RESPIR J (4)
ENVIRON HEALTH PERSP (4) ENERG POLICY (4)
SYNTHESE (3) J PHILOS LOGIC (3) EPIDEMIOLOGY (3)
MOST FREQUENT COLLABORATORS
UMEA UNIV (77)
ROYAL INST TECHNOL (41) TARTU UNIV (15)
UPPSALA UNIV (12)
LONDON IMPERIAL COLL SCI TECHNOL & MED UNIV (9)
POMPEU FABRA UNIV (8) SO CALIF UNIV (6) SAHLGRENS UNIV HOSP (6)
MOST FREQUENT SUBFIELDS
PUBLIC, ENVIRONMENTAL & OCCUPATIONAL HEALTH (37) ENVIRONMENTAL SCIENCES & ECOLOGY (36)
PHILOSOPHY (20) TOXICOLOGY (13)
TECHNOLOGY - OTHER TOPICS (12) RESPIRATORY SYSTEM (8) ENGINEERING (8)
BUSINESS & ECONOMICS (7)
SOCIAL SCIENCES - OTHER TOPICS (6) HISTORY & PHILOSOPHY OF SCIENCE (6)
clima
PROJ_CLIMA_2014_V2 - BIBLIOMETRIC INDICATORS
PERCENTAGE SELF CITATION (SelfCit) 0
Percentage self-citation.
PERCENTAGE NOT CITED PAPERS (Pnc) 15
Percentage of not cited papers during the period.
HIRSCH INDEX (H-INDEX) 18
The h number papers that have at least h citations each.
AUTHOR MEAN (AUm) 4.4
Mean number of authors per paper.
INTERNATIONAL COLLABORATION MEAN (IntCOLLm) 2.1
Mean number of countries per paper.
uncited NCSf>0<0.125 >0.125<0.25_ >0.25<0.5_ >0.5<1_ >1<2_ >2<4_ >4<8_ >8_ 5% 10% 15% 20% 25% 30%
Citation profile: The distribution of field normalized citation score for proj_clima_2014_v2 (bars) compared with all papers attributed to Swedish Universities (line).
forsberg, b_clima
hansson, so_clima
rocklov, j_clima
edvardsson-bjornberg, k_clima
clima
2003 2004 2005 2006 2007 2008 5 10 15 20 25 30 35 40 45 50 2003 2004 2005 2006 2007 2008 0.25 0.5 0.75 1.00 1.25 1.50 1.75 2.00 2.25 2.50 engo
PROJ_ENGO_2014_V2 - BIBLIOMETRIC INDICATORS
NUMBER OF PAPERS (P) 65
Number of papers (articles, letters and reviews) published by UoA "proj_engo_2014_v2" during 2003-2008.
NUMBER OF FRACTIONALIZED PAPERS (Frac P) 22.4
Sum of author fractionalized papers.
CITATIONS PER PAPER (CPP) 10.8
Number of citations per paper.
JOURNAL NORMALIZED CITATION SCORE (NCSj) 0.76
CPP normalized in relation to the UoA "proj_engo_2014_v2" journal set (average=1.00).
NORMALIZED JOURNAL CITATION SCORE (NJCS) 1.00
The impact of the journal set normalized in relation to its sub-fields (average=1.00).
FIELD NORMALIZED CITATION SCORE (NCSf) 0.66
CPP normalized in relation to the UoA "proj_engo_2014_v2" sub-field set (average=1.00).
SUM OF FIELD NORMALIZED CITATION SCORE (Sum NCSf) 14.8
NCSf times Frac P.
STANDARD FIELD CITATION SCORE (SCSf) 0.0
Z-score standardized citation score in relation to the UoA "proj_engo_2014_v2" sub-field set (N.B! average=0.00).
TOP 5% (TOP5%) 0.91
Percentage of papers above the 95th citation percentile.
VITALITY 0.98
Mean reference age normalized in relation to the sub-field set (average=1, higher=younger).
forsberg, b_clima
hansson, so_clima
rocklov, j_clima
edvardsson-bjornberg, k_clima
clima
engo
PROJ_ENGO_2014_V2 - BIBLIOMETRIC INDICATORS
PERCENTAGE SELF CITATION (SelfCit) 0
Percentage self-citation.
PERCENTAGE NOT CITED PAPERS (Pnc) 8
Percentage of not cited papers during the period.
HIRSCH INDEX (H-INDEX) 16
The h number papers that have at least h citations each.
AUTHOR MEAN (AUm) 4.8
Mean number of authors per paper.
INTERNATIONAL COLLABORATION MEAN (IntCOLLm) 1.5
Mean number of countries per paper.
uncited NCSf>0<0.125 >0.125<0.25_ >0.25<0.5_ >0.5<1_ >1<2_ >2<4_ >4<8_ >8_ 5% 10% 15% 20% 25% 30%
Citation profile: The distribution of field normalized citation score for proj_engo_2014_v2 (bars) compared with all papers attributed to Swedish Universities (line).
organic chlorine chloride organohalogens tropospheric ozone phosphorus trends morphophysiological dormancy weeds sweden sweden plants diversity conservation spatially explicit population patterns interferon-alpha hydroxyurea cytarabine yield wild oat wheat triticum-aestivum soil scale watershed engo
PROJ_ENGO_2014_V2 - PUBLICATION PROFILE
The map shows papers (nodes) published by proj_engo_2014_v2. Relations (edges) are based on bibliographic coupling. Most frequent keywords are displayed for groups of related papers. Papers with high field normalized citation score (>3) are marked with a pink border. Edges between publications with high vitality (>1.2) are drawn in pink.
MOST FREQUENT JOURNALS
WEED RES (4)
ENVIRON MONIT ASSESS (3) ECOL MODEL (3)
CHEMOSPHERE (3) BIOGEOCHEMISTRY (3) J CLEAN PROD (2) FLORA (2)
ENVIRON SCI TECHNOL (2) ECOLOGY (2)
ANN BOT-LONDON (2)
MOST FREQUENT COLLABORATORS
LINKOPING UNIV (61) SLU (8)
HOSP UNIV (6)
SWEDISH UNIV AGR SCI (5) LUND UNIV (5)
UPPSALA HOSP UNIV (4) STOCKHOLM UNIV (4) MALMO UNIV HOSP (4) LUND HOSP UNIV (3) LINKOPING UNIV HOSP (3)
MOST FREQUENT SUBFIELDS
ENVIRONMENTAL SCIENCES & ECOLOGY (30) PLANT SCIENCES (17) AGRICULTURE (12) ENGINEERING (8) WATER RESOURCES (5) HEMATOLOGY (4) GEOLOGY (4) ONCOLOGY (3) MATHEMATICS (3) FORESTRY (3) engo
PROJ_ENGO_2014_V2 - BIBLIOMETRIC INDICATORS
PERCENTAGE SELF CITATION (SelfCit) 0
Percentage self-citation.
PERCENTAGE NOT CITED PAPERS (Pnc) 8
Percentage of not cited papers during the period.
HIRSCH INDEX (H-INDEX) 16
The h number papers that have at least h citations each.
AUTHOR MEAN (AUm) 4.8
Mean number of authors per paper.
INTERNATIONAL COLLABORATION MEAN (IntCOLLm) 1.5
Mean number of countries per paper.
uncited NCSf>0<0.125 >0.125<0.25_ >0.25<0.5_ >0.5<1_ >1<2_ >2<4_ >4<8_ >8_ 5% 10% 15% 20% 25% 30%
Citation profile: The distribution of field normalized citation score for proj_engo_2014_v2 (bars) compared with all papers attributed to Swedish Universities (line).
milberg, p_engo oberg, g_engo grimvall, a_engo westerberg, l_engo hussian, m_engo johansson, m_engo wibeck, v_engo nordgaard, a_engo engo
2003 2004 2005 2006 2007 2008 5 10 15 20 25 30 35 40 45 50 2003 2004 2005 2006 2007 2008 0.25 0.5 0.75 1.00 1.25 1.50 1.75 2.00 2.25 2.50 mist
PROJ_MIST_2014_V2 - BIBLIOMETRIC INDICATORS
NUMBER OF PAPERS (P) 21
Number of papers (articles, letters and reviews) published by UoA "proj_mist_2014_v2" during 2003-2008.
NUMBER OF FRACTIONALIZED PAPERS (Frac P) 9.8
Sum of author fractionalized papers.
CITATIONS PER PAPER (CPP) 16.6
Number of citations per paper.
JOURNAL NORMALIZED CITATION SCORE (NCSj) 1.72
CPP normalized in relation to the UoA "proj_mist_2014_v2" journal set (average=1.00).
NORMALIZED JOURNAL CITATION SCORE (NJCS) 0.9
The impact of the journal set normalized in relation to its sub-fields (average=1.00).
FIELD NORMALIZED CITATION SCORE (NCSf) 1.27
CPP normalized in relation to the UoA "proj_mist_2014_v2" sub-field set (average=1.00).
SUM OF FIELD NORMALIZED CITATION SCORE (Sum NCSf) 12.5
NCSf times Frac P.
STANDARD FIELD CITATION SCORE (SCSf) 0.0
Z-score standardized citation score in relation to the UoA "proj_mist_2014_v2" sub-field set (N.B! average=0.00).
TOP 5% (TOP5%) 7.40
Percentage of papers above the 95th citation percentile.
VITALITY 1.05
Mean reference age normalized in relation to the sub-field set (average=1, higher=younger).
milberg, p_engo oberg, g_engo grimvall, a_engo westerberg, l_engo hussian, m_engo johansson, m_engo wibeck, v_engo nordgaard, a_engo engo
mist
PROJ_MIST_2014_V2 - BIBLIOMETRIC INDICATORS
PERCENTAGE SELF CITATION (SelfCit) 0
Percentage self-citation.
PERCENTAGE NOT CITED PAPERS (Pnc) 0
Percentage of not cited papers during the period.
HIRSCH INDEX (H-INDEX) 12
The h number papers that have at least h citations each.
AUTHOR MEAN (AUm) 3.4
Mean number of authors per paper.
INTERNATIONAL COLLABORATION MEAN (IntCOLLm) 1.3
Mean number of countries per paper.
uncited NCSf>0<0.125 >0.125<0.25_ >0.25<0.5_ >0.5<1_ >1<2_ >2<4_ >4<8_ >8_ 5% 10% 15% 20% 25% 30%
Citation profile: The distribution of field normalized citation score for proj_mist_2014_v2 (bars) compared with all papers attributed to Swedish Universities (line).
waste bioenergy, tree-rings risk assessment, waste
reframing, policy sustainability sweden, power sweden, construction sustainability, products travel, projects typology, systems
strategic environmental assessment, sea
waste management strategies, sweden sweden, policy waste incineration, system of economic and environmental accounts
policy attention, environmental systems analysis
sustainable development, sustainability model, tool
industrial ecology, impact sweden, options
mist
PROJ_MIST_2014_V2 - PUBLICATION PROFILE
The map shows papers (nodes) published by proj_mist_2014_v2. Relations (edges) are based on bibliographic coupling. Most frequent keywords are displayed for groups of related papers. Papers with high field normalized citation score (>3) are marked with a pink border. Edges between publications with high vitality (>1.2) are drawn in pink.
MOST FREQUENT JOURNALS
WASTE MANAGE (3) RESOUR CONSERV RECY (3) ENVIRON IMPACT ASSES (3) POLICY SCI (2)
J CLEAN PROD (2) FUTURES (2) TRANSPORT REV (1) J ENVIRON PLANN MAN (1) ENVIRON PLANN C (1) CLIM POLICY (1)
MOST FREQUENT COLLABORATORS
LINKOPING UNIV (10)
STOCKHOLM ENVIRONM INST (7) ROYAL INST TECHNOL (3) SWEDISH UNIV AGR SCI (2) E ANGLIA UNIV (2)
SWEDISH DEF RES AGCY FOI (1) SWEDISH DEF RES AGCY (1) STOCKHOLM UNIV (1) STAT SWEDEN (1) SKI (1)
MOST FREQUENT SUBFIELDS
ENVIRONMENTAL SCIENCES & ECOLOGY (15) ENGINEERING (9)
PUBLIC ADMINISTRATION (6)
SOCIAL SCIENCES - OTHER TOPICS (2) BUSINESS & ECONOMICS (2)
TRANSPORTATION (1) ENERGY & FUELS (1)
mist
PROJ_MIST_2014_V2 - BIBLIOMETRIC INDICATORS
PERCENTAGE SELF CITATION (SelfCit) 0
Percentage self-citation.
PERCENTAGE NOT CITED PAPERS (Pnc) 0
Percentage of not cited papers during the period.
HIRSCH INDEX (H-INDEX) 12
The h number papers that have at least h citations each.
AUTHOR MEAN (AUm) 3.4
Mean number of authors per paper.
INTERNATIONAL COLLABORATION MEAN (IntCOLLm) 1.3
Mean number of countries per paper.
uncited NCSf>0<0.125 >0.125<0.25_ >0.25<0.5_ >0.5<1_ >1<2_ >2<4_ >4<8_ >8_ 5% 10% 15% 20% 25% 30%
Citation profile: The distribution of field normalized citation score for proj_mist_2014_v2 (bars) compared with all papers attributed to Swedish Universities (line).
eklund, m_mist
martensson, a_mist
dreborg, kh_mist
hjelm, o_mist
mist
2003 2004 2005 2006 2007 2008 5 10 15 20 25 30 35 40 45 50 2003 2004 2005 2006 2007 2008 0.25 0.5 0.75 1.00 1.25 1.50 1.75 2.00 2.25 2.50 flipp
PROJ_FLIPP_2014_V2 - BIBLIOMETRIC INDICATORS
NUMBER OF PAPERS (P) 30
Number of papers (articles, letters and reviews) published by UoA "proj_flipp_2014_v2" during 2003-2008.
NUMBER OF FRACTIONALIZED PAPERS (Frac P) 14.8
Sum of author fractionalized papers.
CITATIONS PER PAPER (CPP) 15.0
Number of citations per paper.
JOURNAL NORMALIZED CITATION SCORE (NCSj) 1.01
CPP normalized in relation to the UoA "proj_flipp_2014_v2" journal set (average=1.00).
NORMALIZED JOURNAL CITATION SCORE (NJCS) 1.02
The impact of the journal set normalized in relation to its sub-fields (average=1.00).
FIELD NORMALIZED CITATION SCORE (NCSf) 0.99
CPP normalized in relation to the UoA "proj_flipp_2014_v2" sub-field set (average=1.00).
SUM OF FIELD NORMALIZED CITATION SCORE (Sum NCSf) 14.7
NCSf times Frac P.
STANDARD FIELD CITATION SCORE (SCSf) 0.0
Z-score standardized citation score in relation to the UoA "proj_flipp_2014_v2" sub-field set (N.B! average=0.00).
TOP 5% (TOP5%) 0.0
Percentage of papers above the 95th citation percentile.
VITALITY 1.10
Mean reference age normalized in relation to the sub-field set (average=1, higher=younger).
eklund, m_mist
martensson, a_mist
dreborg, kh_mist
hjelm, o_mist
mist
flipp
PROJ_FLIPP_2014_V2 - BIBLIOMETRIC INDICATORS
PERCENTAGE SELF CITATION (SelfCit) 0
Percentage self-citation.
PERCENTAGE NOT CITED PAPERS (Pnc) 0
Percentage of not cited papers during the period.
HIRSCH INDEX (H-INDEX) 16
The h number papers that have at least h citations each.
AUTHOR MEAN (AUm) 2.5
Mean number of authors per paper.
INTERNATIONAL COLLABORATION MEAN (IntCOLLm) 1.2
Mean number of countries per paper.
uncited NCSf>0<0.125 >0.125<0.25_ >0.25<0.5_ >0.5<1_ >1<2_ >2<4_ >4<8_ >8_ 5% 10% 15% 20% 25% 30%
Citation profile: The distribution of field normalized citation score for proj_flipp_2014_v2 (bars) compared with all papers attributed to Swedish Universities (line).
wave exposure, topography
wave exposure, spatial dependence
process model, predict
moral philosophy, methodology third-party assurance, sustainability report
wastewater systems, sustainable development
species richness, community structure snail, siphonaria gastropoda
reproductive isolation, speciation
yoghurt, system
swedish forest products industry, organisation theory wave exposure, temporal variability
urban water systems, tool
university, training
south-africa, shores
yogurt, life cycle assessment (lca) supplier, iso 14001
rohs directive, iso 14001
wave exposure, tidal height
wave exposure, topography
flipp
PROJ_FLIPP_2014_V2 - PUBLICATION PROFILE
The map shows papers (nodes) published by proj_flipp_2014_v2. Relations (edges) are based on bibliographic coupling. Most frequent keywords are displayed for groups of related papers. Papers with high field normalized citation score (>3) are marked with a pink border. Edges between publications with high vitality (>1.2) are drawn in pink.
MOST FREQUENT JOURNALS
J CLEAN PROD (13) MAR BIOL (3)
RESOUR CONSERV RECY (2) MAR ECOL PROG SER (2) CORP SOC RESP ENV MA (2) MAR ECOL-PROGR SER (1) J IND ECOL (1)
J EXP MAR BIOL ECOL (1) J EVOLUTION BIOL (1) INT J LIFE CYCLE ASS (1)
MOST FREQUENT COLLABORATORS
LUND UNIV (13) RHODES UNIV (7)
CHALMERS UNIV TECHNOL (7) CHALMERS (6)
STOCKHOLM UNIV (3) CEMENTA AB (2)
TJARNO MARINE BIOL LAB (1)
SWEDISH INST FOOD & BIOTECHNOL (1) SIK AB (1)
NAT RESOURCES CANADA (1)
MOST FREQUENT SUBFIELDS
ENVIRONMENTAL SCIENCES & ECOLOGY (23) ENGINEERING (17)
MARINE & FRESHWATER BIOLOGY (7) OCEANOGRAPHY (3)
ECOLOGY (2)
BUSINESS & ECONOMICS (2) GENETICS & HEREDITY (1) EVOLUTIONARY BIOLOGY (1) ENVIRONMENTAL SCIENCES (1) ENGINEERING, ENVIRONMENTAL (1)
flipp
PROJ_FLIPP_2014_V2 - BIBLIOMETRIC INDICATORS
PERCENTAGE SELF CITATION (SelfCit) 0
Percentage self-citation.
PERCENTAGE NOT CITED PAPERS (Pnc) 0
Percentage of not cited papers during the period.
HIRSCH INDEX (H-INDEX) 16
The h number papers that have at least h citations each.
AUTHOR MEAN (AUm) 2.5
Mean number of authors per paper.
INTERNATIONAL COLLABORATION MEAN (IntCOLLm) 1.2
Mean number of countries per paper.
uncited NCSf>0<0.125 >0.125<0.25_ >0.25<0.5_ >0.5<1_ >1<2_ >2<4_ >4<8_ >8_ 5% 10% 15% 20% 25% 30%
Citation profile: The distribution of field normalized citation score for proj_flipp_2014_v2 (bars) compared with all papers attributed to Swedish Universities (line).
baumann, h_flipp
rex, e_flipp
flipp
2004 2005 2006 2007 2008 2009 5 10 15 20 25 30 35 40 45 50 2004 2005 2006 2007 2008 2009 0.25 0.5 0.75 1.00 1.25 1.50 1.75 2.00 2.25 2.50 sharp
PROJ_SHARP_2014_V2 - BIBLIOMETRIC INDICATORS
NUMBER OF PAPERS (P) 34
Number of papers (articles, letters and reviews) published by UoA "proj_sharp_2014_v2" during 2004-2009.
NUMBER OF FRACTIONALIZED PAPERS (Frac P) 25.3
Sum of author fractionalized papers.
CITATIONS PER PAPER (CPP) 19.0
Number of citations per paper.
JOURNAL NORMALIZED CITATION SCORE (NCSj) 1.43
CPP normalized in relation to the UoA "proj_sharp_2014_v2" journal set (average=1.00).
NORMALIZED JOURNAL CITATION SCORE (NJCS) 1.04
The impact of the journal set normalized in relation to its sub-fields (average=1.00).
FIELD NORMALIZED CITATION SCORE (NCSf) 1.43
CPP normalized in relation to the UoA "proj_sharp_2014_v2" sub-field set (average=1.00).
SUM OF FIELD NORMALIZED CITATION SCORE (Sum NCSf) 36.1
NCSf times Frac P.
STANDARD FIELD CITATION SCORE (SCSf) 0.0
Z-score standardized citation score in relation to the UoA "proj_sharp_2014_v2" sub-field set (N.B! average=0.00).
TOP 5% (TOP5%) 7.55
Percentage of papers above the 95th citation percentile.
VITALITY 1.05
Mean reference age normalized in relation to the sub-field set (average=1, higher=younger).
baumann, h_flipp
rex, e_flipp
flipp