JHEP10(2013)189
Published for SISSA by SpringerReceived: August 12, 2013 Accepted: October 2, 2013 Published: October 29, 2013
Search for direct third-generation squark pair
production in final states with missing transverse
momentum and two b-jets in
√s = 8 TeV pp
collisions with the ATLAS detector
The ATLAS collaboration
E-mail:
atlas.publications@cern.ch
Abstract:
The results of a search for pair production of supersymmetric partners of the
Standard Model third-generation quarks are reported. This search uses 20.1 fb
−1of pp
collisions at
√
s = 8 TeV collected by the ATLAS experiment at the Large Hadron Collider.
The lightest bottom and top squarks (˜b
1and ˜
t
1respectively) are searched for in a final
state with large missing transverse momentum and two jets identified as originating from
b-quarks. No excess of events above the expected level of Standard Model background is
found. The results are used to set upper limits on the visible cross section for processes
beyond the Standard Model. Exclusion limits at the 95% confidence level on the masses
of the third-generation squarks are derived in phenomenological supersymmetric
R-parity-conserving models in which either the bottom or the top squark is the lightest squark. The
˜b
1is assumed to decay via ˜b
1→ b ˜
χ
01and the ˜
t
1via ˜
t
1→ b ˜
χ
±
1
, with undetectable products
of the subsequent decay of the ˜
χ
±1due to the small mass splitting between the ˜
χ
±1and
the ˜
χ
01
.
JHEP10(2013)189
Contents
1
Introduction
1
2
The ATLAS detector and data samples
2
3
Simulated event samples
3
4
Physics object reconstruction
4
5
Event selection
5
6
Background estimate
7
7
Systematic uncertainties
11
8
Results and interpretation
13
9
Conclusions
18
The ATLAS collaboration
24
1
Introduction
Supersymmetry (SUSY) [
1
–
9
] provides an extension of the Standard Model (SM) that
solves the hierarchy problem [
10
–
13
] by introducing supersymmetric partners of the known
bosons and fermions. In the framework of the R-parity-conserving minimal
supersymmet-ric extension of the SM (MSSM) [
14
–
18
], SUSY particles are produced in pairs and the
lightest supersymmetric particle (LSP) is stable, providing a possible candidate for dark
matter. In a large variety of models, the LSP is the lightest neutralino ( ˜
χ
01
). The coloured
superpartners of quarks and gluons, the squarks (˜
q) and the gluinos (˜
g), if not too heavy,
would be produced in strong interaction processes at the Large Hadron Collider (LHC) [
19
]
and decay via cascades ending with the LSP. The undetected LSP would result in missing
transverse momentum while the rest of the cascade would yield final states with multiple
jets and possibly leptons.
A study of the expected SUSY particle spectrum derived from naturalness
considera-tions [
20
,
21
] suggests that the supersymmetric partners of the third-generation SM quarks
are the lightest coloured supersymmetric particles. This may lead to the lightest bottom
squark (sbottom, ˜b
1) and top squark (stop, ˜
t
1) mass eigenstates being significantly lighter
than the other squarks and the gluinos. As a consequence, ˜b
1and ˜
t
1could be pair-produced
with relatively large cross sections at the LHC.
JHEP10(2013)189
Two possible sets of SUSY mass spectra are considered in this paper. In the first
set of scenarios, the lightest sbottom is the only coloured sparticle contributing to the
production processes and it only decays via ˜b
1→ b ˜
χ
01
. In the second set, the lightest stop
is the only coloured sparticle allowed in the production processes and it decays exclusively
via ˜
t
1→ b ˜
χ
±
1
, where the lightest chargino ( ˜
χ
±1
) decays via a virtual W boson into the
three-body final state ˜
χ
01
f ¯
f
′
. This article considers scenarios in the context of natural
SUSY [
20
–
22
], which are characterised by a small value for ∆m ≡ m
χ˜±1
− m
χ˜ 01
. As a
consequence the fermions f and f
′may have transverse momenta below the reconstruction
thresholds applied in the analysis.
In both scenarios, events are characterised by the presence of two jets originating
from the hadronisation of the b-quarks and large missing transverse momentum. Results
of searches for direct sbottom and stop production have been previously reported by the
ATLAS [
23
–
28
] and CMS [
29
–
31
] experiments at the LHC, and by the Tevatron [
32
,
33
]
and LEP [
34
–
36
] experiments.
2
The ATLAS detector and data samples
The ATLAS detector [
37
] consists of inner tracking devices surrounded by a
superconduct-ing solenoid, electromagnetic and hadronic calorimeters and a muon spectrometer with a
magnetic field produced by a set of toroids. The inner detector (ID), in combination with
a superconducting solenoid magnet with a central field of 2 T, provides precision tracking
and momentum measurement of charged particles in a pseudorapidity
1range |η| < 2.5
and allows efficient identification of jets originating from b-hadron decays using impact
parameter measurements and reconstructed secondary decay vertices. The ID consists of a
silicon pixel detector, a silicon microstrip detector and a straw tube tracker (|η| < 2.0) that
also provides transition radiation measurements for electron identification. The calorimeter
system covers the pseudorapidity range |η| < 4.9. It is composed of sampling calorimeters
with either liquid argon or scintillating tiles as the active medium. The muon
spectrome-ter has separate trigger and high-precision tracking chambers, the latspectrome-ter providing muon
identification and momentum measurement for |η| < 2.7.
The data sample used in this analysis was taken during the period from March to
December 2012 with the LHC operating at a pp centre-of-mass energy of
√
s = 8 TeV.
Candidate signal events are selected using a trigger based on a missing transverse
mo-mentum selection (E
missT
), which is found to be 99% efficient for events passing the offline
selection of E
missT
> 150 GeV. The trigger efficiency variations over data-taking periods
are measured to be less than 1% after the offline requirements. After the application of
beam, detector, and data-quality requirements, the total integrated luminosity considered
is 20.1 fb
−1. The uncertainty on the integrated luminosity is ±2.8%. It is derived, following
the same methodology as that detailed in ref. [
38
], from a preliminary calibration of the
1ATLAS uses a right-handed coordinate system with its origin at the nominal interaction point (IP) inthe centre of the detector and the z-axis along the beam pipe. The x-axis points from the IP to the centre of the LHC ring, and the y-axis points upward. Cylindrical coordinates (r, φ) are used in the transverse plane, φ being the azimuthal angle around the beam pipe. The pseudorapidity is defined in terms of the
JHEP10(2013)189
luminosity scale using beam-separation scans performed in November 2012. Events with
final-state electrons or muons that satisfy single-lepton or dilepton triggers are used to
define control regions in a total data sample of 20.3 fb
−1. A requirement on the transverse
momentum p
T> 25 GeV is applied to the highest-p
Telectron or muon to ensure the trigger
selection is fully efficient.
3
Simulated event samples
Simulated Monte Carlo (MC) event samples are used to aid in the description of the
background and to model the SUSY signal. All SM MC samples utilised in the analysis are
produced using the ATLAS Underlying Event Tune 2B [
39
] and are processed through the
ATLAS detector simulation [
40
] based on GEANT4 [
41
] or passed through a fast simulation
using a parameterisation of the performance of the ATLAS electromagnetic and hadronic
calorimeters [
42
]. The effect of multiple pp interactions per bunch crossing (pile-up) is also
taken into account.
The top-quark pair (t¯
t) background is simulated with Powheg-1.0 [
43
] interfaced
to Pythia-6.426 [
44
] for the fragmentation and hadronisation processes. The top-quark
mass is fixed at 172.5 GeV, and the next-to-leading-order (NLO) parton distribution
func-tion (PDF) set CT10 [
45
] is used. Samples from Alpgen-2.14 [
46
] and Powheg each
interfaced to Herwig-6.520 for the fragmentation and hadronisation processes, including
Jimmy-4.31
[
47
] for the underlying event description, are used to estimate the
gener-ator and fragmentation systematic uncertainties, while AcerMC-3.8 [
48
] interfaced to
Pythia
samples are used to estimate the showering uncertainties. Single top-quark
pro-duction for the s-channel and W t processes is simulated with Mc@Nlo-4.06 interfaced
to Herwig+Jimmy, while the t-channel process is simulated with AcerMC interfaced to
Pythia
and using the CTEQ6L1 [
45
] PDF set. Samples of t¯
t+W /Z events are generated
using the leading-order generator MadGraph-5.1.4.8 [
49
] interfaced to Pythia for the
fragmentation and hadronisation processes. Samples of Z/γ
∗or W production, both in
association with up to five jets, are produced with Sherpa-1.4.1 [
50
]. MC samples of
dibosons (ZZ, W Z and W W ) are generated using Sherpa.
The background predictions are normalised to theoretical cross sections, calculated
including higher-order QCD corrections where available, and are compared to data in
appropriate control regions. The inclusive cross sections for Z+jets and W +jets processes
are calculated with dynnlo [
51
] with the MSTW 2008 next-to-next-to-leading-order PDF
set [
52
]. Approximate NLO+NNLL (next-to-next-to-leading-logarithm) cross sections are
used in the normalisation of the t¯
t [
53
] and W t [
54
] samples. Cross sections calculated at
NLO are used for the t¯
t + W and t¯
t + Z samples [
55
] and for the diboson samples [
56
].
The SUSY signal samples are generated using MadGraph interfaced to Pythia (with
PDF set CTEQ6L1) to ensure an accurate treatment of the initial-state radiation (ISR).
Additional samples with different ISR parameter values are generated to evaluate the ISR
systematic uncertainty. Polarisation effects due to the choice of left- and right-handed
scalar sbottom or stop mixing were found to have a negligible impact on the analysis.
Sig-nal cross sections are calculated to next-to-leading-order in the strong coupling constant,
adding the resummation of soft gluon emission at next-to-leading-logarithmic accuracy
JHEP10(2013)189
(NLO+NLL) [
57
–
59
]. The nominal cross section and its uncertainty are taken from an
envelope of cross-section predictions using different PDF sets and factorisation and
renor-malisation scales, as described in ref. [
60
].
4
Physics object reconstruction
Jets are reconstructed from three-dimensional cell-energy clusters in the calorimeter using
the anti-k
tjet algorithm [
61
,
62
] with a radius parameter of 0.4. The measured jet energy
is corrected for inhomogeneities and for the non-compensating nature of the calorimeter by
weighting energy deposits arising from electromagnetic and hadronic showers by correction
factors derived from MC simulations and validated with data. An additional calibration is
subsequently applied to the corrected jet energies, relating the response of the calorimeter
to the true jet energy [
63
]. The impact of additional collisions in the same or neighbouring
bunch crossings is accounted for using corrections derived as a function of the average
number of interactions per event and of the number of reconstructed primary vertices.
Jets are required to have p
T> 20 GeV, and are reconstructed in the range |η| < 4.9.
Events are rejected if they include jets failing the quality criteria described in ref. [
63
].
To further reject spurious jet signals originating from cosmic rays or detector malfunctions,
additional criteria are applied to the charged p
Tfraction (f
ch), defined as the sum of the
p
Tof all tracks associated with the jet divided by the jet p
T, and to the fraction of the
jet energy contained in the electromagnetic layers of the calorimeter (f
em). Events are
rejected if any of the two leading jets with p
T> 100 GeV and |η| < 2.0 satisfies either
f
ch< 0.02 or both f
ch< 0.05 and f
em> 0.9. To remove jets from additional pp collisions,
all jets with p
T< 50 GeV and |η| < 2.5 are required to have at least one track identified
as coming from the primary vertex. The primary vertex itself is defined as the vertex with
the highest summed track p
2T
.
Jets within the nominal acceptance of the ID (|η| < 2.5) and with p
T> 20 GeV, are
selected as originating from a b-quark (b-tagged) if they satisfy requirements on the impact
parameter of the ID tracks, the secondary vertex reconstruction and the topology of b- and
c-hadron decays inside the jet. The b-tagging algorithm [
64
] uses a multivariate technique
and, for this analysis, is configured to achieve an efficiency of 60% for tagging b-jets in a
MC sample of t¯
t events with corresponding rejection factors of 580, 8 and 23 against jets
originating from light quarks, c-quarks and τ -leptons, respectively.
Electrons are reconstructed from cell-energy clusters in the electromagnetic calorimeter
matched to a track in the ID. Electron candidates are required to have p
T> 7 GeV and
|η| < 2.47 and must satisfy the “medium” selection criteria described in ref. [
65
] and
reoptimized for 2012 data. Electrons used to define the control regions are selected using
the “tight” criteria, p
T> 20 GeV, and with an additional isolation requirement that the
total transverse momentum of charged tracks within a cone of ∆R = 0.2 around the
candidate be less than 10% of the reconstructed p
T. Muon candidates are identified using
a match between an extrapolated ID track and one or more track segments in the muon
spectrometer [
66
], and are required to have p
T> 6 GeV and |η| < 2.4. Muons used to
define the control regions are also required to have p
T> 20 GeV and less than 1.8 GeV
JHEP10(2013)189
Following their reconstruction, candidate jets and leptons may point to the same energy
deposits in the calorimeter. These overlaps are resolved by first discarding any jet candidate
within ∆R = 0.2 of an electron candidate. Then, any electron or muon candidate within
∆R = 0.4 of any surviving jet is discarded.
The missing transverse momentum, p
missT
, with magnitude E
Tmiss, is constructed as
the negative of the vector sum of the transverse momentum of all muons and electrons
with p
T>10 GeV, jets with p
T>20 GeV, and calibrated calorimeter energy clusters with
|η| <4.9 not assigned to these objects [
67
].
5
Event selection
Two sets of signal regions are defined to provide sensitivity to the kinematic topologies
as-sociated with different mass splittings between the sbottom or the stop and the neutralino.
In all cases, the presence of at least one primary vertex (with at least five associated tracks
with p
T> 0.4 GeV) is required. Events are selected with E
Tmiss> 150 GeV and no
elec-trons or muons identified in the final state. For the signal region selections, jets within
|η| < 2.8 are ordered according to their p
T, with n being their total number, and two jets
are required to be b-tagged. The following event-level variables are defined:
– ∆φ
minis defined as the minimum azimuthal distance, ∆φ, between any of the three
leading jets and the p
missT
vector
∆φ
min= min(|φ
1− φ
pmissT|, |φ
2− φ
pmissT|, |φ
3− φ
pmissT|).
Background multi-jet events are typically characterised by small values of ∆φ
min;
– m
effis defined as the scalar sum of the p
Tof the k leading jets and the E
Tmissm
eff(k) =
kX
i=1
(p
jetT)
i+ E
Tmiss,
where the index refers to the p
T-ordered list of jets;
– H
T,3is defined as the scalar sum of the p
Tof the n jets, without including the three
leading jets
H
T,3=
nX
i=4(p
jetT)
i,
where the index refers to the p
T-ordered list of jets;
– m
bbis defined as the invariant mass of the two b-tagged jets in the event;
– m
CTis the contransverse mass [
68
] and is a kinematic variable that can be used to
measure the masses of pair-produced semi-invisibly decaying heavy particles. For two
identical decays of heavy particles into two visible particles (or particle aggregates)
v
1and v
2, and two invisible particles, m
CTis defined as:
JHEP10(2013)189
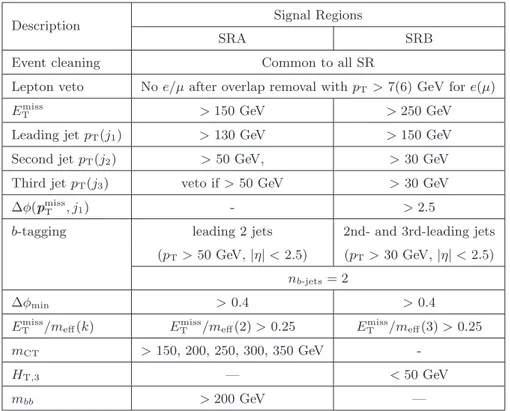
Description Signal Regions
SRA SRB
Event cleaning Common to all SR
Lepton veto No e/µ after overlap removal with pT> 7(6) GeV for e(µ)
Emiss
T > 150 GeV > 250 GeV
Leading jet pT(j1) > 130 GeV > 150 GeV
Second jet pT(j2) > 50 GeV, > 30 GeV
Third jet pT(j3) veto if > 50 GeV > 30 GeV
∆φ(pmissT , j1) - > 2.5
b-tagging leading 2 jets 2nd- and 3rd-leading jets (pT> 50 GeV, |η| < 2.5) (pT> 30 GeV, |η| < 2.5)
nb-jets= 2
∆φmin > 0.4 > 0.4
Emiss
T /meff(k) ETmiss/meff(2) > 0.25 EmissT /meff(3) > 0.25
mCT > 150, 200, 250, 300, 350 GeV
-HT,3 — < 50 GeV
mbb > 200 GeV —
Table 1. Summary of the event selection in each signal region.
where E
T=
q
p
2T
+ m
2. In this analysis, v
1and v
2are the two b-jets from the
squark decays and the invisible particles are the two ˜
χ
01
particles or chargino decay
products, depending on the assumption considered. The contransverse mass is an
invariant under equal and opposite boosts of the parent particles in the transverse
plane. For parent particles produced with small transverse boosts, m
CTis bounded
from above by an analytical combination of particle masses. This bound is saturated
when the two visible objects are co-linear. For t¯
t events this kinematic bound is at
135 GeV. For production of sbottom pairs the bound is given by:
m
maxCT=
m
2
(˜b) − m
2( ˜
χ
01
)
m(˜b)
.
A similar equation can be written for production of stop pairs in terms of m
˜t1
and
m
χ˜±1
. A correction to m
CTfor the transverse boost due to ISR is also applied [
69
].
The definition of the two signal regions is summarised in table
1
. Signal region A
(SRA) targets signal events with large mass splitting between the squark and the neutralino,
identifying two b-tagged high-p
Tleading jets as products of the two sbottom or stop decays.
Events are rejected if any other central (|η| < 2.8) jets are found with p
T> 50 GeV.
Multijet background is suppressed by selecting events with large ∆φ
minand E
Tmiss/m
eff.
The requirement m
bb> 200 GeV is added to reduce backgrounds from production of
top-quark (including top-top-quark pairs and single top-top-quark production processes), and Z-bosons
in association with heavy-flavour jets. As a final selection criterion, five different thresholds
JHEP10(2013)189
on m
CTranging from 150 GeV to 350 GeV are applied. For a signal point corresponding
to m
˜b1
= 500 GeV and m
χ˜01= 1 GeV, 3% of the simulated events are retained by the SRA
selection with m
CT> 250 GeV.
Signal region B (SRB) is defined to enhance the sensitivity for a small squark-neutralino
mass difference by explicitly selecting events with a high-p
Tjet, which is likely to have
been produced as initial state radiation, recoiling against the squark-pair system. High
thresholds on the leading jet p
Tand on the missing transverse momentum, which are
required to be almost back-to-back in φ, are imposed. The leading jet is required to be
not b-tagged, and two additional jets are required to be b-tagged. As for SRA, the
multi-jet background is suppressed with appropriate selections on ∆φ
minand E
Tmiss/m
eff. A
final upper requirement on the additional hadronic activity in the event, H
T,3< 50 GeV
completes the selection for SRB. For a signal point corresponding to m
˜b1
= 300 GeV and
m
χ˜01
= 270 GeV, 10% of the simulated events are retained by the SRB selection.
6
Background estimate
The dominant SM background processes in the signal regions are the production of W
or Z bosons in association with heavy-flavour jets (referred to as W +hf and Z+hf) and
the production of top-quarks. Events with Z+hf production followed by Z → ν ¯ν decay
have the same signature as the signal and are the dominant background in SRA.
Top-quark (dominant in SRB) and W +hf production satisfy the signal region selections when
a charged lepton is produced but the event is not rejected, either because the lepton is a
hadronically decaying τ , or because the electron or muon is not reconstructed. The
domi-nant backgrounds are normalised in dedicated control regions (CRs) and then extrapolated
to the signal regions using MC simulation. The control regions, detailed below, are defined
by explicitly requiring the presence of one or two leptons (electrons or muons) in the final
state together with further selection criteria similar to those of the corresponding signal
regions. In particular, events with additional lepton candidates are vetoed applying the
same lepton requirements used to veto events in the signal regions. The single top-quark
contribution accounts for 5% to 20% of the total top-quark background contribution,
de-pending on the signal region considered, and is added to the t¯
t background contribution
with a relative normalisation corresponding to that predicted by the MC simulation, as
described in section
3
.
The contributions from diboson and t¯
t + W/Z processes are sub-dominant and they
are collectively called “Others” in the following. They are estimated from MC simulation
for both the signal and the control regions.
Finally, the background from multi-jet production is estimated from data using a
procedure described in detail in ref. [
70
] modified to account for the flavour of the jets.
The procedure consists of smearing the jet response in low-E
missT
seed events. The Gaussian
core of the jet response function is obtained from dijet events, while the non-Gaussian tails
are obtained from three-jet events, where the E
missT
can be unambiguously attributed to
the mis-measurement of one of the jets. The contribution from multi-jet production in the
control regions is found to be negligible.
JHEP10(2013)189
CRA 1L CRA SF CRA DF
One e or µ e±e∓or µ±µ∓ e±µ∓
Veto additional lepton candidates (pT(e) >7 GeV pT(µ) >6 GeV)
Only two reconstructed jets with pT> 50 GeV
pT(j1) > 130 GeV pT(j1) > 50 GeV pT(j1) > 130 GeV
pT(j2) > 50 GeV pT(j2) > 50 GeV pT(j2) > 50 GeV
Emiss
T > 100 GeV ETmiss(lepton-corrected) > 100 GeV EmissT > 100 GeV
Two reconstructed b-jets (pT> 50)
40 GeV < mT< 100 GeV 75 GeV < mℓℓ< 105 GeV mℓℓ> 50 GeV
mCT> 150 GeV lepton pT> 90 GeV mCT> 75 GeV
— mbb> 200 GeV —
Table 2. Definitions of the three SRA control regions.
For SRA, the contributions from top-quark, Z+jets and W +jets production are
es-timated simultaneously with a profile likelihood fit to three control regions. For SRB it
is difficult to identify a control region that probes the W +jets background normalisation.
Therefore, this contribution is estimated purely from MC simulation as described in
sec-tion
3
, and only control regions for top-quark and Z+jets are defined.
A set of same-flavour opposite-sign two-lepton control regions with dilepton invariant
mass near the Z mass (75 < m
ℓℓ< 105 GeV) provides a data sample dominated by Z
production. For these control regions, labelled in the following as CRA SF and CRB SF,
the p
Tof the leptons is added vectorially to the p
missTto mimic the expected missing
transverse momentum spectrum of Z → ν ¯ν events, and is indicated in the following as
E
missT
(lepton corrected). In addition, the p
Tof the leading lepton is required to be above
90 GeV in order to further enhance the Z production contribution. In the case of CRA SF,
a m
bb> 200 GeV selection is also imposed.
The set of control regions with exactly one lepton (e, µ) in the final state provides
a data sample dominated by top-quark and W +jets production. A selection criterion is
applied to the tranverse mass, 40 GeV < m
T< 100 GeV, where m
Tis defined as:
m
T=
q
2p
lepTE
miss T− 2p
lep T· p
missTIn the following, these control regions are labelled as CRA 1L and CRB 1L. CRA 1L is
used to estimate the contribution of the W +jets background, which is enhanced by the
selection criterion m
CT> 150 GeV in SRA. CRB 1L is used to estimate the top-quark
background in SRB.
To estimate top-quark production in SRA, a different-flavour opposite-sign two-lepton
control region (CRA DF) is defined requiring one electron and one muon in the final state
with m
eµ> 50 GeV and m
CT>75 GeV.
JHEP10(2013)189
CRB 1L CRB SF
One e or µ e±e∓or µ±µ∓
Veto additional lepton candidates (pT(e) >7 GeV pT(µ) >6 GeV)
Only three reconstructed jets with pT> 30 GeV
pT(j1) > 130 GeV pT(j1) > 50 GeV
EmissT > 120 GeV ETmiss(lepton-corrected) > 100 GeV
j1anti b-tagged; j2 and j3 b-tagged
40 GeV < mT< 100 GeV 75 GeV < mℓℓ< 105 GeV
— Lepton pT> 90 GeV
HT,3< 50 GeV
Table 3. Definitions of the two SRB control regions.
Events / 25 GeV 0 10 20 30 40 50 ATLAS CRA_DF -1 = 8 TeV, 20.3 fb s Data SM total top-quark production Z production Others [GeV] CT m 0 50 100 150 200 250 300 350 400 Data / SM 0 1 2 Events / 20 GeV 0 10 20 30 40 50 ATLAS CRA_SF -1 = 8 TeV, 20.3 fb s Data SM total top-quark production Z production Others (1st lepton) [GeV] T p 0 50 100 150 200 250 300 350 400 Data / SM 0 1 2
Figure 1. Left: mCT distribution in CRA DF omitting the requirement on the mCT variable.
Right: leading lepton pTdistribution in CRA SF with all the selections applied except the
require-ment on this variable. The red arrows indicate where a selection on the corresponding variable is applied. The shaded band includes both the detector and theoretical systematic uncertainties. The SM prediction is normalised according to the MC expectations. The last bin in each histogram contains the integral of all events with values greater than the upper axis bound.
The distribution of the m
CTvariable in CRA DF (before the m
CTselection) and of
the leading lepton p
T(before the p
Tselection) in CRA SF are shown before the fit in
figure
1
. Similarly, the transverse mass distribution of the leading-lepton–E
missT
system in
CRB 1L (before the m
Tselection) and the invariant mass distribution of the two leptons
in CRB SF (before the m
ℓℓselection) are shown in figure
2
. In these figures the data set
used corresponds to an integrated luminosity of 20.3 fb
−1and the normalisations described
in section
3
are assumed.
The observed numbers of events in the various CRs are used to generate internally
consistent SM background estimates for each of the SRs via a profile likelihood fit. This
procedure takes into account CR correlations due to common systematic uncertainties as
well as contaminations from other SM processes and/or SUSY signal events, when a
par-JHEP10(2013)189
Events / 20 GeV 1 10 2 10 3 10 ATLAS CRB_1L -1 = 8 TeV, 20.3 fb s Data SM total top-quark production W production Z production Others [GeV] T m 0 50 100 150 200 250 300 350 400 Data / SM 0 1 2 Events / 5 GeV 1 10 2 10 ATLAS CRB_SF -1 = 8 TeV, 20.3 fb s Data SM total top-quark production Z production Others [GeV] ll m 0 20 40 60 80 100 120 140 Data / SM 0 1 2Figure 2. Left: transverse mass distribution of the leading-lepton–Emiss
T system in CRB 1L
omit-ting the mTrequirement. Right: dilepton invariant mass distribution in CRB SF omitting the mℓℓ
requirement. The red arrows indicate where a selection on the corresponding variable is applied. The shaded band includes both the detector and theoretical systematic uncertainties. The SM prediction is normalised according to the MC expectations.
ticular model is considered for exclusion. Systematic uncertainties, discussed in detail in
section
7
, are treated as nuisance parameters in the fit and are constrained with
Gaus-sian functions taking into account correlations between sample estimates. The likelihood
function is built as the product of Poisson probability functions, describing the observed
and expected number of events in the control and (when excluding SUSY models) signal
regions, and the constraints on the nuisance parameters. As a result, the impact of some
of the systematic uncertainties that are correlated between the CRs and the corresponding
SR is reduced.
The free parameters of the fit are the overall normalisation values of the top-quark,
W +jets and Z+jets processes for SRA, and of the top-quark and Z+jets processes for SRB.
The contributions from all other background processes are fixed at the values expected from
MC. The fit results in the control regions are summarised in tables
4
and
5
for SRA and
SRB, respectively. These results are found to be compatible with MC yields predicted
before the fit, which are also given in the tables.
The predictions from the fit are in good agreement with the MC estimates with a
maximum discrepancy of two standard deviations observed in one of the control regions.
The reliability of the MC extrapolation of the SM background estimate outside of the
control regions is evaluated in several validation regions. The first set of validation regions
is defined with the same kinematic selection as the control regions but requiring only one
jet to be b-tagged. They are used to verify the performance of the b-tagging algorithm in a
larger sample of events. A second set of validation regions is defined with the same selection
criteria as the signal regions, but with one of the requirements inverted. In all cases these
validation regions are background-dominated with a potential signal contamination of less
than 20% for the signal models considered. For SRA, two validation regions are explored by
imposing either m
CT< 100 GeV or m
bb< 200 GeV. To validate SRB, a validation region
JHEP10(2013)189
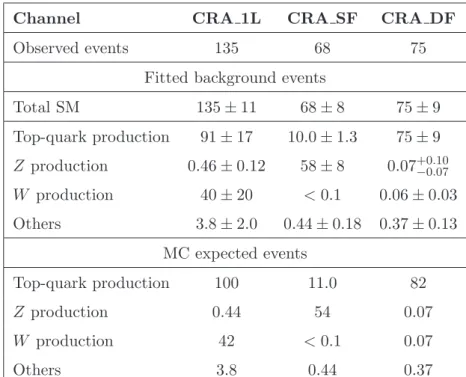
Channel
CRA 1L
CRA SF
CRA DF
Observed events
135
68
75
Fitted background events
Total SM
135 ± 11
68 ± 8
75 ± 9
Top-quark production
91 ± 17
10.0 ± 1.3
75 ± 9
Z production
0.46 ± 0.12
58 ± 8
0.07
+0.10−0.07W production
40 ± 20
< 0.1
0.06 ± 0.03
Others
3.8 ± 2.0
0.44 ± 0.18 0.37 ± 0.13
MC expected events
Top-quark production
100
11.0
82
Z production
0.44
54
0.07
W production
42
< 0.1
0.07
Others
3.8
0.44
0.37
Table 4. Results of the fit for the control regions adopted for SRA. Expected yields derived from MC simulation using theoretical cross sections are also shown. Uncertainties quoted include statis-tical and detector-related systematic effects. The central values of the fitted sum of backgrounds in the control regions agree with the observations by construction. The uncertainty on the total back-ground estimate can be smaller than some of the individual uncertainties due to anticorrelations.
with the selection H
T,3> 50 GeV is defined as well as a second validation region with two
leptons of different flavour to verify the normalisation of the top-quark background.
Good agreement is found in each case, with a difference of less than one standard
deviation between the expectations and the number of observed events.
7
Systematic uncertainties
The dominant detector-related systematic effects are due to the uncertainties on the jet
energy scale (JES) and resolution (JER), and on the b-tagging efficiency. The impact
of these uncertainties is reduced through the normalisation of the dominant backgrounds
in the control regions with kinematic selections resembling those of the corresponding
signal region.
The JES uncertainty is determined using the techniques described in refs. [
63
,
71
],
leading to a slight dependence on p
T, η, jet flavour, number of primary vertices and
prox-imity to adjacent jets. The JER uncertainty is obtained from in-situ measurements of the
jet response asymmetry in dijet events [
63
]. These uncertainties on jets are propagated to
the E
missT
measurement, and additional uncertainties on E
Tmissarising from energy deposits
not associated with any reconstructed objects are also included. The relative impact on
the event yields from the JES (JER) uncertainty is between 1–5% (1–8%) in the different
SRA regions and is 3% (8%) in SRB.
JHEP10(2013)189
Channel
CRB 1L
CRB SF
Observed events
437
48
Fitted background events
Total SM
437 ± 21
48 ± 7
Top-quark production
403 ± 27
16.2 ± 2.2
Z production
0.26 ± 0.15
31 ± 7
W production
32 ± 20
< 0.1
Others
1.4 ± 0.5
1.0 ± 0.5
MC expected events
Top-quark production
370
15
Z production
0.32
38
W production
32
< 0.1
Others
1.4
1.0
Table 5. Results of the fit for the control regions adopted for SRB. Expected yields as derived from MC using theoretical cross sections are also shown. Uncertainties quoted include statistical and detector-related systematic effects. The central values of the fitted sum of backgrounds in the control regions agree with the observations by construction. The uncertainty on the total background estimate can be smaller than some of the individual uncertainties due to anticorrelations. The W production estimate is normalised using the nominal theoretical cross section and with the associated uncertainties discussed in section7.
The b-tagging uncertainty is evaluated by varying the p
T- and flavour-dependent scale
factors applied to each jet in the simulation within a range that reflects the systematic
uncertainty on the measured tagging efficiency and rejection rates. The relative impact of
this uncertainty on the final event yield is dominated by the uncertainty in the b-tagging
efficiency. The uncertainty amounts to 2–10% in the different SRA regions and 2% in SRB.
In the case of SRB, an uncertainty is also associated with the requirement that jets
with p
T< 50 GeV have at least one track originating from the primary vertex. It has a
relative impact on the final event yields of 7%. Other detector systematic uncertainties
like pile-up or trigger effects are found to have negligible impact on the analysis.
Theoretical uncertainties on the modeling of the t¯
t+jets background are assessed. The
uncertainty due to the choice of the MC generator is estimated by comparing the
predic-tions of the Powheg and Alpgen generators, both interfaced to the Herwig+Jimmy
parton shower (PS) and hadronisation (HAD) calculations. The PS/HAD uncertainty is
estimated by comparing samples generated with Powheg interfaced to either Pythia or
Herwig+Jimmy. The uncertainty due to the ambiguity in the renormalisation and
fac-torisation scales is estimated by individually doubling or halving them. The uncertainty
in the ISR and final-state radiation (FSR) is estimated by comparing AcerMC samples
generated with different amounts of ISR/FSR, as constrained by recent ATLAS
measure-JHEP10(2013)189
Channel SRA, mCT selection SRB
150 GeV 200 GeV 250 GeV 300 GeV 350 GeV
Observed 102 48 14 7 3 65 Total SM 94 ± 13 39 ± 6 15.8 ± 2.8 5.9 ± 1.1 2.5 ± 0.6 64 ± 10 Top-quark 11.1 ± 1.8 2.4 ± 1.4 0.44 ± 0.25 < 0.01 < 0.01 41 ± 7 Z production 66 ± 11 28 ± 5 11.4 ± 2.2 4.7 ± 0.9 1.9 ± 0.4 13 ± 4 W production 13 ± 6 4.9 ± 2.6 2.1 ± 1.1 1.0 ± 0.5 0.46 ± 0.26 8 ± 5 Others 4.3 ± 1.5 3.4 ± 1.3 1.8 ± 0.6 0.12 ± 0.11 0.10+0.12 −0.10 2.0 ± 1.0 Multijet 0.21 ± 0.21 0.06 ± 0.06 0.02 ± 0.02 < 0.01 < 0.01 0.16 ± 0.16
Table 6. For each signal region, the observed event yield is compared with the background predic-tion obtained from the fit. Statistical, detector-related and theoretical systematic uncertainties are included, taking into account correlations.
ments [
72
]. The PDF uncertainties are derived by varying the 52 PDFs in the CT10 NLO
error set following the Hessian method and rescaling to the 68% confidence level. Since t¯
t
and single top-quark productions are treated together, these theoretical uncertainties are
also assigned to the single top contribution and it was checked that they account for the
difference in event kinematics between the samples. The final relative uncertainties on the
yields due to theoretical uncertainties in top-quark production modeling are less than 0.7%
in SRA and 4% in SRB, dominated mostly by PS/HAD and scale uncertainties.
Uncertainties in the W/Z+jets simulation are evaluated by comparing the predictions
of the Sherpa and Alpgen generators and, by varying the Sherpa scales related to the
matching scheme, the strong coupling constant, and the renormalisation and factorisation
scales. The PDF uncertainties are evaluated following the same procedure as for the
top-quark background. For SRB, W +jets production is estimated from MC simulation and an
additional uncertainty of 26% due to the W +hf contribution is included [
73
]. The relative
uncertainties on the yields are in the range 0.3–3.1% in SRA, mostly dominated by the
difference between Sherpa and Alpgen. For SRB, a 3% uncertainty is assigned to Z+hf
and 9% to W +hf, the latter uncertainty being dominated by the MC normalisation.
An uncertainty of 100% is derived for the multi-jet prediction by studying variations
of the resolution function. Finally, uncertainties of 30% and of 50% are assigned to the
cross sections of t¯
t + W and of t¯
t + Z production, respectively [
55
,
74
].
8
Results and interpretation
The number of data events observed in each signal region is reported in table
6
, together
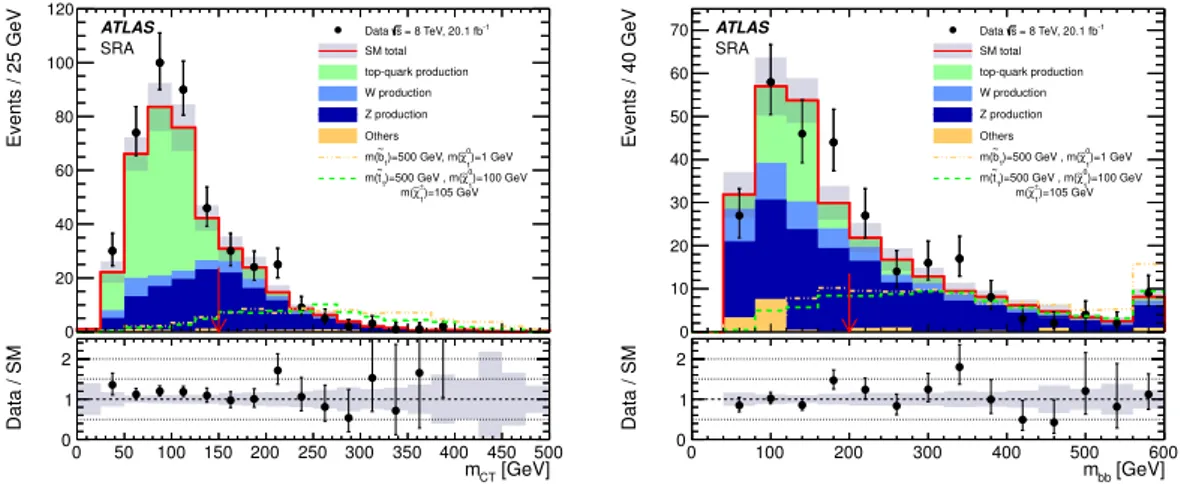
with the SM background expectation after the fit. Figures
3
and
4
show the comparison
between the SM prediction and the observed data for some relevant kinematic distributions
in SRA and SRB, respectively. An example of a SUSY process with a large mass difference
between the squark and the lightest neutralino is also shown for reference in each case.
No significant excess above the SM expectation is observed in any of the signal regions.
The results are used to derive upper limits on the number of beyond the SM (BSM) events
JHEP10(2013)189
Events / 25 GeV 0 20 40 60 80 100 120 ATLAS SRA -1 = 8 TeV, 20.1 fb s Data SM total top-quark production W production Z production Others )=1 GeV 0 1 χ∼ )=500 GeV, m( 1 b ~ m( )=100 GeV 0 1 χ∼ )=500 GeV , m( 1 t ~ m( ±)=105 GeV 1 χ∼ m( [GeV] CT m 0 50 100 150 200 250 300 350 400 450 500 Data / SM 0 1 2 Events / 40 GeV 0 10 20 30 40 50 60 70 ATLAS SRA -1 = 8 TeV, 20.1 fb s Data SM total top-quark production W production Z production Others )=1 GeV 0 1 χ∼ )=500 GeV , m( 1 b ~ m( )=100 GeV 0 1 χ∼ )=500 GeV , m( 1 t ~ m( ±)=105 GeV 1 χ∼ m( [GeV] bb m 0 100 200 300 400 500 600 Data / SM 0 1 2Figure 3. Left: mCT distribution in SRA with all the selection criteria applied except the
mCT thresholds. Right: mbb distribution in SRA with all selection criteria applied including
mCT > 150 GeV. The shaded band includes statistical, detector-related and theoretical
system-atic uncertainties. The backgrounds are normalised to the values determined in the fit. The red arrows indicate where a selection on the corresponding variable is applied. For illustration the dis-tributions expected for two signal models are displayed. The models correspond to m˜b1 = 500 GeV
and mχ˜0
1 = 1 GeV (orange dash-dot line) and m˜t1= 500 GeV and mχ˜ 0
1= 100 GeV (green dash line).
The rightmost bin in the figures includes the overflows.
Events / 20 GeV 0 20 40 60 80 100 120 ATLAS SRB -1 = 8 TeV, 20.1 fb s Data SM total top-quark production W production Z production Others )=200 GeV 0 1 χ∼ )=300 GeV , m( 1 b ~ m( )=150 GeV 0 1 χ∼ )=250 GeV , m( 1 t ~ m( ±)=155 GeV 1 χ∼ m( [GeV] T miss E 150 200 250 300 350 400 450 Data / SM 0 1 2 Events / 10 GeV 0 5 10 15 20 25 30 35 ATLAS SRB )=155 GeV ± 1 χ∼ m( -1 = 8 TeV, 20.1 fb s Data SM total top-quark production W production Z production Others )=200 GeV 0 1 χ∼ )=300 GeV , m( 1 b ~ m( )=150 GeV 0 1 χ∼ )=250 GeV , m( 1 t ~ m( [GeV] T,3 H 0 20 40 60 80 100 120 140 160 180 200 Data / SM 0 1 2
Figure 4. Left: Emiss
T distribution with all SRB selection criteria applied except the final EmissT
requirement. Right: distribution of HT,3 with all SRB selection criteria applied except the HT,3
requirement. Since jets have pT> 20 GeV by construction, the leftmost bin contains events where
no additional jets are present (HT,3 =0 GeV) while the second bin is empty. The shaded band
includes statistical, detector-related and theoretical systematic uncertainties. The backgrounds are normalised to the values determined in the fit. The red arrows indicate where a selection on the corresponding variable is applied. For illustration the distributions expected for two signal models are displayed. The models correspond to m˜b
1 = 300 GeV and mχ˜ 0
1 = 200 GeV (purple dash-dot
line) and mt˜1 = 250 GeV and mχ˜ 0
1 = 150 GeV (orange dash line). The rightmost bin in the figures
JHEP10(2013)189
Signal Regions Background Observed 95% CL upper limit onestimate data BSM event yield σvis(fb)
exp. obs. exp. obs.
SRA (mCT> 150 GeV) 94 ± 13 102 32+13−9 38 1.6+0.6−0.4 1.9 SRA (mCT> 200 GeV) 39 ± 6 48 19+8−5 26 0.94+0.40−0.25 1.3 SRA (mCT> 250 GeV) 15.8 ± 2.8 14 10.2+4.6−3.0 9.0 0.51+0.22−0.14 0.45 SRA (mCT> 300 GeV) 5.9 ± 1.1 7 6.5+3.3−2.1 7.5 0.32+0.16−0.1 0.37 SRA (mCT> 350 GeV) 2.5 ± 0.6 3 4.7+2.6−1.6 5.2 0.23+0.13−0.08 0.26 SRB 64 ± 10 65 26+10 −7 27 1.21+0.45−0.35 1.3
Table 7. Expected and observed event yields with the corresponding upper limits on BSM signal yields and σvis= σ · A · ǫ for all the signal regions defined.
for each signal region, assuming no systematic uncertainties for these events and neglecting
any possible contamination in the control regions. Scaling by the integrated luminosity,
these can be interpreted as a corresponding upper limit on the cross section, σ
vis, defined as
σ
vis= σ · A · ǫ
where σ, A and ǫ are, respectively, the production cross section, the acceptance and the
selection efficiency for a BSM signal. The 95% confidence level (CL) limits are computed
using the CLs prescription [
75
]. Table
7
summarises, for each signal region, the estimated
SM background yield, the observed numbers of events, and the expected and observed
upper limits on event yields from a BSM signal and on σ
vis.
The results are interpreted in various SUSY scenarios assuming a SUSY particle mass
hierarchy such that the lightest third-generation squark decays exclusively via ˜b
1→ b ˜
χ
0 1or ˜
t
1→ b ˜
χ
±1for production of sbottom or stop pairs, respectively. For the latter case, two
different values of ∆m between the lightest chargino and neutralino are probed to assess
the impact of the lepton and jet vetoes applied in the analysis.
Systematic uncertainties on the signal acceptance include experimental uncertainties,
mostly dominated by b-tagging (20–30% in SRA, ∼ 15–30% in SRB) and JES (4–30% in
SRA, 20–40% in SRB) uncertainties. These uncertainties are assumed to be fully correlated
with those of the background.
For SRB, the uncertainties due to the modelling of ISR processes are assessed by
changing the strength of the parton shower controlled by Pythia and by doubling and
halving the values of the following three parameters: (i) the factorisation and
renormalisa-tion scales; (ii) the matching distance between a parton and a jet; (iii) the scale at which
α
Sis evaluated at every parton radiation step. The relative changes due to each of these
individual variations are assumed to be uncorrelated and are added in quadrature. The
overall uncertainty due to ISR depends on the mass difference between the squark and the
LSP, with a maximum value of 30% on the signal acceptance when the mass difference is on
the order of 10 GeV and quickly dropping down to a plateau of 7–10% for mass differences
above 25 GeV. This uncertainty has a negligible dependence on the squark mass for the
mass range considered in this analysis.
JHEP10(2013)189
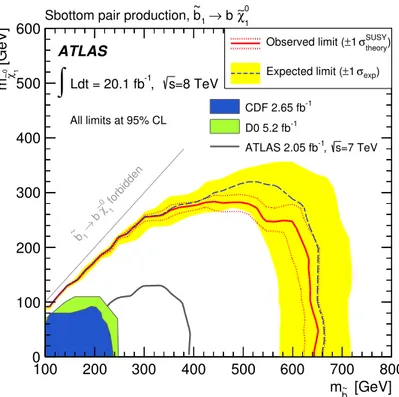
[GeV] 1 b ~ m 100 200 300 400 500 600 700 800 [GeV]0 1 χ∼ m 0 100 200 300 400 500 600 forbidden 0 1 χ ∼ b → 1 b ~ -1 CDF 2.65 fb -1 D0 5.2 fb =7 TeV s , -1 ATLAS 2.05 fb 0 1 χ∼ b → 1 b ~ Sbottom pair production,=8 TeV s , -1 Ldt = 20.1 fb
∫
ATLAS theory) SUSY σ 1 ± Observed limit ( ) exp σ 1 ± Expected limit ( All limits at 95% CLFigure 5. Expected and observed exclusion limits at 95% CL in the (m˜b 1, mχ˜
0
1) mass plane for
the sbottom pair production scenario considered. The signal region providing the best expected CLs exclusion limit is chosen at each point. The dashed (solid) lines show the expected (observed) limits, including all uncertainties except for the theoretical signal cross-section uncertainty (PDF and scale). The bands around the expected limits show the ±1σ uncertainties. The dotted lines around the observed limits represent the results obtained when moving the nominal signal cross section up or down by the ±1σ theoretical uncertainty. Previous limits published by ATLAS [23], CDF [32] and D0 [33] are also shown.
Figure
5
shows the observed (solid lines) and expected (dashed lines) exclusion limits
for the sbottom pair production scenario obtained by taking, for each signal mass
config-uration, the signal region with the best expected limit. These limits are obtained using a
likelihood test which compares the observed numbers of events in the signal regions with
the fitted background expectation and the ensuing signal contamination in the
correspond-ing CRs for a given model. Sensitivity to scenarios with large mass difference (> 100 GeV)
between the ˜b
1and the ˜
χ
01
is achieved with the successive m
CTthresholds used in SRA.
Sensitivity to scenarios with smaller mass differences is achieved predominantly with the
dedicated SRB selection. Sbottom masses up to 620 GeV are excluded at 95% CL for
m
χ˜01
< 120 GeV. Differences in mass above 50 GeV between the ˜b
1and the ˜
χ
0
1
are excluded
up to sbottom masses of 300 GeV. If the branching ratio of ˜b
1→ b ˜
χ
01
is reduced to 60%
and assuming that the analysis is not sensitive to other possible decays, the excluded
up-per limit on the sbottom mass for m
χ˜01
< 150 GeV is reduced to 520 GeV. Similarly for
m
˜b1
= 250 GeV, the upper limit on m
χ˜01is reduced by 30 GeV.
In the case of stop pair production with the stop decaying only into b ˜
χ
±1, the model
depends on the masses of the three SUSY particles involved in the decay, m
t˜1, m
χ˜±1and
JHEP10(2013)189
[GeV] + 1 χ∼ m 100 120 140 160 180 200 220 240 260 280 [GeV]0χ∼1 m 0 50 100 150 200 250 300 350 0 1 χ∼ <m 1 + χ∼ m ) = 300 GeV 1 t~ , m( 1 + χ∼ b → 1 t~ Stop pair production,=8 TeV s , -1 Ldt = 20.1 fb
∫
ATLAS theory) SUSY σ 1 ± Observed limit ( ) exp σ 1 ± Expected limit ( All limits at 95% CL [GeV] 1 t~ m 200 300 400 500 600 700 [GeV]0χ∼1 m 0 50 100 150 200 250 0 1 χ∼ <m 1 + χ∼ m ) = 150 GeV + 1 χ∼ , m( 1 + χ∼ b → 1 t~ Stop pair production,=8 TeV s , -1 Ldt = 20.1 fb
∫
ATLAS theory) SUSY σ 1 ± Observed limit ( ) exp σ 1 ± Expected limit ( All limits at 95% CL [GeV] 1 t~ m 200 300 400 500 600 700 [GeV]0χ∼1 m 100 150 200 250 300 350 400 450 500 550 600 forbidden 1 + χ∼ b → 1 t ~ ) = 5 GeV 0 1 χ∼ )-m( 1 + χ∼ , m( 1 + χ∼ b → 1 t~ Stop pair production,=8 TeV s , -1 Ldt = 20.1 fb
∫
ATLAS theory) SUSY σ 1 ± Observed limit ( ) exp σ 1 ± Expected limit ( All limits at 95% CL [GeV] 1 t~ m 200 300 400 500 600 700 [GeV]0χ∼1 m 100 200 300 400 500 600 forbidden 1 + χ∼ b → 1 t ~ ) = 20 GeV 0 1 χ∼ )-m( 1 + χ∼ , m( 1 + χ∼ b → 1 t~ Stop pair production,=8 TeV s , -1 Ldt = 20.1 fb
∫
ATLAS theory) SUSY σ 1 ± Observed limit ( ) exp σ 1 ± Expected limit ( All limits at 95% CLFigure 6. Expected and observed exclusion limits at 95% CL for the different stop pair pro-duction scenarios considered. Upper left: (mχ˜±1, mχ˜
0
1) mass plane with m˜t1 = 300 GeV. Upper
right: (mt˜1, mχ˜ 0
1) mass plane with mχ˜ ±
1 = 150 GeV. Lower left: (m˜t1, mχ˜ 0
1) mass plane with
mχ˜± 1 − mχ˜
0
1 = 5 GeV. Lower right: (mt˜1, mχ˜ 0
1) mass plane with mχ˜ ± 1 − mχ˜
0
1 = 20 GeV. The
sig-nal region providing the best expected CLs exclusion limit is chosen at each point. The dashed (solid) lines show the expected (observed) limits, including all uncertainties except for the theoret-ical signal cross-section uncertainty (PDF and scale). The bands around the expected limits show the ±1σ uncertainties. The dotted lines around the observed limits represent the results obtained when moving the nominal signal cross section up or down by the ±1σ theoretical uncertainty. The excluded regions are above (below) the curves for the upper (lower) figures. For the bottom two figures, the lower bound of the vertical axis corresponds to the LEP limit of the lightest chargino mass, 103.5 GeV [34–36].
scenario and are presented in figure
6
under the additional assumptions that m
˜t1
=300 GeV
(upper left), m
χ˜±1
=150 GeV (upper right), or for a fixed value of the mass difference ∆m =
m
χ˜±1
−m
χ˜01of 5 GeV (lower left) and 20 GeV (lower right). The limits presented assume that
the chargino decays promptly at the interaction point, as it is the case for ∆m & 100 MeV
[
76
]. Stop masses up to 580 GeV (440 GeV) are excluded for ∆m = 5 GeV (20 GeV) and for
JHEP10(2013)189
m
χ˜01
= 100 GeV. For ∆m = 5 GeV (20 GeV), neutralino masses up to 270 GeV (220 GeV)
are excluded for m
˜t1= 420 GeV. In the ∆m = 20 GeV, a smaller fraction of the (m
t˜1, m
χ˜01
)
plane is excluded since this scenario has a lower efficiency given that electrons and muons
often have a p
Tabove the reconstruction threshold.
9
Conclusions
The results of a search for third-generation squark pair production in pp collisions at
√
s = 8 TeV based on 20.1 fb
−1of ATLAS data are reported. Events with large E
missT
and
two b-tagged jets are analysed. The results are in agreement with SM predictions for
backgrounds and translate into 95% CL. upper limits on the sbottom (stop) and neutralino
masses in a given MSSM scenario for which the exclusive decay ˜b
1→ b ˜
χ
01
(˜
t
1→ b ˜
χ
±1
) is
assumed. For sbottom pairs decaying exclusively to b ˜
χ
01
, sbottom masses up to 620 GeV
are excluded at 95% CL for m
χ˜01
< 150 GeV. Differences in mass above 50 GeV between
the ˜b
1and the ˜
χ
01are excluded up to sbottom masses of 300 GeV. These limits significantly
extend previous results.
For stop pairs decaying exclusively into b ˜
χ
±1
, stop masses up to 580 GeV (440 GeV) are
excluded for ∆m = m
χ˜± 1−m
χ˜0
1
= 5 GeV (20 GeV) and for m
χ˜01= 100 GeV. For ∆m = 5 GeV
(20 GeV), neutralino masses up to 270 GeV (220 GeV) are excluded for m
t˜1= 420 GeV.
Acknowledgements
We thank CERN for the very successful operation of the LHC, as well as the support staff
from our institutions without whom ATLAS could not be operated efficiently.
We acknowledge the support of ANPCyT, Argentina; YerPhI, Armenia; ARC,
Aus-tralia; BMWF and FWF, Austria; ANAS, Azerbaijan; SSTC, Belarus; CNPq and FAPESP,
Brazil; NSERC, NRC and CFI, Canada; CERN; CONICYT, Chile; CAS, MOST and
NSFC, China; COLCIENCIAS, Colombia; MSMT CR, MPO CR and VSC CR, Czech
Re-public; DNRF, DNSRC and Lundbeck Foundation, Denmark; EPLANET, ERC and NSRF,
European Union; IN2P3-CNRS, CEA-DSM/IRFU, France; GNSF, Georgia; BMBF, DFG,
HGF, MPG and AvH Foundation, Germany; GSRT and NSRF, Greece; ISF, MINERVA,
GIF, DIP and Benoziyo Center, Israel; INFN, Italy; MEXT and JSPS, Japan; CNRST,
Mo-rocco; FOM and NWO, Netherlands; BRF and RCN, Norway; MNiSW, Poland; GRICES
and FCT, Portugal; MERYS (MECTS), Romania; MES of Russia and ROSATOM, Russian
Federation; JINR; MSTD, Serbia; MSSR, Slovakia; ARRS and MIZˇ
S, Slovenia; DST/NRF,
South Africa; MICINN, Spain; SRC and Wallenberg Foundation, Sweden; SER, SNSF and
Cantons of Bern and Geneva, Switzerland; NSC, Taiwan; TAEK, Turkey; STFC, the Royal
Society and Leverhulme Trust, United Kingdom; DOE and NSF, United States of America.
The crucial computing support from all WLCG partners is acknowledged gratefully,
in particular from CERN and the ATLAS Tier-1 facilities at TRIUMF (Canada), NDGF
(Denmark, Norway, Sweden), CC-IN2P3 (France), KIT/GridKA (Germany), INFN-CNAF
(Italy), NL-T1 (Netherlands), PIC (Spain), ASGC (Taiwan), RAL (UK) and BNL (USA)
and in the Tier-2 facilities worldwide.
JHEP10(2013)189
Open Access.
This article is distributed under the terms of the Creative Commons
Attribution License which permits any use, distribution and reproduction in any medium,
provided the original author(s) and source are credited.
References
[1] H. Miyazawa, Baryon number changing currents, Prog. Theor. Phys. 36 (1966) 1266. [2] P. Ramond, Dual theory for free fermions,Phys. Rev. D 3 (1971) 2415 [INSPIRE].
[3] Y. Golfand and E. Likhtman, Extension of the algebra of Poincar´e group generators and violation of p invariance, JETP Lett. 13 (1971) 323 [INSPIRE].
[4] A. Neveu and J. Schwarz, Factorizable dual model of pions,Nucl. Phys. B 31 (1971) 86
[INSPIRE].
[5] A. Neveu and J. Schwarz, Quark model of dual pions,Phys. Rev. D 4 (1971) 1109 [INSPIRE].
[6] J.-L. Gervais and B. Sakita, Field theory interpretation of supergauges in dual models,
Nucl. Phys. B 34 (1971) 632[INSPIRE].
[7] D.V. Volkov and V.P. Akulov, Is the neutrino a goldstone particle?,
Phys. Lett. B 46 (1973) 109[INSPIRE].
[8] J. Wess and B. Zumino, A lagrangian model invariant under supergauge transformations,
Phys. Lett. B 49 (1974) 52[INSPIRE].
[9] J. Wess and B. Zumino, Supergauge transformations in four-dimensions,
Nucl. Phys. B 70 (1974) 39[INSPIRE].
[10] S. Weinberg, Implications of dynamical symmetry breaking,Phys. Rev. D 13 (1976) 974
[INSPIRE].
[11] E. Gildener, Gauge symmetry hierarchies,Phys. Rev. D 14 (1976) 1667[INSPIRE].
[12] S. Weinberg, Implications of dynamical symmetry breaking: an addendum,
Phys. Rev. D 19 (1979) 1277[INSPIRE].
[13] L. Susskind, Dynamics of spontaneous symmetry breaking in the Weinberg-Salam theory,
Phys. Rev. D 20 (1979) 2619[INSPIRE].
[14] P. Fayet, Supersymmetry and weak, electromagnetic and strong interactions,
Phys. Lett. B 64 (1976) 159[INSPIRE].
[15] P. Fayet, Spontaneously broken supersymmetric theories of weak, electromagnetic and strong interactions,Phys. Lett. B 69 (1977) 489[INSPIRE].
[16] G.R. Farrar and P. Fayet, Phenomenology of the production, decay and detection of new hadronic states associated with supersymmetry,Phys. Lett. B 76 (1978) 575[INSPIRE].
[17] P. Fayet, Relations between the masses of the superpartners of leptons and quarks, the goldstino couplings and the neutral currents,Phys. Lett. B 84 (1979) 416[INSPIRE].
[18] S. Dimopoulos and H. Georgi, Softly broken supersymmetry and SU(5),
Nucl. Phys. B 193 (1981) 150[INSPIRE].
[19] L. Evans and P. Bryant, LHC machine,2008 JINST 3 S08001[INSPIRE].
[20] R. Barbieri and G. Giudice, Upper bounds on supersymmetric particle masses,
JHEP10(2013)189
[21] B. de Carlos and J. Casas, One loop analysis of the electroweak breaking in supersymmetricmodels and the fine tuning problem,Phys. Lett. B 309 (1993) 320[hep-ph/9303291] [INSPIRE].
[22] M. Papucci, J.T. Ruderman and A. Weiler, Natural SUSY endures,JHEP 09 (2012) 035
[arXiv:1110.6926] [INSPIRE].
[23] ATLAS collaboration, Search for scalar bottom pair production with the ATLAS detector in pp collisions at√s = 7 TeV, Phys. Rev. Lett. 108 (2012) 181802[arXiv:1112.3832] [INSPIRE].
[24] ATLAS collaboration, Search for a heavy top-quark partner in final states with two leptons with the ATLAS detector at the LHC,JHEP 11 (2012) 094[arXiv:1209.4186] [INSPIRE].
[25] ATLAS collaboration, Search for light top squark pair production in final states with leptons and b− jets with the ATLAS detector in√s = 7 TeV proton-proton collisions,
Phys. Lett. B 720 (2013) 13[arXiv:1209.2102] [INSPIRE].
[26] ATLAS collaboration, Search for light scalar top quark pair production in final states with two leptons with the ATLAS detector in√s = 7 TeV proton-proton collisions,
Eur. Phys. J. C 72 (2012) 2237[arXiv:1208.4305] [INSPIRE].
[27] ATLAS collaboration, Search for direct top squark pair production in final states with one isolated lepton, jets and missing transverse momentum in√s = 7 TeV pp collisions using 4.7 fb−1 of ATLAS data, Phys. Rev. Lett. 109 (2012) 211803[arXiv:1208.2590] [INSPIRE].
[28] ATLAS collaboration, Search for a supersymmetric partner to the top quark in final states with jets and missing transverse momentum at√s = 7 TeV with the ATLAS detector,
Phys. Rev. Lett. 109 (2012) 211802[arXiv:1208.1447] [INSPIRE].
[29] CMS collaboration, Search for new physics in events with same-sign dileptons and b jets in pp collisions at√s = 8 TeV, JHEP 03 (2013) 037[Erratum ibid. 1307 (2013) 041]
[arXiv:1212.6194] [INSPIRE].
[30] CMS collaboration, Search for supersymmetry in final states with missing transverse energy and 0, 1, 2, or at least 3 b-quark jets in 7 TeV pp collisions using the variable alphaT,
JHEP 01 (2013) 077[arXiv:1210.8115] [INSPIRE].
[31] CMS collaboration, Search for supersymmetry in hadronic final states with missing transverse energy using the variables αT and b-quark multiplicity in pp collisions at 8 TeV,
Eur. Phys. J. C 73 (2013) 2568[arXiv:1303.2985] [INSPIRE].
[32] CDF collaboration, T. Aaltonen et al., Search for the production of scalar bottom quarks in p¯p collisions at √s = 1.96 TeV,Phys. Rev. Lett. 105 (2010) 081802[arXiv:1005.3600] [INSPIRE].
[33] D0 collaboration, V.M. Abazov et al., Search for scalar bottom quarks and third-generation leptoquarks in pp− bar collisions at√s = 1.96 TeV,Phys. Lett. B 693 (2010) 95
[arXiv:1005.2222] [INSPIRE].
[34] LEP SUSY Working Group, Combined LEP chargino results, up to 208 GeV for large m0,
LEPSUSYWG/01-03.1(2001).
[35] LEP SUSY Working Group, Combined LEP selectron/smuon/stau results, 183–208 GeV,
LEPSUSYWG/04-01.1(2004).
[36] http://lepsusy.web.cern.ch/lepsusy/Welcome.html.
[37] ATLAS collaboration, The ATLAS experiment at the CERN Large Hadron Collider,
JHEP10(2013)189
[38] ATLAS collaboration, Improved luminosity determination in pp collisions at √s = 7 TeVusing the ATLAS detector at the LHC,Eur. Phys. J. C 73 (2013) 2518[arXiv:1302.4393] [INSPIRE].
[39] ATLAS collaboration, ATLAS tunes of PYTHIA 6 and PYTHIA 8 for MC11,
ATL-PHYS-PUB-2011-009(2011).
[40] ATLAS collaboration, The ATLAS simulation infrastructure,
Eur. Phys. J. C 70 (2010) 823[arXiv:1005.4568] [INSPIRE].
[41] GEANT4 collaboration, S. Agostinelli et al., GEANT4: a simulation toolkit,
Nucl. Instrum. Meth. A 506 (2003) 250[INSPIRE].
[42] ATLAS collaboration, The simulation principle and performance of the ATLAS fast calorimeter simulation FastCaloSim,ATL-PHYS-PUB-2010-013(2010).
[43] S. Frixione, P. Nason and C. Oleari, Matching NLO QCD computations with Parton Shower simulations: the POWHEG method,JHEP 11 (2007) 070[arXiv:0709.2092] [INSPIRE].
[44] T. Sj¨ostrand, S. Mrenna and P.Z. Skands, PYTHIA 6.4 physics and manual,
JHEP 05 (2006) 026[hep-ph/0603175] [INSPIRE].
[45] P.M. Nadolsky, H.-L. Lai, Q.-H. Cao, J. Huston, J. Pumplin, et al., Implications of CTEQ global analysis for collider observables,Phys. Rev. D 78 (2008) 013004[arXiv:0802.0007] [INSPIRE].
[46] M.L. Mangano, M. Moretti, F. Piccinini, R. Pittau and A.D. Polosa, ALPGEN, a generator for hard multiparton processes in hadronic collisions,JHEP 07 (2003) 001[hep-ph/0206293] [INSPIRE].
[47] J. Butterworth, J.R. Forshaw and M. Seymour, Multiparton interactions in photoproduction at HERA,Z. Phys. C 72 (1996) 637[hep-ph/9601371] [INSPIRE].
[48] B.P. Kersevan and E. Richter-Was, The Monte Carlo event generator AcerMC versions 2.0 to 3.8 with interfaces to PYTHIA 6.4, HERWIG 6.5 and ARIADNE 4.1,
Comput. Phys. Commun. 184 (2013) 919[INSPIRE].
[49] J. Alwall, M. Herquet, F. Maltoni, O. Mattelaer and T. Stelzer, MadGraph 5: going beyond,
JHEP 06 (2011) 128[arXiv:1106.0522] [INSPIRE].
[50] T. Gleisberg et al., Event generation with SHERPA 1.1,JHEP 02 (2009) 007
[arXiv:0811.4622] [INSPIRE].
[51] S. Catani, L. Cieri, G. Ferrera, D. de Florian and M. Grazzini, Vector boson production at hadron colliders: a fully exclusive QCD calculation at NNLO,
Phys. Rev. Lett. 103 (2009) 082001[arXiv:0903.2120] [INSPIRE].
[52] A. Martin, W. Stirling, R. Thorne and G. Watt, Parton distributions for the LHC,
Eur. Phys. J. C 63 (2009) 189[arXiv:0901.0002] [INSPIRE].
[53] M. Aliev et al., HATHOR: HAdronic Top and Heavy quarks crOss section calculatoR,
Comput. Phys. Commun. 182 (2011) 1034[arXiv:1007.1327] [INSPIRE].
[54] N. Kidonakis, Two-loop soft anomalous dimensions for single top quark associated production with a W− or H−,Phys. Rev. D 82 (2010) 054018[arXiv:1005.4451] [INSPIRE].
[55] M. Garzelli, A. Kardos, C. Papadopoulos and Z. Tr´ocs´anyi, t¯t W+−and t ¯t Z
Hadroproduction at NLO accuracy in QCD with Parton Shower and Hadronization effects,
JHEP 11 (2012) 056[arXiv:1208.2665] [INSPIRE].
[56] T. Binoth, M. Ciccolini, N. Kauer and M. Kr¨amer, Gluon-induced W-boson pair production at the LHC,JHEP 12 (2006) 046[hep-ph/0611170] [INSPIRE].