Responses of Urban Shallow Lakes to Early Stages of Rehabilitation
Xiaoju. Zhang1, Larry A. Roesner, Kenneth Carlson and Qian LiangDepartment of Civil and Environmental Engineering, Colorado State University
Abstract. The Fossil Creek Lakes, located in Fossil Creek Community Park in south Fort Collins,
Colorado, are the remnants of the old Poertner Reservoir constructed more than 100 years ago, which is an aesthetic and recreational fishing amenity to park visitors. However, the accumulation of 100 years of organic matter and sulfur compounds in the bottom coupled with summer and winter thermal stratification results in extremely low redox potentials in the bottom sediments and high concentrations of reduced sulfur (S-II). The presence of H2S (g), particularly during lake turnover events has resulted in numerous odor complaints from park visitors and residents living nearby. In addition, fish kills occur during the late summer and through the winter, which has forced water managers to look for solutions to eliminate air quality impacts and protect water quality. As maintenance of aerobic conditions in the hypolimnion is an important consideration for successful lake management, this research focused on the use of artificial aeration to increase hypolimnetic dissolved oxygen levels. The number of aerators was substantially less in number than would typically be used in a lake of this size, because it was hypothesized that by placing the aerators in the deeper pockets of the lake, density differences would cause the heavier bottom water to “flow downhill” toward the aerators, increasing the effective circulation cells of the individual aerators. The experimental method involved monitoring of specific water quality constituents prior to and after the aeration. Preliminary findings show the aeration system significantly eliminated summer and winter lake stratification, reduced the odor problems, improved the water quality, including pH, solids, and nitrogen and phosphorus species.
1. Introduction
Urban lakes are usually shallow, highly artificial and often hypertrophic, and yet are associated with many human activities (Birch and McCaskie, 1999). A "shallow lake" refers to a permanent standing body of water that allows light penetration to the bottom sediments adequate to potentially support photosynthesis of higher aquatic plants over the entire basin. Even though turbidity from abiotic or biotic sources may prevent light from reaching the sediments, the lakes are sufficiently shallow for this potential condition to occur (Wetzel, 2001). The many different uses provided by the urban lakes make them more vulnerable to changes in water quality than rural, natural lakes through nutrient enrichment, while the shallowness makes them more vulnerable to variations in weather and nutrient inputs from internal loadings (Sondergaard et al. 2005). The water quality deterioration manifests itself in changes in the chemical, physical and biological
characteristics of receiving waters. The degraded lake has one or more characteristics like (1) decreased water clarity; (2) increased pH; (3) hypolimnetic oxygen depletion and the accompanying production of hydrogen sulfide (H2S) and methane (CH4); (4) release of nitrogen (N) and phosphorus (P) from lake bottom sediments during periods of anoxia; (5) massive algal blooms, and (6) occasional fish kills (Kalff, 2002 and Oberholster, et al., 2007). Hydrogen sulfide is formed in hypolimnion by sulfur reducing bacteria as a result of decreased redox potential, which is determined mainly by oxygen content in the near
1 Department of Civil and Environmental Engineering, Colorado State University, Fort Collins, CO
135
bottom waters. The use of artificial aeration is an effective way to eliminate thermal
stratification, and increase hypolimnetic dissolved oxygen (DO) levels (Grochowska, J and Gawrońska 2004).
The Fossil Creek Lakes have been the subject of numerous odor complaints from residents living nearby Fossil Creek Park. Pungent odors from the lakes are reported year-round, but are most noticeable during spring and early fall months, when many regional lakes turnover, breaking the temperature stratification that has set up. In addition, fish kills occur during the late summer and through the winter, which has seriously compromised the lake as a recreational fishery. Based on the problems reported, the City of Fort Collins Park Planning and Management Division in partnership with Colorado State University Urban Water Center funded a research study to develop a Fossil Creek Lake Ecosystem Restoration Plan which includes three objectives: (1) Habitat restoration, (2) Elimination of air quality impacts, and (3) Protection of water quality.
The aim of the present research was to use a cost-effective approach to solve the lake odor problems, improve the health of lake ecosystem and evaluate the effectiveness of the rehabilitation method. The Fossil Creek Lake Rehabilitation Study sought to provide the necessary data and analyses to facilitate effective lake management planning. This study mainly focuses on the following procedure:
- Analysis of the lake water quality conditions before restoration based on the results from 2006, and May to August 2009.
- Installation and start up of the aeration system.
- Analysis of the lake physical and chemical characteristics during artificial aeration and the recovery period, on the basis of results from September 2009 to November 2010.
2. Study Site
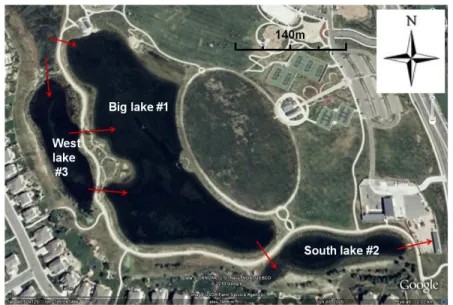
Fossil Creek Lakes are composed of three lakes: Big Lake #1(3.84 ha), South Lake #2(0.65 ha), and West Lake #3(0.77 ha) at an elevation of 1,516 meters. The annual average rainfall within the watershed of the lakes is approximately 45.72 cm.
The major water supply to the lake is a diversion pipe from Fossil Creek, which delivers an annual average flow of 0.02 m3 s-1, flowing through a free water surface
wetland, and then entering the Big Lake and the adjacent West Lake (Figure 1). The annual lakes inflow pattern is shown in Figure 2. There is some direct storm runoff (around 5%) from suburban areas near the lakes.
Lake #1 is a shallow depth polymictic lake with a maximum depth of 3.7 m, while lake #2 is the shallowest one, which is about 1.5m, and deepest spot of lake #3 is about 2.7m. Water from lake #2 is used to water lawns in the park during summer time, resulting in the shortest hydraulic residence time. Lake #1 was studied during this research.
136 Figure 1. Plan view of Fossil Creek Lakes
0 0.01 0.02 0.03 0.04 0.05 0.06 0.07 0.08
Mar April May June July Aug Sep Oct Nov
F low r at e m 3 s -1 2006 2007 2008 2009 2010
Figure 2. Times series of inflow rate
3. Materials and Methods
3.1 Startup
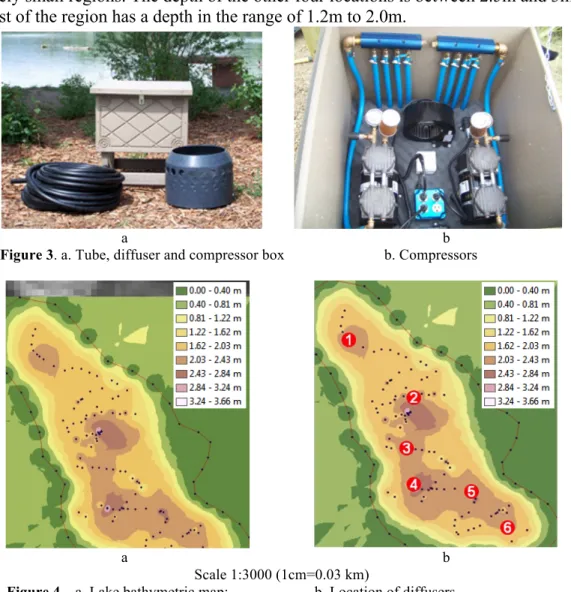
The artificial aeration system approach was chosen as the lake rehabilitation method. The air compressor is installed on the lake edge with air lines extending to the lake bottom (Figure 3.a and 3.b). When compressed air is released through the diffuser at the bottom of a pond or lake, air begins to migrate towards the surface, drawing oxygen-depleted water from the bottom, oxygenating it and transporting it to the surface, leading to increases in decomposition rates of organic matter in the water column and bottom sediment. The compressed air flow also carries water and creates a permanent circular circulation pattern.
Before the installation of the aeration system, a lake bathymetric map was developed. In order to cover most points of the lake, the depth of the big lake was measured using GPS and a sonar depth meter. The points measured are marked as blue dots (Figure 4.a). The contour map was produced through Arc GIS Version 9.3. The two deepest locations in the big lake, labeled as 2 and 4 in Figure 4.b with the maximum depth of 3.7m, are both
137
relatively small regions. The depth of the other four locations is between 2.5m and 3m. The rest of the region has a depth in the range of 1.2m to 2.0m.
a b Figure 3. a. Tube, diffuser and compressor box b. Compressors
a b Scale 1:3000 (1cm=0.03 km)
Figure 4. a. Lake bathymetric map; b. Location of diffusers
The research was to focus aeration on the deepest spots, monitor the water quality changes, and then decide if more diffusers are required. It was hypothesized that by placing the aerators in the deeper pockets of the lake, density differences would cause the heavier bottom water to “flow downhill” toward the aerators, increasing the effective circulation cells of the individual aerators. Six diffusers were installed at the six deepest spots of the Big Lake above the bottom. Two separate air compressors with a total air capacity of 2-4m3 s-1 delivery rate were chosen, and each compressor was connected to three diffusers by weighted rubber pressure pipes. The number of aerators was
substantially less in number than would typically be used (each compressor is usually connected to four aerators) in a lake of this size.
The lake’s artificial aeration system was carried out from August 20, 2009. Aeration was performed continuously for 19 months. The aeration system was carried out under strictly controlled conditions that enabled adjustment of the air flow rate to the
138 3.2 Water quality monitoring
The water quality monitoring of the lake before and after the aeration was carried out in four stages:
Stage 1-April 2006 to October 2006. To better understand the nature and causes of the odors associated with Fossil Creek Lakes, the Urban Water Center at Colorado State University undertook water quality monitoring of the lakes during 2006 from late spring to early fall. Monitoring focused on four primary water quality parameters: temperature, pH, DO, and conductivity.
Stage 2-May 2009 to August 2009. Measurements were made at six stations (Figure 4.b) in the big lake. At each station, measurements were made at 0.6m intervals from the surface of the lake to the bottom. In the big lake, station 1 was located near the lake inlet, station 3 and 4 were located in the deepest region of the lake, station 3 and 5 were the second deepest region of the lake, and station 6 was located at the lake’s outlet. Lake monitoring was conducted twice per month from May to August (except June), 2009, measuring temperature, pH, DO, total phosphorous (TP), sulfide, sulfate, total nitrogen (TN) and total organic carbon (TOC).
Stage 3-August 2009 to November 2009. The aeration system was started in late August of 2009, and the water quality monitoring was conducted on a daily basis from 8/24 to 9/4. Sampling commenced weekly from 9/4 to 11/20, after which the lakes froze over. Water quality measurements included temperature, pH, dissolved oxygen (DO) and sulfide from surface to bottom, which are taken at each diffuser and the middle place between diffusers. These measurements were chosen to evaluate the aeration’s mixing efficiency in destratifying the lake and reducing odor problems. Standard analytical methods (Eaton et al., 1998) were used for all analyses, and quality assurance samples (blanks, duplicate analyses, and standards) were analyzed at a rate of 10%.
Stage 4-April 2010 to November 2010. In addition to water quality parameters
measured in 2009, additional physical and chemical analyses of the lake waters have been tested in the year 2010 on biweekly basis. They included measurements of the solids, alkalinity, and hardness. Water for chemical analyses was sampled and composited from the six locations with diffusers and five locations between diffusers.
4. Results
4.1 TemperatureBefore rehabilitation, thermal stratification in the big lake was observed from early June through September (Figure 5), with a maximum of 5.2˚C of difference in temperature between warm top layers (epilimnion) and cool bottom layers (hypolimnion). Stratification was strengthened in July and August, when air temperatures were the highest. Lack of temperature stratification in May and October indicated the lake was relatively well mixed during spring and autumn lake turnover.
Artificial aeration of the lake beginning in August 2009 resulted in completely mixing the lake from top to bottom in the first month. After one and a half months of aeration, the temperature difference between lake surface and bottom decreased to less than 0.5˚C. In the following year of the aeration (2010), complete homothermy was achieved in the winter months and in the early spring. Moreover, in the summer of 2010, complete destratification was observed. The maximum temperature of the near-bottom layers amounted to 23.0-25.0ºC. The minor differences between the surface and the bottom
139
(in the range of 0.5-1.0ºC) were noted only in spring or in peak of summer stagnation, during the rapid change of the air temperatures (Figure 5).
3 6 9 12 15 18 21 24 27 4/1 5/31 7/30 9/28 11/27 1/26 3/27 5/26 7/25 9/23 11/22 1/21 3/22 5/21 7/20 9/18 11/17 Te m pe ra tu re ˚ C Date
Surface Middle Bottom
2006 2009
Aeration started on 08/20/2009
2010
Figure 5. Average temperature in the surface, middle and near bottom waters 4.2 DO
Before restoration, DO concentrations at the water surface ranged from 11 to 16 mg L-1 (often above 150% saturation), a result attributed to large oxygen production by plants photosynthesis in the lake. Near the bottom, DO concentrations kept decreasing from spring to full oxygen depletion in the summer, during the period of thermal stratification.
With the start of aeration, the entire lake was well mixed, and the differences in DO concentrations between surface and bottom decreased markedly. Nevertheless, because the hypolimnetic water was hypoxic with accumulated sulfide and organic matter, the mix of surface and bottom water consumed DO rapidly. As a result, the DO in the entire lake declined remarkably to lower than 1 mg L-1, causing a severe fish kill during the first week of the aeration. The oxygen level started to recover to 6.6 (surface) and 6.5 (bottom) mg L -1 in early October 2009, one and a half months after the aeration. Initially, the HS
-consumed the oxygen in the lake as it was oxidized to SO42-, but as this demand was
satisfied; the DO began to rise steadily reaching about 7 mg L-1 by the middle of November before the lake iced over. The reason that it has not climbed further is that the organic material at the bottom of the lake is still consuming oxygen as it decomposes.
Much better results were obtained in the second year of aeration. The DO content in surface water ranged from 5.8 mg L-1 to 11.2 mg L-1. Differences in the DO concentrations between the surface and bottom were within 2 mg L-1 on the sampling date July 15, 30, and August 12 and 26, the hottest time of 2010 in Colorado, and the differences are within 0.5 mg L-1 for the rest of the sampling dates in 2010. The DO profile indicated that the lake is well mixed and recovered from the hypoxic condition (Figure 6).
140 0 2 4 6 8 10 12 14 16 18 4/1 5/31 7/30 9/28 11/27 1/26 3/27 5/26 7/25 9/23 11/22 1/21 3/22 5/21 7/20 9/18 11/17 DO m g L -1 Date
Surface Middle Bottom
2006 2009 2010
Aeration started on 08/20/2009
Figure 6. Average DO in the surface, middle and near bottom waters 4.3 Sulfide
Sulfide concentrations at the surface of the lake were undetectable until aeration started. With aeration, the surface H2S concentrations increased to 2.5 mg L-1 due to “pumping of the bottom water to the surface”. Since the odor threshold of H2S is 0.002 mg L-1, the mixing of the lake produced very pungent H2S odor that upset a number of residents that live in the vicinity of the lake. But the H2S level (Figure 7) in the water had dropped to 1 mg L-1 by the middle of September 2009, and the surface water had dropped in
concentration to nearly zero by mid-October at which time the H2S odor was no longer detectable. The water at the bottom of the lake is still at 0.5 mg L-1 because the anaerobic sediments on the lake bottom continue to produce H2S. But since the surface H2S
concentration is lower than the bottom concentration, this means that the H2S is being oxidized before it reaches the surface, there currently is no odor observed by lake visitors. H2S concentration was undetectable in the following year of 2010. With the increase of DO contents and decrease of H2S, fish, crayfish, submerged plants were observed in the early spring of 2010.
4.4 pH and conductivity
Before aeration, the maximum pH for the surface layer was around 10 during summer season, which is usually associated with aquatic plant growth. Nonetheless, the pH of the lake bottom was mainly around 7.5. The epilimnion pH decreased steadily following installation of the aeration system. The variability between surface and bottom was
gradually reduced to within 0.5 after about one month of aeration. In the year 2010, the pH of the water column is similar from surface to bottom (Figure 8).
Conductivity specifies the amount of ions in water, and indicates, among other things, its salinity, dissolved nutrient concentration and dissolved solids concentration. Before aeration, conductivity increased with depth and the bottom value was about two to three
141
times that of the surface. The variability between surface and bottom was gradually reduced when the aeration system was carried out. In the year 2010, the differences in conductivity of the water column is reduced to less than 4% (Figure 9).
0 0.5 1 1.5 2 2.5 3 7/1 7/15 7/29 8/12 8/26 9/9 9/23 10/7 10/21 11/4 11/18 Date H2 S, m g L -1 Surface Bottom Aeration started on 08/20/2009
Figure 7. H2S before and after aeration in the in the surface and near bottom waters
6 6.5 7 7.5 8 8.5 9 9.5 10 10.5 4/1 5/31 7/30 9/28 11/27 1/26 3/27 5/26 7/25 9/23 11/22 1/21 3/22 5/21 7/20 9/18 11/17 pH Date
Surface Middle Bottom
2009
2006 2010
Aeration started on 08/20/2009
142 0 0.5 1 1.5 2 2.5 3 3.5 4 4.5 5 5.5 6 4/1 5/31 7/30 9/28 11/27 1/26 3/27 5/26 7/25 9/23 11/22 1/21 3/22 5/21 7/20 9/18 11/17 Co nd uc tiv ity µs cm -1 ×10 3 Date
Surface Middle Bottom
2006 2010
Aeration started on 08/20/2009
Figure 9. Average conductivity in the surface, middle and near bottom waters 4.5 Nutrients and solids
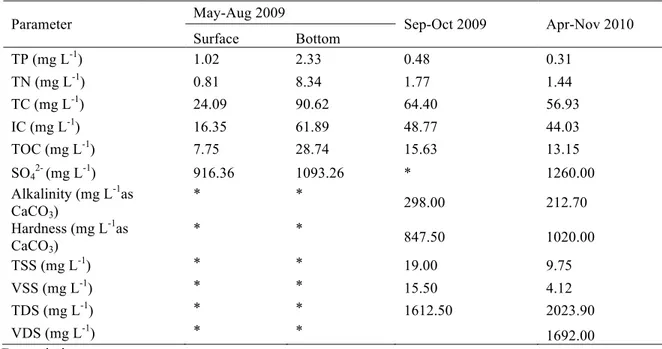
Before aeration, the phosphorus, nitrogen and carbon concentrations varied widely from surface to bottom (Table 1). The artificial aeration has caused significant reduction of the total phosphorus (TP) in the lake from surface to bottom, reduced bottom nitrogen compound 5.8 times, and decreased the total organic carbon (TOC) by 54% for the near bottom water (Table 1). Before rehabilitation, the summer stratification caused the
hypolimnion to be anoxic, and phosphorus becomes more soluble, and is released from the bottom sediments into the hypolimnion, and diffuses upward toward the water surfaces. Cerco (1989) and Höchener (1994) report that in anoxic or hypoxic conditions,
ammonium-N is released from bottom sediment to water and diffuses into water columns. Artificial aeration destroyed the stratification and increased the bottom water’s oxygen content. It follows that P, and ammonium-N released from the sediment was significantly reduced and meanwhile the decomposition of TOC was promoted. However, the results after aeration were still higher than the surface value before aeration. As a result, multi-year aeration is required.
The alkalinity and suspended solids of the lake were reduced after the rehabilitation, while the hardness and sulfate concentration increased. The increase of sulfate is because of the oxidation of sulfide to sulfate.
5. Discussion
As determined from water quality analysis results, artificial aeration demonstrates great potential in gradually improving the lake conditions. This has been indicated by: breaking up the thermal stratification, increasing DO content in the entire lake water column, eliminating hydrogen sulfide odor problems during lake turn over in spring and fall,
reducing the total phosphorus concentration of the whole lake, and decreasing nitrogen and organic carbon compounds in the near bottom waters.
143
Multi-year artificial aeration as a lake rehabilitation may cause permanent
improvements and benefits to the lake ecosystems. Water quality monitoring is expected to continue through 2011 and the following years to see the long term effects on lake trophic status, primary production, and lake ecology, including: phytoplankton, macrovertebrates and zooplankton compositions.
Table 1 Chemical analysis of Fossil Creek Lake
Parameter May-Aug 2009 Sep-Oct 2009 Apr-Nov 2010
Surface Bottom TP (mg L-1) 1.02 2.33 0.48 0.31 TN (mg L-1) 0.81 8.34 1.77 1.44 TC (mg L-1) 24.09 90.62 64.40 56.93 IC (mg L-1) 16.35 61.89 48.77 44.03 TOC (mg L-1) 7.75 28.74 15.63 13.15 SO42- (mg L-1) 916.36 1093.26 * 1260.00 Alkalinity (mg L-1as CaCO3) * * 298.00 212.70 Hardness (mg L-1as CaCO3) * * 847.50 1020.00 TSS (mg L-1) * * 19.00 9.75 VSS (mg L-1) * * 15.50 4.12 TDS (mg L-1) * * 1612.50 2023.90 VDS (mg L-1) * * 1692.00 * Data missing References
Birch, S. and McCaskie, J. (1999). Shallow urban lakes: a challenge for lake management. Hydrobiologia, 395-396(0):365-378.
Cerco C. F. Measured and modelled effects of temperature, dissolved oxygen and nutrient concentration on sediment – water nutrient - exchange. Hydrobiology, 174, 185, 1989.
Eaton, A.D., L. S. Clesceri, and A. E. Greenburg, 1998. Standard Methods for the Examination of Water and Wastewater, 20th Edition. American Public Health Association, AWWA, and Water Environment Federation.
Grochowska, J *, Gawrońska, H, 2004. Restoration Effectiveness of a Degraded Lake Using Multi-Year Artificial Aeration. Polish Journal of Environmental Studies Vol. 13, No. 6, 671-681
Höhener P., Gächter R. Nitrogen cycling across the sediment – water interface in an eutrophic, artificially oxygenated lake. Aquatic Sciences, 56/2, 115, 1994.
Kalff, J. (2002). Limnology: inland water ecosystems. Upper Saddle River, NJ: Prentice Hall, 572. Oberholster, P. J., Botha, A, M., Cloete, and T. E. (2007). Ecological implications of artificial mixing and
bottom-sediment removal for a shallow urban lake, Lake Sheldon, Colorado. Lakes & Reservoirs: Research and Management, 12(2):73-86.
Søndergaard, M., Jeppesen, E., Jensen, J.P., Amsinck, S.L., 2005. Water Framework Directive: Ecological Classification of Danish lakes. J. Appl. Ecol. 42, 616–629.
Wetzel, R. G. (2001). Limnology: lake and river ecosystems. 3rd ed. San Diego, Calif.: Academic Press, 1006.