Preliminary performance evaluation of the Penman-Monteith
evapotranspiration equation in southeastern Colorado
Abhinaya Subedi1, José L. Chávez, and Allan A. Andales
Department of Civil and Environmental Engineering, Colorado State University
Abstract. Accurate estimation of crop evapotranspiration (ET) is important to know how much water is required during the growing season, to improve crop water management, to conserve soil and water resources and for water rights purposes. Various forms of semi-empirical equations have been developed to estimate crop ET. The ASCE-EWRI Standardized Penman-Monteith (PM) equation and the full version of the Penman-Monteith equation have been used in this study to estimate alfalfa ET. The ASCE-EWRI Standardized PM equation along with crop coefficients (Kc) can be used to estimate actual crop ET. The full version of the PM equation can be applied to calculate actual ET directly for unstressed crop conditions using weather and crop variables. In this study, both PM ET methods were evaluated using a monolithic precision weighing lysimeter. The research was carried out at the Colorado State University- Arkansas Valley Research Center, Rocky Ford, Colorado. Data from 2009 and 2010 from a large precision monolithic weighing lysimeter were used. The performance evaluation of the PM equations was done for different atmospheric stability conditions. The statistical analysis included the mean absolute error, mean biased error, root mean squared error, linear regression slope-intercept (and goodness of fit), and the index of agreement. The evaluation was done using days where the alfalfa was at reference conditions. The results showed that both PM ET methods compared satisfactorily with the
lysimeter ET values, however, both methods underestimated actual alfalfa ET. It was also observed that the bias was larger in unstable than in stable atmospheric condition for both methods.
1. Introduction
Irrigated agriculture is the largest consumer of freshwater resources in the world. Irrigation consumes about 80 per cent of the water resources. The increase in human population and increased urbanization has demanded more water for other purposes. One way to improve irrigation water management is to schedule irrigation by estimating the crop water consumption by means of a reference crop ET coupled with crop coefficients (Andales et. al., 2011). Hence an efficient use of the irrigation water is required. Penman (1948) developed a famous equation to determine the evaporation rate from open water surface. Later on, Monteith (1965) included surface resistance and aerodynamic resistance terms to calculate the evapotranspiration (ET) from a cropped surface. Evapotranspiration is also termed the consumptive use of water by plants, as it is the water needed for the crop metabolic activity. The quantification of ET water is necessary to actually determine the water requirements by crops. Various ET measurement techniques have been developed to date. Some of the ET determination methods include the Lysimeter method, Eddy
Covariance method, Scintillometry method, Remote Sensing-based methods, Bowen Ratio method and Penman Monteith method. Among these methods, lysimetry is considered the most accurate method as it can measure ET precisely using the soil water mass balance
1 Civil and Environmental Engineering Department Colorado State University
Fort Collins, CO 80523-1372 Tel: (970)491-1141
method. If the precipitation, irrigation, runoff, deep percolation, capillary rise and change in soil water storage are known, then ET can be calculated using equation (1).
𝐸𝑇 = 𝑃 + 𝐼𝑟𝑟 + 𝐶𝑅 − 𝑅𝑂 − 𝐷𝑃 ± ∆𝑆 (1)
where ET=evapotranspiration (mm), P = precipitation (mm), Irr = net irrigation water applied (mm), CR = capillary rise (mm), RO = runoff (mm), DP = deep percolation (mm) and ΔS = change in soil water storage (mm). If the change in soil water storage is positive, then the sign in the equation will be negative and vice-versa. In a lysimeter where the water table is not allowed to build up, then there will be no capillary rise. Also, runoff does not occur from the lysimeter surface because of the side walls that protrude a few
centimeters above the soil surface. Deep percolation from the bottom of the lysimeter is collected and precisely measured by mass. Hence the above equation can be reduced for the lysimeter as:
𝐸𝑇 = 𝑃 + 𝐼𝑟𝑟 − 𝐷𝑃 ± ∆𝑆 (2)
Weighing lysimeters have become standard tools for evapotranspiration measurements (Howell et. al., 1991). However, it is expensive to install and maintain. Penman-Monteith equation is the other method to calculate ET, which is a combination equation of energy balance and aerodynamic terms. This method is generally used in irrigation scheduling purposes by irrigation engineers, water managers and crop scientists. Data from the nearest weather station is used as an input for the equation. The advantage of using PM method is that ET can be estimated easily just by using the weather station data.
There are many forms of the Penman-Monteith equations developed to date. However, the mostly used equations for the tall reference crop (e.g. alfalfa) are the full version Penman-Monteith equation and the ASCE-EWRI Standardized Reference
Evapotranspiration equation. Full version Penman-Monteith equation consists of terms for net solar radiation, soil heat flux, slope of saturation vapor pressure and temperature, vapor pressure deficit, air density, specific heat at constant pressure, aerodynamic resistance for heat and water vapor and surface resistance. However, in the ASCE-EWRI Standardized Reference Evapotranspiration equation, the latter four variables of full version Penman-Monteith equation are standardized for two reference crops (alfalfa or grass) and some empirical constants are included for simplicity. Full version Penman-Monteith equation is a physically derived equation whereas the ASCE-EWRI Standardized Reference
Evapotranspiration equation is a semi- empirical equation. Full version Penman-Monteith equation can be applied to calculate ET for any crop, for any height and for any time steps; however, it is relatively difficult to calculate the aerodynamic and surface resistances. The Standardized Reference Evapotranspiration equation was developed basically to overcome those limitations of the full version Penman-Monteith equation by replacing the resistance terms with constants (standard resistance value derived from standard “set” crop heights and surface homogeneity) and can be used to calculate reference crop ET from grass or alfalfa for hourly or daily time steps for reference (standard) conditions.
Reference Evapotranspiration is defined as the ET rate from a uniform surface of dense, actively growing vegetation having specified height and surface resistance, not short of soil water, and representing an expanse of at least 100 m of the same or similar
vegetation (ASCE-EWRI, 2005). Two ETref surfaces, clipped short (grass) and tall crop
(alfalfa) were used, where ETos is defined as evapotranspiration from short crop having a
height of 12 cm and a daily surface resistance of 70 s/m and ETrs is defined as the
evapotranspiration from tall crop having a height of 50 cm and a daily surface resistance of 45 s/m (ASCE-EWRI, 2005). The crop coefficients (Kc) are needed to calculate the actual
crop ET for crops other than grass and alfalfa to be used in the Standardized equation. The objective of this study was to assess which of these two methods work better to quantify ET for the alfalfa reference crop in reference conditions in Southeastern plains of
Colorado.
2. Materials and Methods
2.1 ASCE-EWRI Standardized Evapotranspiration Equation
The ASCE Standardized Reference Evapotranspiration Equation is based on the Penman-Monteith equation, with some simplification and standardization on the aerodynamic and surface resistances. The equation is as follows:
𝐸𝑇𝑠𝑧 =0.408 ∆ 𝑅!− 𝐺 + 𝛾 𝐶! 𝑢!
𝑒!− 𝑒! 𝑇 + 273
𝛥 + 𝛾 1 + 𝐶! 𝑈! (3)
where:
ETsz = standardized reference crop evapotranspiration for short crop (grass) (ETos) or
tall crop (alfalfa) (ETrs) surfaces (mm d-1 for daily time steps or mm/h for hourly
time steps)
Rn = calculated net radiation at the crop surface (MJ m-2 d-1 for daily time steps or MJ
m-2 h-1 for hourly time steps)
G = soil heat flux density at the soil surface (MJ m-2 d-1 for daily time steps or MJ m-2 h-1 for hourly time steps)
T = mean daily of hourly air temperature at 1.5 to 2.5 m height (°C) U2 = mean daily or hourly wind speed at 2 m height (m/s)
es = saturation vapor pressure at 1.5 to 2.5 m height (kPa), calculated for daily time
steps as the average of saturation vapor pressure at maximum and minimum air temperature
ea = mean actual vapor pressure at 1.5 to 2.5 m height (kPa)
Δ = slope of the saturation vapor pressure – temperature curve (kPa °C-1) γ = psychrometric constant (kPa °C-1)
Cn = numerator constant that changes with reference type and calculation time step (K
mm s3 Mg-1 d-1 or K mm s3/Mg-1/h-1)
Cd = denominator constant that changes with reference type and calculation time step
(s/m)
Units for the 0.408 coefficient are m2 mm MJ-1
The values for Cn for the short and tall references are 900 and 1600 respectively for the
daily time steps whereas 37 and 66 for hourly time steps. Similarly the values for Cd for
short and tall references are 0.34 and 0.38 for daily time steps whereas 0.24 and 0.96 for short-daytime and short-nighttime respectively and 0.25 and 1.7 for long-daytime and long-nighttime respectively.
2.2 Full version Penman-Monteith Equation
The full version of the Penman-Monteith equation is as follows: 𝐸𝑇 = 𝛥 𝑅! − 𝐺 + 𝜌𝐶! 𝑒!− 𝑒! ∗ 𝐷𝑟!
𝛥 + 𝛾 1 + 𝑟!
𝑟!
/𝜆𝜌! (4)
where
ET = evapotranspiration for required time step Rn = net radiation at the cropped surface (MJ m-2 h-1)
G = soil heat flux density at the soil surface (MJ m-2 h-1)
Δ = slope of the saturation vapor pressure – temperature curve (kPa °C-1) ρ = mean air density at constant pressure (kg m-3)
Cp = specific heat of the air (MJ kg-1°C-1)
es = saturation vapor pressure of air measured at 1.5 – 2m (k Pa)
ea = actual vapor pressure of air (k Pa)
rs = bulk surface resistance (s m-1)
ra = aerodynamic resistance (s m-1)
D = time conversion factor (3,600 for hourly time steps and 86,400 for the daily time steps)
λ = latent heat of vaporization (MJ kg-1) ρw = density of water (kg m-3)
The full version of the Penman-Monteith equation can also be used to calculate ET at shorter time steps than hourly time steps. To calculate ET on a second by second time step, Rn and G should be calculated or measured every second, then the unit would be MJ m-2 s-1 and the coefficient of D would be one.
For full version of the Penman-Monteith equation, the canopy resistance (rs) and the
aerodynamic resistance (ra) were calculated using Allen et. al. (1994) equations:
𝑟! = 𝑟!
0.5𝐿𝐴𝐼 (5)
where rs is the canopy resistance (s m-1), r1 is the stomatal resistance taken as 100 s m-1,
and LAI is leaf area index.
𝑟! = ln( 𝑧!− 𝑑 /𝑧!") ∗ ln ( 𝑧!− 𝑑 /𝑧!!)/𝑘!𝑈
! (6)
where ra is the aerodynamic resistance (s/m) for neutral atmospheric conditions, zm is
height of wind measurements (m), zh is height of humidity measurements (m), d is zero
plane displacement height (m) = 0.67hc, hc is the crop height (m), zom = 0.123 hc is the
roughness length governing transfer of heat and vapor (m), k is von-Karman’s constant (taken as 0.41), and uz is wind speed at height z (m/s).
Leaf area index (LAI) was calculated using Jensen et.al. (1990):
2.3 Research Site
The research was carried out at the Colorado State University-Arkansas Valley
Research Center, Rocky Ford, Colorado. The geographic coordinates of the site were 38°2’ N and 103°41’ W and the elevation was 1,274 m from mean sea level. The dimension of the research field was 160 m by 250 m and the field covered was alfalfa for years 2009 and 2010. A large monolithic weighing lysimeter was located in the middle of the alfalfa field. As part of the instrumentation in the field, there was a net radiometer (Q 7.1 net
radiometer, REBS, CSI, Logan, Utah, USA), two infra-red thermometers (IRT Apogee model SI-111, CSI, Logan, Utah, USA) to measure crop radiometric surface temperature, soil heat flux plates (REBS model HFT3, CSI, Logan, Utah, USA) buried in the ground at the lysimeter locations, with depths ranging from 8 to 15 cm, along with soil temperature and soil water content sensors, for the estimation of soil heat flux at the ground surface.
Hourly calculation was done for both of the Penman-Monteith methods. The American Society of Civil Engineers (ASCE) Standardized Reference Evapotranspiration Equation was used following the recommendations of ASCE-EWRI Task Committee Report (2005). For both equations, measured wind speed was adjusted to simulate the wind speed from grass surface (0.12 m tall) at 2m height following the procedure outlined by Allen and Wright (1997), as suggested by Ley. et. al. (2009).
Actual evapotranspiration was measured using the large weighing monolithic lysimeter. The lysimeter load cell output was obtained every 10 seconds and 15 min averages were recorded throughout each growing season. A calibration was performed to convert the load cell output (mV/V) to the change in soil water content (mm). The fifteen minute average values of the load cell were used to get the actual ET from the lysimeter. Days with irrigation and precipitation were excluded from the analysis. For the evaluation of the both equations, the comparison was done when the crop was at reference height (45-55 cm), when there was no soil water stress and when there was no horizontal heat
advection. The surface area of the lysimeter was 3m x 3m. 2.4 Evaluation Criteria
The statistical computations that were used in this study were: 1. Mean Absolute Error (MAE), 2. Mean Biased Error (MBE), 3. Root Mean Squared Error (RMSE), 4. Linear Regression Slope and Intercept with Goodness of Fit, and 5. Index of Agreement. The ASCE Standardized Penman Monteith equation and also the full version Penman Monteith equation were compared against the measured lysimeter ET for years 2009 and 2010 for both stable and unstable conditions.
3. Results and Discussion
Data collected during the period March 30 to October 14 data were used for year 2009 and data from April 10 to October 05 were used for year 2010. Then a set of data from both years which satisfied the 45-55 cm of crop height, no advection and no soil water stress conditions were selected. Advection was considered when latent heat flux was greater than the net available energy and also when the wind speed was greater than 2 m/s. The ASCE Standardized Penman Monteith equation and also the full version of the
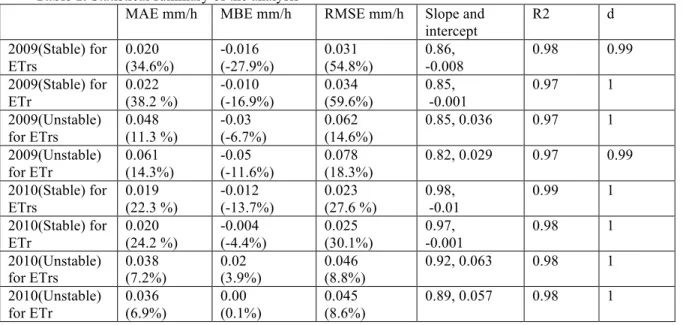
Penman Monteith equation were used to calculate the reference alfalfa ET for the reference conditions. Table 1 was obtained when both PM equations were compared against the lysimeter ET for stable and unstable atmospheric conditions. In Table 1, ETrs stands for ASCE Standardized Alfalfa Reference Evapotranspiration equation whereas ETr stands for full version of the Penman Monteith equation.
Table 1. Statistical summary of the analysis
MAE mm/h MBE mm/h RMSE mm/h Slope and intercept R2 d 2009(Stable) for ETrs 0.020 (34.6%) -0.016 (-27.9%) 0.031 (54.8%) 0.86, -0.008 0.98 0.99 2009(Stable) for ETr 0.022 (38.2 %) -0.010 (-16.9%) 0.034 (59.6%) 0.85, -0.001 0.97 1 2009(Unstable) for ETrs 0.048 (11.3 %) -0.03 (-6.7%) 0.062 (14.6%) 0.85, 0.036 0.97 1 2009(Unstable) for ETr 0.061 (14.3%) -0.05 (-11.6%) 0.078 (18.3%) 0.82, 0.029 0.97 0.99 2010(Stable) for ETrs 0.019 (22.3 %) -0.012 (-13.7%) 0.023 (27.6 %) 0.98, -0.01 0.99 1 2010(Stable) for ETr 0.020 (24.2 %) -0.004 (-4.4%) 0.025 (30.1%) 0.97, -0.001 0.98 1 2010(Unstable) for ETrs 0.038 (7.2%) 0.02 (3.9%) 0.046 (8.8%) 0.92, 0.063 0.98 1 2010(Unstable) for ETr 0.036 (6.9%) 0.00 (0.1%) 0.045 (8.6%) 0.89, 0.057 0.98 1
The statistical analysis derived from Table 1 showed that in 2009, the PM calculated ET drifted more from the actual alfalfa ET compared to 2010. Also both equations yielded very similar slopes and errors when compared with actual ET. In the case of the stable atmospheric condition, the error percentage seemed to be large because of the calculation of very small numbers. The goodness of fit and index of agreement in all cases were close to one, which suggests that both equations were very well correlated with actual ET measurements. It was also observed from the slope-intercept that in all the cases, both versions of the PM equation underestimated ET. Another important observation was that in unstable atmospheric conditions, the error was larger than in the stable atmospheric
condition for both equations, although the difference was observed more in 2009 than in 2010.
In the Penman-Monteith equation, only the air temperature at 2m height is used in the calculation. The surface temperature has been eliminated from the set of equations, which affects the slope of temperature-saturation vapor pressure (Δ) and the saturation vapor pressure (es) in the Penman-Monteith equation. The error associated with these two terms
might be responsible in the underestimation of ET using the PM equation. This error might also have played a role in underestimating ET more under unstable atmospheric conditions compared to the stable atmospheric conditions.
4. Conclusion
The preliminary evaluation of the reference ET computations, in Southeastern CO, showed that both the ASCE Standardized Penman-Monteith Reference Evapotranspiration equation and the full version of the Penman-Monteith Equation underestimated ET. Also it
was found that under unstable atmospheric conditions, the bias was larger and more frequent than during the stable atmospheric conditions. The exclusion of the surface temperature in the original (full) Penman-Monteith equation might be responsible for both of these results.
References
Allen, R.G., Smith, M., Perrier, A., and Pereira, L.S. 1994. An Update for the Calculation of Reference Evapotranspiration. ICID Bulletin 43 (2): 35-92.
Andales, A.A., Chavez, J.L., and Bauder, T.A. 2012. Irrigation Scheduling: The Water Balance Approach. Colorado State University Extension. http://www.ext.colostate.edu/pubs/crops/04707.html. Accessed: 02/18/2013.
ASCE-EWRI 2005. The ASCE Standardized Reference Evapotranspiration Equation. In: Allen RG, Walter IA, Elliot RL et al. (eds.) Environmental and Water Resources Institute (EWRI) of the American Society of Civil Engineers, ASCE, Standardization of Reference Evapotranspiration Task Committee Final Report, 213 pp. Reston, VA: American Society of Civil Engineers (ASCE).
Howell, T.A., A.D. Schneider, and M.E. Jensen. 1991. History of Lysimeter Design and Use for Evapotranspiration Measurements. In Lysimeters for Evapotranspiration and Environmental
Measurements: Proc. Intl. Symp. Lysimetry, 1-9. R.G. Allen, T.A. Howell, W.O. Pruitt, I.A. Walter, and M.E. Jensen, eds, Reston, Va.:ASCE.
Jensen, M.E., R.D. Burman, and R.G. Allen. 1990. Evapotranspiration and Irrigation Water Requirements. ASCE Manual No. 70, Am. Soc. Civ. Engr., New York, NY.
Ley, W.T., Allen, R.G., and Jensen, M.E. 2009. Adjusting Wind Speed Measured over Variable Height Alfalfa for Use in the ASCE Standardized Penman Monteith Equation. World Environmental and Water Resources Congress 2009: Great Rivers 2009 ASCE.
Penman, H.L. 1948. Natural Evaporation from Open Water, Bare Soil and Grass. Proceedings of the Royal Society of London. Series A, Mathematical and Physical Sciences, Vol. 193, No. 1032, pp. 120-145.