The Consequences of Post-Merger & Acquisition Performance in
Listed and Non-Listed Companies in Sweden
A Case Study for AstraZeneca AB, Cybercom Group AB, Grant Thornton Sweden AB and PayEx
Authors: Emmanuel Kwaasi Adjei and Kelvin Ubabuko Subject: Master Thesis in Business Administration 15 ECTS
Program: Master of International Management
Gotland University Autumn semester 2011
Abstract
Empirical research findings on the consequences of post-M&A performance have generated several result, although most of which are inconsistent. The relation of such post-M&A performances to non-listed and listed companies can be relative especially when considering the companies economic and financial structure and other prevailing factors associated to the host country. However, most of these have been attributed to the choice of performance measurement indicators. This paper analyses and evaluates existing performance indicators that have been employed in the literature. It is argued that to overcome the limitations found in financial indicators of performance, a need to pursue multiple measures of performance in post-M&A research is needed. It also argues that the motives for the transaction should also be included as performance indicators. This hybrid approach will allow researchers and practitioners to measure the overall success of merger and acquisitions.
Keywords: Post-Merger and Acquisition Performance; Synergy Rationales; Return on Equity; Return on Capital Employed
Contents
1. Introduction ...1
1.1. Background ...1
1.2. Research Question ...2
1.4. Research Purpose ...3
1.5. Outline of the Study ...3
2. Literature Review ...4
2.1. Merger Rationales and Post Merger Performance Theories ...4
3. Data and Methodology ...8
3.1. Data ...8
3.2. Methodology ... 11
3.2.1. Hypothesis... 11
4. Results ... 17
4.1. Non –Listed Companies ... 18
4. 1.1. PayEx ... 19
4.1.2. Grant Thornton ... 19
4.1.3. Analysing The Hypothesis for M&A Rationales in Non –Listed Companies ... 19
4.1.4. Analysing The Hypothesis for Post-M&A Performance in Non-Listed Companies ... 21
4.2. Listed Companies ... 23
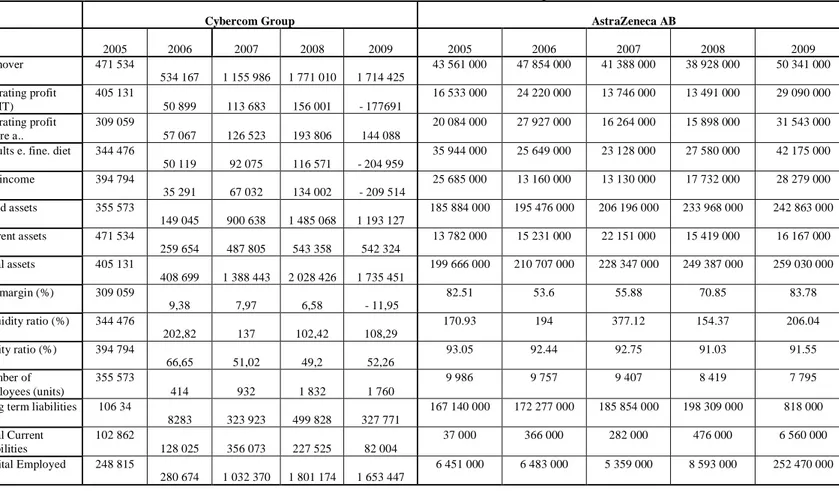
4.2.1. Cybercom Group (listed) ... 23
4.2.2. AstraZeneca ... 23
4.2.3. Analysing the Hypothesis (H1) for M&A Rationales in Listed Companies ... 24
4.2.4. Analysing the Hypothesis (H2) for Post-M&A Performance in Listed Companies ... 25
4.3. Comparing Non-listed and Listed companies using the following Descriptive Statistics; leverage level, ROE, ROCE, Fixed Asset Turnover ratio, Capital Turnover ratio ... 28
5. Summary ... 30
5.1. Conclusion ... 30
References ... 31
ABREVATION MEANING
M&A MERGER AND ACQUISITION
EC EUEROPEAN COMMISSION
LBO LEVERAGE BUYOUT
MDA MULTIPLE DISCRIMINANT ANALYSIS
PV PRESENT VALUE
ROE RETURN ON EQUITY
EBIT EARNING BEFORE TAX & INTEREST
R&D RESEARCH AND DEVELOPMENT
ROCE RETURN ON CAPITAL EMPLOYED
SIC STANDARD INDUSTRIAL CLASSIFICATION CODE
NPV NET PRESENT VALUE
CEO CHIEF EXECUTIVE OFFICER
CFO CHIEF FINANCIAL OFFICER
EU EUROPEAN UNION
EUR EURO CURRENCY
SEK SWEDISH KRONA
P PENDING
C COMPLETE
FAT FIXED ASSET TURNOVER
GR GEARING RATIO
1
1. Introduction
1.1. Background
Empirical research on mergers and acquisitions (M&A) has shown a great deal about trends and characteristics of M&A activities over the last century. For example, event studies have demonstrated that mergers tend to create shareholder value, with most of the gains accruing to the target firm. But on the issue of why mergers occur, research has been more limited. Economic theory has provided many possible reasons for why mergers might occur: efficiency-related reasons that often involve economies of scale or other synergies; attempts to create market power, perhaps by forming monopolies or oligopolies; market discipline, as in the case of the removal of incompetent target management; self-serving attempts by acquirer management to over-expand and other agency costs and to take opportunities for diversification as reported by Pazarskis et al., (2006).
Most of these theories have been found to explain some of the mergers over the last century, and thus are clearly relevant to a comprehensive understanding of what drives acquisitions. In addition, some of these reasons for mergers appear to be more relevant in certain time periods. For example, the EC law on fair competition and active enforcement have made merger for market power difficult to achieve most recently. Also, standardizations in international trade have made it easy for companies to trade and create partnership across their national frontiers in order to take the full advantage of globalization.
Credit crunch, legal services reforms, threats to legal aid, the competitive environment for small businesses exhibits more threats than opportunities. Traditional markets are at risk from new entrants and the availability of substitutes for the services that are traditionally supplied by solicitors. Small firms are faced with recession, higher levels of client sophistication and expectation, greater levels of regulatory control and increasing legal complexity. They face competitive pressure from one another and from larger firms. More importantly, they face competitive pressure from large retailers, membership organizations and possibly banks, building societies and insurers in many of their core business areas as reported by Zarotiadis and Pazarskis (2003).
In 2010, the Nordic economies begin to put the economic crisis behind them. Having weathered the storm, they are in comparatively better shape than many of their European or other developed economy counterparts. With sometimes extensive restructuring and cost control programmes completed, healthier balance sheets and better performance led many to return to the acquisition trail over the course of the year. Sweden is the largest M&A market in the Nordic region, representing a little over one-third of the number of transactions in the region. Perhaps surprisingly, Norway came in second in terms of both deal volumes and values, at 23% and 36% respectively. The Danes were only one deal behind the Norwegians but with a much lower average deal size, while Finland still maintained a respectable 18 % of regional deal volume. Sweden accounted for roughly one-third of all regional M&A flows
2
over the 2005 to 2010 period, making the country the largest Nordic market with some 1,414 deals collectively valued at EUR1 11.93 billion brokered over the six years as reported by KPMG International, (2011).
1.2. Research Question
From several past research papers on accounting and finance, there is a common agreement that stock price performance studies are unable to determine whether M&As create real economic gains or losses and to provide evidence on the sources of any merger-related economic result, as it difficult to distinguish between stock-market inefficiencies and improvements in economic performance resulting from the merger. The examined high equity values are typically attributed to some unmeasured source of real economic factors (such as synergy) or a general and not well established idea (as management past decisions). It is obvious that this kind of research, along with their explanations, could partially not be correct, as many other factors influence stock prices and their conclusions do not provide clear consciousness of their result argumentation as reported by Pazarskis et al., (2006).
Operating performance studies attempt to identify the sources of gains from mergers and to determine whether the expected gains at announcement are ever actually realized. If mergers truly create value for shareholders, the gains should eventually show up in the firms‟ cash flows. However, in this study, we investigate the rationale behind these mergers, how a company can acquire another company from the financial perspective and in -what extent listed and non-listed companies in and around Sweden improve their profitability subsequent to the completion of takeover transactions and post M&A performances.
In order to examine the phenomenon of post M&As in Sweden, this study proceeds to an empirical analysis for the post-merger performance of four Sweden companies, of which two of those are trading on the NASDAQ OMX Nordic exchange and has executed at least one M&A in the last 5 years, and therefore using financial and non-financial characteristics and attempts to investigate the rationales and the effects of M&As on their post M&A performances considering the variables such as profitability, efficiency and liquidity.
The research question is appealing for the following three reasons. First, empirical evidence on the post-M&A performance of Swedish firms is virtually non-existent. Second, even for the EU, research on the improvement of post-merger operating performance is rather limited and its conclusions are contradictory, although some studies document a significant improvement in operating performance following acquisitions as reported by Rahman and Limmack (2004). Others reveal a significant decline in post-M&A operating performance as reported by Kruse et al., (2002) and Yeh and Hoshino (2002).
Our study contributes to this literature by updating their evidence for the sample of the most recent Swedish M&As and by checking the robustness of the results using an up-to-date methodology of measuring the improvement or decreases in post-merger operating performance, we contribute to the literature.
3
A third reason for this study is that we intend to investigate the determinants of the changes in post-M&A profitability of bidding and target firms. In particular, we test whether characteristics of the M&A transaction such as the means profitability, liquidity and efficiency is evident in the listed and non-listed firm after merger occurs in the Swedish market, regional and globally.
1.4. Research Purpose
The main goal with this research is to analyze the rationales behind the M&A‟s in these companies and the consequences of the post M&A performance using the variables such as profitability, liquidity and efficiency. We do this as case study with respect to the following companies below:
i. PayEx (Non-listed)
ii. Grant Thornton Sweden AB (Non-Listed) iii. Cybercom Group AB (Listed)
iv. Astra Zeneca Pharmaceutical AB(Listed)
The above mentioned companies are Swedish companies with two of these been listed companies and the other two a non-listed companies.
1.5. Outline of the Study
The research work will cover five (5) chapters:
The first chapter shall provide an outline of an introduction which includes the background, research purpose, research question and the outline of the studies
Also the second chapter will consist of the literature reviews on the related topic, which will includes; the definition of mergers and acquisitions, the definitions of sample of different techniques and measures through which organizational entities can consolidate.
The third chapter will provides an in-depth study of motivations or the rationales (energy) behind the wave of consolidations, the hypothesis and methodology of why companies merge and concludes by providing the exact degree of influence motivations exert on consolidation activities in these companies.
The fourth chapter will provide a possible Result on the post M&A performance on M&A in the companies studied and also justify if there are evidence of profitability, efficiency and liquidity. The rationales attributed to the M&A activities in the companies are also analyzed. Finally, the fifth chapter will show different highlights, summaries and conclusion for the research study.
4
2. Literature Review
2.1. Merger Rationales and Post Merger Performance Theories
Previous empirical studies yield inconsistent results about changes in post-M&A performance following corporate acquisitions. The existent empirical studies can be analyzed and characterized into three different groups: (i) studies that report a significant improvement in the post-M&A performance, (ii) those that document a significant deterioration, and (iii) those that find insignificant changes in performance employ more sophisticated techniques to measure changes in the post-M&A performance tend to show that the profitability of the bidding and target firms remain unchanged, as reported by Moeller and Schlingemann (2004) and Ghosh, (2001) or significantly improves after the takeover, as reported by Heron and Lie, (2002) and Linn and Switzer (2001).
Report according to Dickerson et al. (1997) finds a significant decline in the post-M&A performance, whereas Powell and Stark (2005) show a significant growth. Similarly to other studies, Asian studies also yield contradictory results. Evidence suggest that Japanese M&As incur a decrease in post-M&A operating performance of the merged firm, as reported by Kruse et al., (2002) and Yeh and Hoshino (2001).
For Continental Europe, as reported by Gugler, Mueller, Yurtoglu and Zulehner (2003) reported a significant decline in post-M&A sales of the combined firm, but an insignificant increase in post-M&A profit. Malaysian M&A are associated with better post-M&A performance, as reported by Rahman and Limmack, (2004), while Australian M&As lead to insignificant changes in the profitability of the bidding and target firms after the M&A as reported by Sharma and Ho (2002).
According to Harris and Raviv (1990) leverage is positively associated with liquidation value. Fixed assets can be used as collateral and thus increase the ease and improve the terms at which debt financing is available by reducing the agency costs of debt. Scott‟s (1977) secured debt hypothesis states that, ceteris paribus, firms can borrow at lower interest rates if their debt is secured with tangible assets. In the asymmetric information framework, Myers and Majluf (1984) also maintain that secured debt results in lower borrowing costs. Increases in tangibility should imply easier access to long-term debt since a number of agency costs (such as the asset substitution or the debt overhang problem) can be mitigated by the use of short-term debt or convertible debt.
Empirical evidence, as reported by Harford (1999) and Moeller and Schlingemann (2004) shows that diversifying or conglomerate M&A‟s are expected to create operational and/or financial synergies, the creation of diversified firms is associated with a number of disadvantages such as rent-seeking behavior by divisional managers, as reported by Scharfstein and Stein (2000), bargaining problems within the company as reported by Rajan et al., (2000) or bureaucratic rigidity, as reported by Shin and Stulz (1998). These disadvantages of diversification may outweigh the alleged synergies and result in poor post-M&A performance of the combined firm. Furthermore, diversifying post-M&A‟s may be an
5
outgrowth of the agency problems between managers and shareholders, as reported by Dube et al., (2007), which is also likely to result in the deterioration of corporate liquidity and performance after the M&A. While earlier studies confirm these conjectures as reported by Healy et al., (1992) and Heron and Lie (2002) but later studies find the relationship between diversifying M&A and poor post-M&A performance insignificant, as reported by Powell and Stark (2005), Linn and Switzer (2001), Switzer (1996), Sharma and Ho (2002). Furthermore, as reported by Kruse et al., (2002) and Ghosh (2001), shows that diversifying acquisitions significantly out-perform their industry-related peers.
Merger and Acquisitions of relatively large targets are more likely to achieve sizeable operating and financial synergies and economies of scale than small acquisitions, therefore leading to stronger post-acquisition operating performance. However, the acquirer of a relatively large target may face difficulties in integrating the target firm, which could lead to a deterioration of performance. There is empirical evidence in support of both conjectures, as reported by Linn and Switzer (2001) and Switzer (1996) provide evidence that acquisitions of relatively large targets outperform those of small targets. Report according to Clark and Ofek (1994) analyses those difficulties with managing a large combined firm outweigh the operating and financial synergies in large M&A which result in the deterioration of operating performance. However, most of empirical evidence reports no significant relation between the relative target size and post-M&A performance, as reported by Powell and Stark (2005), Moeller and Schlingemann (2003), Heron and Lie (2002) Sharma and Ho (2002) and Healy et al., (1992).
In cross-border acquisitions, bidding and Target Company are likely to benefit by taking advantage of imperfections in international capital, factor, and product markets, as reported by Hymer, (1976), by internalizing the R&D capabilities of target companies as reported by Eun et al., (1996), and by expanding their businesses into new markets as a response to globalization trends. As such, cross-border M&A‟s are expected to outperform their domestic peers. However, regulatory and cultural differences between the bidder and target countries may lead to complications in managing the post-M&A process and hence the failure to achieve the anticipated merger synergies. As a result of such difficulties in cross-border bids, the post-M&A performance of the combined firm may deteriorate, as reported by Conyon et al,. (2004). Also, as reported by Moeller and Schlingemann (2003), Goergen and Renneboog (2004), Martynova and Renneboog (2006) show that that firms acquiring foreign targets experience significantly lower merger announcement returns than their counterparts acquiring domestic targets. Report according to Gugler et al., (2003) shows a significant effect of cross-border deals on post-M&A operating performance.
Finance experts, economists and businessmen have argued about the effects of M&A activities on the acquiring firms‟ stock price since the 1960s. The conclusions of the debate have been decidedly mixed. M&As can affect two relevant stock prices: the price of the acquiring firm after the M&A and the premium paid on the target firm's shares during the M&A. Research on the topic suggests that the acquiring firm, in an average M&A, typically
6
doesn't enjoy better returns after the M&A. As noted in an article in the "Journal of Management" by Halebliean et al, recent research suggests that acquisitions can erode the acquiring firm's value. Some research also suggests that target firms are typically bought at a premium to share price before the merger. Target shareholders, therefore, tend to fare well, sometimes experiencing positive returns.The different payments methods available to finance an M&A deal determine the level of stock of the acquired company. Practically there are two main methods of payments used to finance M&A deals; Payments by cash or an issue of stock to shareholders at an agreed ratio. In a pure cash deal (financed from the company‟s current account), liquidity ratios might decrease. On the other hand, in a pure stock for stock transaction (financed from the issuance of new shares), the company might show lower profitability ratios (e.g. ROE and ROCE). Our research analyses the economic dilutions and validate the accounting dilutions by using performance indicators to validate the post performance of listed and non listed companies after an M&A using four Swedish companies as case study. The form of payment and financing options are tightly linked as reported by Bruner (2004).
There is direct empirical evidence that efficiency and profitability are important motive for companies to undergo M&A, the market driven acquisition theory, as reported by Shleifer & Vishny, (2002). Anticipated Profit increases the probability of firms becoming acquirers and the probability of using their own money as the medium of exchange. Once anticipated profits of the combined firms are taken into account, the merged firms do not fare worse than their matches. Compared to their matches before the merger announcement, the original acquirers‟ shareholders do not lose; instead long-term target shareholders are the losers if they do not exit around the merger dates. According to Grinblatt & Titman (2001) and other related research on post-M&A‟s, it may be friendly or hostile depending on the form the acquisition were done. An offer maybe made directly to management or its board of directors as in friendly acquisitions. Or management maybe bypass and a tender offer (price offer of shares for cash) made directly to shareholders. There are three main forms of acquisitions: Strategic, Financial and Conglomerate acquisitions. Strategic acquisitions involves operating synergies, meaning that the two firms are more profitable combined than separate.
In recent times, investors and analysts have become more skeptical about potential gains from M&A and more aware of the potential downside of combining two or more firms. Conglomerates can misallocate capital. The combination of two companies can cause decrease in value if the managers of the company use the added flexibility to transfer resources between the two firms to subsidies money – losing lines of businesses that alternatively could be shut down, as reported by Grinblatt & Titman (2001). This may occur if managers are reluctant to cut labor or has reasons to keep a losing business in operation. Managers can also reduce the information contained in Stock prices. When two firms combine, there is generally one less publicly traded stock. This can create a cost if stock prices convey information that helps managers to allocate resources, as reported by Grinblatt & Titman (2001)
7
Most literature research argues that M&A‟s is one of the mechanisms by which companies gain access to new resources through resource redeployment, increase revenues, efficiency and reduce cost. This major proposition for the M&A‟s increased activity is mainly imposed by intense competition, evolving technology, low interest rates, changing regulations in the financial markets, and many other factors, as reported by Pazarskis et al., (2006). Literature on M&A is extensive, as many multinational companies around the world today are the result of M&A between two or more companies. As with many researchers on the field but as reported by Ball and McCulloch Jr (2004), they are of the same view that a merger occurs when two or more companies agree to come together to form a new company. In the case of an acquisition, or takeover, a stronger company takes over a weaker one. Sometimes, two companies are combined into one and the one with a lesser stock is traded publicly. In others, such as leverage buyouts (LBOs), there is a transfer of ownership of a single firm. Although, we have distinguished between merger and acquisition, the two will be used interchangeably in this research.
Also, as reported by Farooqi-Lind (2006), analyzes the capital and financial structure of non-listed companies and compares it to that of non-listed companies. The researcher illustrates several reasons for non-listed company‟s capital and financial performance structure to differ from that of listed companies. First, their capital and financial performance might differ since non-listed companies means of financing options is limited compared to non-listed companies which can approach equity markets for outside financing. However, the non-listed companies tend to finance their takeover through own money thereby limiting their debt or gearing ratio. The results of the empirical literature on the overall return to mergers, however, are mixed, suggesting that mergers may have no value on average. Moreover, if there is any gain from a merger, almost all of it appears to accrue to target shareholders. There is a significant positive gain in target value upon the announcement of a bid, and a significant loss to the acquirer, as reported by Ghosh, Linn and Switzer (2001)
8
3. Data and Methodology
3.1. Data
In 2010, M&A deal values and volumes in the Nordic region bounced back after falling off sharply in the unfavorable investment environment that prevailed over much of the preceding year. Over the course of 2010, a total of 637 deals worth a combined EUR29.31 billion came to market in Denmark, Finland, Norway and Sweden. Compared to levels in 2009, this marked year-on-year increases of 52 percent and 121 percent in deal volumes and values respectively, rates far higher than comparable global figures, which stood at rises of 22 percent and 31 percent in that order, as reported by KPMG; The Annual Review of Mergers & Acquisitions in the Nordic Region, (2011).
Sweden
Sweden accounted for roughly one-third of all regional M&A flows from 2005 to 2010 period, making the country the largest Nordic market with some 1,414 deals collectively valued at EUR111.93 billion brokered over the six years. The Swedish deal market suffered more acutely from the credit crisis than its Nordic peers with the total number of acquisitions falling by 23 percent annually in 2008. Deal flow declined by nearly twice this rate in the following year, while aggregate deal value fell by 88.2 percent over year-earlier figures. In terms of activity, Swedish deal-making tapered off more quickly than any other Nordic market over 2008 and 2009 as reported by KPMG; The Annual Review of Mergers & Acquisitions in the Nordic Region, (2011).
Over the course of last year, however, M&A in Sweden experienced a brisk recovery. Indeed, deal flow in the fourth quarter rose to the highest level since the first half of 2008 with a total of 64 transactions worth a combined EUR3.6 billion. In the year as a whole, 231 transactions valued at an aggregate EUR12.71 billion came to market, up by two-thirds in volume terms and over three-fold by deal value over the prior year.
In the country‟s largest deal, Zhejiang Geely, the Chinese automobile manufacturer, acquired the iconic Swedish brand Volvo for EUR1.3 billion in March 2010 from Ford, the beleaguered USA automobile manufacturer. The landmark acquisition attracted widespread attention from the global M&A community and represented one of the few instances where a private Chinese firm successfully completed a large-cap cross border acquisition as reported by KPMG; The Annual Review of Mergers & Acquisitions in the Nordic Region, (2011). See Table 3.1.
Previous literatures studies have shown two principal rationales for M&A. Some of these theories suggest that M&A can be motivated by synergy and agency. It claims that synergy will be in the best interest of the acquiring firm‟s shareholders, this further reveal that Synergistic mergers may take place when the value of the firm after acquisition is larger than the bidder and target firm as standalone entities. Very known possible source of such increase
9
in value may be from savings from taxation due to the M&A. When a company due to the acquisition of another company inherits large net operating loss, as a result the combined firm is expected to save tax payment which will result in synergy profit. However, synergy gain can also be financial where the acquiring firm cost of capital may be reduced. This is possible where the acquiring firm issues dept at a lower interest rate due to the target firm‟s unused dept capacity as reported by Ghosh and Jain (2000).
Activities of the listed companies tend to affect either positively or negatively on the post-M&A. The reaction of the stock market firms acquisition announcement often reflect the market estimate on the trend or the effect on the value of the acquirer and the target firms. Therefore, when a synergy motivated acquisition is announced, the stock market is expected to react positively to the announcement of the acquisition. However, few years later the acquisition can be examined to determine whether the merged company performance reflects the promised synergies and as such it is expected that the combined company‟s performance should increase over the long term as synergies are realized
Other literatures further suggested that agency is another major motive why firms merge. Shareholder interests are often neglected by managers, the motive of managers acquiring other firm has proven to be mostly to their personal benefit and at the expense of the shareholders, although sales may increase but also managerial compensation will be the underlying motivation as reported by Fauli-Oller and Motta (1996). However, the stock market will react negatively since the motive of the M&A is not for the interest of the firm‟s shareholder, the company‟s value and performance. Therefore, in a long run this will deteriorate as reported by Amihud and Lev (1981).
According to Masson (2010) in order to optimize the financing structure when choosing how to finance an M&A deal; the CFO will consider many factors like debt, equity or a mix. Four main factors influence this decision. The first factor is the so-called pecking order theory, stating that managers tend to prefer internal financing versus external. So they tend to use internal funds first, then treasury stock, debt and finally equity. The second factor is how the leverage will influence the value of the company. Concretely there is an optimal financing mix where the present value of debt tax shields and the present value of expected distress and bankruptcy costs just trade off to produce a maximum value. The third factor is the momentum at which the company wants to issue debt or equity. There may be good and bad moments. Finally, depending on the asset base of the firm, lenders will allow the company to have more or less leverage. We accessed the various strategies employed in the different companies to finance their M&A deals and their post performance in areas like profitability, efficiency and leverage.
M&As may occur for economic or non-economic reasons, analyzing the M&A on its own terms is usually the best way to determine whether the merger will be profitable or not.This research attempts to find out the success rate of M&A activities on the stock of Swedish companies. Some M&As in the Swedish market are more profitable, even if most aren‟t. We analyze the financial reports for the companies to compare their positions before and after
10
their M&As to prove their viability. Previous bad financial reports of the acquired firm normally have an adverse effect on the new conglomerate investment.
In this study, we identify first the rationale and motive of the M&A and examine the effect of each acquisition on their post-performance and its consequences. The hypothesis resulting on the post-performance and rationale for the type of acquisition and its effect are tested. However, Synergy-motivated acquisitions are hypothesized to be in the interest of the acquiring shareholders, and to create value. Therefore, expect that these acquisitions have a positive effect on the company‟s motive and post-M&A performance (profitability, efficiency and liquidity). The rationale behind agency acquisitions is meant to be in the interest of acquiring company management, but not in the interest of its shareholders. In general, these acquisitions are expected to destroy firm value. Therefore, agency-motivated acquisitions are hypothesized to be associated with a negative effect on firm‟s post- performance acquisition. Finally, we expect synergy-motivated acquisitions to outperform agency-motivated acquisitions over the long-run. In particular, we test whether characteristics of the M&A transaction such as the means of share performance, return on equity, profitability and efficiency is evident in the listed and non-listed company after merger occurs in the Swedish market.
Table 3.1: Showing the major M&A deals in Sweden 2010. The statistics shows major M&A deals within and
outside of Sweden in different lines of operation and expertise.
Data from KPMG - The Annual Review of Mergers & Acquisitions in the Nordic Region, 2011 Announced Date Status Target Company Target Sector Target Country Bidder Company Bidder Country Seller Company Seller Country Deal Valued (EUR Million) March 2010 C Volvo Car
Corporation Industrial & Chemical Sweden Zhejiang Geely China Ford Motors USA 1,342
Dec 2010 P Cardo AB Industrial & Chemical
Sweden Assa Abloy AB
Sweden - - 1,245
Feb 2010 C Ambea AB Pharma,
Medical & Biotech Sweden Triton Partners UK 3l Group Plc, Govt. of Singapor UK 850
Dec 2010 P Q-Med AB Pharma,
Medical & Biotech Sweden Galderma Pharma Switzerlan d - - 744
Sep 2010 C Munters AB Industrial & Chemical
Sweden Nordic Capital
11
3.2. Methodology
In this context, the use of post-merger accounting data (and especially, financial ratios) is a better and safer path to test directly for changes in operating performance that result from M&A than stock price studies. But as there are many discussions on equity value changes, thus far, there is no particular representative methodology on M&As that could reveal a successful operating performance from financial ratios, in addition with the evaluation of certain strategic decisions from another source (for example, a questionnaire). From this point of view, a study in this perspective for Swedish business could be very interesting.
On these bases, we conduct a research on four Swedish companies that has undergone a merger over the past years to see the effect of the merger on the performance of the business. We analyze whether it is still beneficial for firms to merge or modern managers should be circumspective when combining firms with the intention of reaping the synergy effect using Swedish companies as a case study.
The analysis in this study is based on a sample of all completed mergers and partnership from the four companies mentioned as case study of which two of those are listed company in the Swedish stock market (NASDAQ OMX) and the other two are non-listed company in the Swedish market relatively between 2000 and 2010. We use both completed mergers and partnership due to the consideration of non-listed smaller companies to test the effect of the post-performance acquisition and the rationales for the merger.
Table 2-8, shows the data of M&A transaction and the financial statement in the respective companies such as; PayEx (Non-listed), Cybercom Group (Listed), AstraZeneca Pharmaceutical (Listed) and Grant Thornton (Non-Listed). The financial data, stock data includes only M&A activities as seen in the company‟s webpage, company annual report and from the interviews conducted. In some of the tables there were insufficient data to calculate for the stock market reaction and post-M&A performance in terms sales, growth, profit margin, revenue. However, substantial information was gathered through interviews conducted in the companies studied.
3.2.1. Hypothesis
We analyzed the rationales behind the M&A and the type of merger using information from the interviews conducted in the companies studied the reaction of the stock before and after the announcement of merger and other accounting information and company‟s characteristics. Then, we validate the types of rationale by examining the post-M&A performance of these companies for each acquisition. The identification of the rationale in the listed companies utilizes stock market information, strategic geographical presence, increase operation and for the non-listed companies we use other variable such as expansion, market share, competiveness and tax returns.
However, this may be insufficient therefore; we employed the methodology that improves on the simple market criterion, which is the combination of the initial market reaction
12
information and the accounting information available at the time of the merger announcement. Results to be reported later show that the joint function provides a more effective ex-ante classification than the simple market reaction criterion
The initial step is to develop a model that combines the stock market and accounting information. Our sample consists of four companies for which the necessary market and accounting data are incomplete. We partitioned the sample into two groups; which the first group is the listed companies and the second group is the non-listed companies. Then, we subjected the first group of two listed companies to a multiple discriminant analysis (MDA). The dependent variable for this analysis is the apparent type of acquisition, based on classification of the initial market reaction and the independent variables consist of various accounting relationships (also to be described later)
H1: Analyzing the Rationale for company’s M&A
Synergy Motive
Synergy motive is hypothesized to be in the interest of acquiring shareholders, which the operation of a corporate combination is more profitable than the individual profits of the firms that were combined as reported by Gjirja, (2003). In this case, the sum of individual company is smaller than their combined sum. The theory is that the management of an organization expects that synergistic benefits from investing in the M&A will be enough to pay for the activity and a premium to the shareholders; therefore, engaging in M&A activity becomes a motivation. The effects of Synergistic activities are comprehended when the combined efforts of the two organizations involved produces a greater effect than the summation of efforts of the organizations functioning autonomously as reported by Gjirja (2003). M&A deals are often justified based on the anticipated synergy which should have a positive effect on the post M&A performance of the company.
In this study, we first analyze and identify the types of acquisition, and subsequently the effect of each acquisition on post-M&A; profitability, efficiency and liquidity or Leverage. Testable hypotheses regarding the association between the type of M&A and its effect on post-M&A performances are analyzed and tested.
To further illustrate the analysis that synergy movite may allow the combined company to have a positive net present value, we present the equation as reported by Fotios et al,. (2005). NPV = Vma – [Vm + Va] – P – E = [Vma - (Vm + Va)] – (P+E) (1)
Where;
NPV= Net Present Value (Rt/ (1+i)t ) where; R=net cash flow, t= time, i= discount rate. Vma = The combined value of the two company
13
Va = the market value of the shares of firm “A” P = premium paid for “A”
E = Transaction costs
Economies of scale
Economies of scale represent an additional source of synergy. It reduces the cost per unit resulting from increased production, realized through operational efficiencies. Economies of scale can be achieved in cases where there is high relationship between the target firm and acquirer firm. The relation can be found by analyzing whether the two companies involved in the M&A belong to the same industry. It also gives big companies access to a larger market by allowing them to operate with greater geographical reach. For the more traditional (small to medium) companies, however, size does have its limits.
To carry out the analyses, we examined their primary core business area and sector as stated in the portfolio or expertise. The examination is achieved by the information available at the company‟s financial statements and the information recorded from the interview in the various companies. We created a list of business sectors in which the studied companies operate (such as Auditing, consultancy, technology, chemical, Pharmaceutical, services) and placed the companies and their business areas in their respective sectors. Then we sorted through all the M&A that has taken place in the firm and placed the target firm in their respective sectors also. See Table i, ii and iii.
Economies of Scope
Economies of scope can be achieved by increasing the number of different products being produced which will result to the decrease of the average total cost of production. This will occur in a situation where it is cheaper to produce a wider range of products rather than specialize in just a handful of products. In essence, the expansion of the product range will help to exploit the value of existing brands and it is good way of exploiting economies of scope. Furthermore, the economies of Scope motivate M&A in the several business sectors because it becomes possible for the companies involved in M&A to cross sell the products and services from the merged or acquired company. Economies of scope can be achieved by selling the added range of products and services through the combined network of the company. This will result in the increases of the number of products and services made available for the customers of the company. However, as by reported Heffernan (2005), this does not yield increase to the related cost of production or the cost of Research & Development, which most of the companies would have incurred, if they had not engaged in M&A.
14
Financial synergy
The major source of financial synergy is achieved by lowering the cost of capital. This can be possible by acquiring a target firm with high levels of cash. In this case, the acquiring firm may use the targets firm cash as financial resources instead of obtaining the funds in the financial markets. The action of avoiding the financial markets may be a less expensive way to obtain financial resources. We therefore examine the targets firm‟s levels of cash. The financial synergy theory also states that when the cash flow rate of the acquirer is greater than that of the acquired firm, capital is relocated to the acquired firm and its investment opportunities improve. An additional method to detect financial synergy is by examining financial slack. The financial slack can be examined by looking at the difference between the acquirer and targets financial leverage. Financial slack is then calculated both as the arithmetic and absolute difference between the acquirer and the targets financial leverages. A combination of companies with different cash flow positions and investment opportunities may produce a financial synergy effect and achieve lower cost of capital; therefore the operating margin of the combined companies will however be greater than the revenue-weighted operating margin of the individual firms
Tax savings
Tax saving is another considerations. When the two firms merge, their combined debt capacity may be greater than the sum of their individual capacities before the merger. In this case, If one of the firms has tax deductions that it cannot use because it is losing money, while the other firm has income on which it pays significant taxes, the combining of the two firms can lead to tax benefits that can be shared by the two firms. The value of this synergy is the present value of the tax savings that accrue because of the merger. Therefore to be able to deduce the synergy (tax saving) behind the merger, we employed the formulae below to calculate if there is evidence of tax benefit;
Financial Synergy Tax Benefits = Value of Target Firm + Present Value of Tax Benefits
Diversification
It is a corporate action in which a company purchases a controlling interest in another company in order to expand its product and service offerings. One way to determine if a takeover is a diversification acquisition is if the two companies have different Standard Industrial Classification (SIC) codes, meaning that they conduct different types of business activities. Conglomerates are often involved in diversified acquisitions either to minimize the potential risks of one business component/industry not performing well in the future or to maximize on the synergies and revenue streams of a diverse operations, as reported by Amihud and Lev, (1981) and Morck, Shleifer, and Vishny, (1990). Diversification refers to a strategic direction that takes companies into other products and/or markets by means of either internal or external development. Related diversification, occurs when a company develops
15
beyond its present product and market whilst remaining in the same area. This form of diversification can further be broken down:
Backward diversification, when activities related to the inputs in the business are developed. Forward diversification, refers to development into activities which are concerned with a company‟s output. Horizontal diversification, occurs when a company develops interests complementary to its current activities. For a company may integrate its activities to include all aspect of the value chain; design, manufacture, market and distribute. Morck et al,. (1990). In order to test the effectiveness of acquisition as an alternative strategy the following five simple rules may be used as reported by Drucker (1993):
(i) The acquiring company must consider what value it can add to the acquired business and such value will include management, technology and distribution (ii) A common core of unity must exist between the businesses in terms of markets,
products and technology etc
(iii) The acquiring company‟s management must understand the business being acquired
(iv) The acquiring company must put a quality management team quickly into the acquired business
(v) The acquiring business must retain the best management from both businesses.
Reasons for diversification
Efficiency gains, where an organization has underutilized resources and competences that it cannot effectively close or sell then it make business sense to use the resources and competences by diversifying into a new activity. Increasing market power, an organization can afford to cross-subsidize one business from the surpluses earned by another in a way that competitors may not be able to thereby stretching corporate parenting capabilities into markets and products, responding to market decline and Spreading risk as reported by Drucker (1993) and Scribd Inc (2011). The variables used to identify diversifying acquisitions are the same as those used to identify the company‟s relatedness. We examine whether the acquirer and target belong to the same industry/sector or business categories, and we examine the correlation between the company‟s returns. We were able to achieve result by creating a list of business categories/industries/sectors (such as energy. Technology, chemical, Pharmaceutical) and placed the companies and their business areas in their respective sectors. Then we sorted through all the M&A that has taken place in the firm and placed the target firm in their respective categories/industries and sectors.
16
H 2: Analyzing the post- M&A performance of the companies
The company‟s post-M&A analysis basically involve the analysis of the financial statements of the case study companies; the financial statement, the balance sheet and the cash flow statement. We analyzed the financial statement using ratios since the main aim of the analysis is to determine the post- M&A performance of the companies. However, we are interested in the following categories of ratios such as; profitability ratios, efficiency ratio and liquidity ratios. Since, ratios by themselves are meaningless unless compare to a benchmark, therefore we adopted the time series comparison which involves comparing current ration with past ratio. The deviations from trend should examined in line with policy changes to determine whether the change is unintentional or intentional
Measuring the Post M&A Performance
Calculating for Profitability:
These ratios are used to determine the profitability or otherwise in the company. This shows how earnings of the firms are growing after M&A. For example, a decline in return on equity (ROE) is evident that the company‟s investments have offered a low ROE than its previous investments.
(i) Return on Equity (ROE) = Earnings before tax & Interests (EBIT) / Net Asset Where Net asset = fixed asset – working capital (current asset –current liabilities) (ii) Return on Capital Employed (ROCE) = EBIT/Capital Employed
A measure of the returns that a company is realizing from its capital, calculated as profit before interest and tax divided by the difference between total assets and current liabilities. The resulting ratio represents the efficiency with which capital is being utilized to generate revenue
Calculating for Company‟s Efficiency
This ratio shows how management is efficiently and effectively utilizing the assets (resources) of the firm. For example, the fixed asset ratio measures sales per Krona of the firm‟s money that is tied up in fixed assets. The ratios that are typically used to analyze how well a company uses its assets and liabilities internally, efficiency ratios is used to calculate the turnover of receivables, the repayment of liabilities, the quantity and usage of equity and the general use of inventory and machinery.
(i) Fixed asset turnover ratio = Sales / fixed asset (ii) Capital turnover ratio = turnover / net asset
17
Calculating for the Company‟s Liquidity or Leverage
These ratios measure the financial strength of the company. It measures the company‟s ability to meet its current obligations. The leverage ratios on the other hand are used to measure the long term financial position of the company. In a way, these ratios indicate the riskiness of the company with respect to bankruptcy
(i) Current Ratio = current asset / current liabilities
18
4. Results
The results analyzes the rationales for the M&A; (synergy, Economies of scale, Economies of Scope, Financial synergy, Tax savings and Diversification) and the post-M&A performances (profitability, efficiency and liquidity) in the following companies; PayEx (non-listed), Cybercom (listed), Grant Thornton (non-listed) and AstraZeneca (listed). The M&A activities in these companies covers a period of five years. The major data and statistics were drawn from the financial statements and subsequently from the interviews conducted in the companies. As reported in Table 7-12, the M&A activities can be seen in each company and for each company the total number of acquisition, date, volume, business area, product line, deal value and market share are presented for the following years and also presented is the company‟s group financial statement.
There are remarkable observations in each of the company. The rationale associated or identified to the M&A in one company may be different in most cases compared the other companies and in different year period. Also observation and analyses were also made comparing the position of the company before and after merger to analyze the findings if there were evidence of post-M&A performances in terms of profitability, efficiency and liquidity in the studied companies. We made comparism for each of the company, using findings from past financial and operational state of the companies and further substantiate if there is any remarkable improvement (profitability, efficiency liquidity) after merger in the subsequent years. However, it is good to note that most of these companies have consistently every year been involved in one merger or the other. Therefore, we analyzed their Post-M&A performance based on the performance each year as another merger occurs the following year.
4.1. Non –Listed Companies
Non – listed company can be a public company though unlisted but can have unlimited shareholders to raise capital for profitable purposes or for any commercial venture although, it cannot not advertise for investors. An unlisted public company is generally a small company not suitable for listing on the Stock Exchange. The non-listed company‟s means of financing options are limited compared to listed firms which can approach equity markets for outside financing. Non-listed firms are faced with different trade-offs and agency costs compared to listed firms. One of the most important agency costs due to the separation of ownership and control is the distorted incentive of managers to invest in projects that reduce firm value. Thus where ownership and control is separated, one concern is to reduce the level of “free cash flow” available to management thus curbing their ability to take on value destroying investments.
19
4. 1.1. PayEx
PayEx is a non-listed payments solution company located in Gotland Sweden and some operations within the Nordic countries. It was established in 1972, their line of services includes payment services for internet and mobile trade, rating/billing, invoice and ledger management, collections, direct banking and credit management. PayEx offers a complete framework for managing consumer financing over the internet and in a physical store. This service makes it possible for PayEx‟s merchants to offer their customers payment plans and credit accounts. PayEx core operations are all about payments. The major component of their business are well connected to payments and payment processes. Their mission is to grow focusing on the Nordic market and to have a full payments solution, also to look for solutions, execute, and deliver them through customer focus, expertise and entrepreneurship. PayEx main competitors are their clients. The clients will have to choose if they want to have their own solution or to prefer undertakings from PayEx. Another notable competitor is Nets, also a payment solution company located in Norway. Most of their operation is through out-sourcing in the invoice market (20%), debit and credit (5%) card market. Due to PayEx expertise, clients prefer thrusting their online payment activity or services instead of undertaking the risks themselves.
4.1.2. Grant Thornton
Grant Thornton is an auditing and consultancy company. They provide services in audit, tax, financial services, corporate finance, advanced accounting issues and advice to support businesses and entrepreneurs and to develop customer needs. Grant Thornton is an independent member firm of Grant Thornton International. It was founded by Börje Lindeberg in 1950 that is the head of Lindsey‟s intressenter. Grant Thornton Sweden AB is the fifth largest assurance firm in Sweden with more than 125 Swedish partners. Grant Thornton also acts as independent auditors, advising on transfer pricing, or assisting with payroll administration.
4.1.3. Analysing The Hypothesis for M&A Rationales in Non –Listed Companies Most of the information for analyzing PayEx main motive for M&A is deduced from the interview we gathered from the CEO (Krister Fingal). As a non-listed company, the use of the stock market value reaction as at time of announcement of merger was not possible so we relied mainly on the information we got from the interview. PayEx main motive to acquire other company is a means of entering into a new market and to get a foot print in the market either locally, regionally and internationally. As reported in Appendix A, which describes the various M&A which has taken place in PayEx in the past 3 years (2007-2009), we discovered that most of the acquisitions were also made in the market regionally such as in Finland (Oy Soumen) and (POS System AS) in Norway. Another motive we could also establish is that the M&A enables PayEx diversify product range and inject new energy to break barriers to entry thereby, increasing PayEx customer base which result in the increase in sale as reported in the figure 1. This we can establish because PayEx was originally into payment services but as we
20
can see from the acquisition of NetOnNet in 2007, which help PayEx to enter into the financial solution market to service new business. Evidence of synergy is observed. PayEx buy a fraction of the target company and integrate it into PayEx by this they add new services to gain competitive advantage. In some cases, after a period of 1 – 2 years they may sell the acquired firm if the integration fails. It is also observed that in most cases the acquired firms is sold, reason being that PayEx does not encourage diversification from their core business area and expertise. In the case of Economies of Scope and Economies of scale, there is little or no substantial evidence pointing to the fact that PayEx may have such motive, however, it can be drawn that there is evidence of the former (Economies of Scope) although PayEx is a non listed company but its presence is well establish in the regional market such as in Finland, Norway, Sweden, Denmark and Poland. However, from the interview, we observed that the shareholders are in support of the M&A strategy but they are expecting a long-term return on investment, usually in 3-5 years period.
Table 4.2 Statistics showing key ratios; EBIT,Net income, Fixed asset, Net asset, Equity ratio (%),Capital Employed, Total Current Liabilities for the non-listed companies (PayEx and Grant
Thornton), for the following years as stated.
Financial Overview For The Non - Listed Companies
PayEx Grant Thornton
tkr 2007 2008 2009 2006 2007 2008 2009 2010
Turnover 555 418 583 044 606 928 590 827 684 675 819 032 864 731 878 940
Operating profit (EBIT) 270 10 633 38 213 74 483 88 409 102 390 95 277 165 045
Operating profit before a..
29 384 47 120 83 904 88 476 102 120 120 499 113 222
185 283
Results e. fine. diet 15 898 25 135 44 540 75 974 90 544 105 275 97 980 166 206
Net income – 1 398 15 127 26 816 52 959 63 898 73 152 71 007 119 399
Fixed asset 234 254 224 478 249 950 29 111 37 684 39 259 59 646 54 529
Net asset 317 691 304 784 321 363 - 93 883 - 101 458 -126 386 -101 756 -175 372
Current asset 838 317 861 547 1 044 832 245 642 289 591 331 739 315 386 392 956
Total assets 1 072 571 1 086 025 1 294 782 274 753 327 275 370 998 375 032 447 485
Long term liabilities 0 0 0 0 0 0 0 0
Net margin (%) 2,86 4,31 7,34 12,86 13,22 12,85 11,33 18,91 Liquidity ratio (%) 103, 35 92, 17 92, 74 226,37 214,13 219 237,29 271,66 Equity ratio (%) 12, 17 11, 08 11, 7 43,63 42,99 42,72 45,88 52,57 Number of employees (units) 497 504 489 580 648 773 808 771
Total Current Liabilities 921 754 941853 1 116 245 122 648 150 449 166 094 153 984 163 055
21
4.1.4. Analysing The Hypothesis for Post-M&A Performance in Non-Listed Companies
Financing M&A activities in non-listed companies are done through the company‟s reserves or shareholders investments as reported by Krister Fingal (CEO PayEx) in the interview. Return on equity (ROE) and the Return on capital employed (ROCE) as a measure of profitability has been increasing at a steady rate as a result of major M&A activities from the period 2007 – 2009. Due to the recurring M&A activities in PayEx subsequent years, looking at the figures in Table 4.2, it can be said that PayEx is seeing a steady increase in ROE and ROCE as it rose from 0.9% to 11.9% and from 0.179% to 21.403% respectively in a period of three years after the merger. However, the fixed asset turnover ratio in 2007 show a low efficiency in the company compared to 2008 and 2009 and also the figures show that efficiency is higher in 2008 compared to 2009. This we found to be as a result of an upward trend in the sales from 2007 to 2009 and subsequent increase in fixed asset in 2007 and 2009 except for a minimal decrease of fixed asset in 2008. Therefore, the percentages recorded for efficiency in 2007 – 2009 indicated a high evidence of efficiency in PayEx. Therefore, the post-M&A performance in terms of profitability, efficiency and liquidity are minimal. Reasons are related to investment in new sector operations, expansions and higher cost of production. The amount spent on developing or entering into the new market reduces liquidity. Also the high cost associated with increased production affects profit. Since the markets are new, sales are relatively low but subsequently increase with time after gaining higher market share. However, profit margins were showing an upward trend, compared from 2007 – 2007. Return on equity (ROE) measures the returns that flow from equity. Looking at the figures it can be said that PayEx was seeing a steady increase in ROE as it rose from 0.09% to 11.9% in a period of three years after the merger. Liquidity ratio was also showing an upward trend due to high money in circulation to finance daily operation. Increase in sale gives to increase in profit, but the profits are not immediately given to shareholders in the form of dividends but they are rather used to finance daily operations ion the company. Shareholders agree on a return on their investment in a long term period, usually 3 – 5 years. This also reduces their risk of borrowing and debts.
22
Table 4.3 showing the information for the measurements of post-M&A performances in the listed companies (PayEx and Grant Thornton) using the following variables: ROE, ROCE,
Fixed Asset Turnover ratio, Capital Turnover ratio, Current ratio and Gearing ratio
NON - LISTED COMPANIES
Case Company PayEx Grant Thornton
Indicators in years 2007 2008 2009 2006 2007 2008 2009 2010
Return On Equity ratio % 0.09 3.49 11.89 -79.34 -87.14 -81.01 -93.63 -94.11
Return On Capital Employed % 0.18 7.38 21.40 48.97 49.99 49,97 43,10 58,03
Fixed Asset Turnover ratio % 237.10 259.73 242.82 2029.57 1816.89 2086.23 1449.77 1611.88
Capital Turnover ratio % 174.83 191.30 188.86 -629.32 -674.84 -648.04 -849.81 -501.19
Current ratio % 90.95 91.47 93.60 200.28 192.48 199.73 204.82 241.00
Figure 1: Showing the post-M&A performance for the non-listed companies, the following variables were considered for both companies; ROE, ROCE, FAT, CTR, and CR. The indicators (ROE and Capital Turnover) for Grant Thornton with negative ratios are represented on the 0%
23
4.2. Listed Companies
A company is said to be listed, quoted or have a listing only if its shares can be traded on a stock exchange, in the other hand it is the securities that are listed, not the company. The phrase listed company is widely used to mean a company that has listed ordinary shares. It is possible although not common for a company to have listed debt securities but not listed shares. Listing in more than one market is possible through secondary listings, or through the more complex approach of dual listing. A group of companies may also have separately listed subsidiaries, associates, and tracking stocks. Listed companies are able to raise funds and capital through the sale of its securities. This is the reason why public corporations are so important, prior to their existence; it may have been very difficult to obtain large amounts of capital for private enterprises. In addition to being able to easily raise capital, public companies may issue their securities as compensation for those that provide services to the company, such as their directors, officers, and employees.
4.2.1. Cybercom Group (listed)
Cybercom engages in consulting in the following information technology areas: systems development, training, programming, data analysis, operations analysis, advice on IT procurement, systems analysis, review of computer systems, sales of IT related products, systems engineering, database design, database administration, management consulting, executive and specialist recruitment, securities trading and related business.
4.2.2. AstraZeneca Astra AB
Founded in 1913 and headquartered in Sodertalje, Sweden, Astra was an international pharmaceutical group engaged in the research, development, manufacture and marketing of pharmaceutical products, primarily for four main product groups: gastrointestinal, cardiovascular, respiratory and pain control. Key products at merger includes; Gastrointestinal: Losec (omeprazole), Cardiovascular; Seloken (metoprolol), Plendil (felodipine), Ramace (ramipril), Atacand (candesartan cilexetil), Respiratory; Pulmicort (budesonide), Bricanyl (terbutaline), Rhinocort (budesonide) and Turbuhaler (inhalation flow-driven device) and Anaesthesia; Xylocaine (lidocaine).
Zeneca
On 1 June 1993, Imperial Chemical Industries (ICI, founded in 1926) demerged three of its businesses (Pharmaceuticals, Agrochemicals and Specialties) to form a separate company, Zeneca. Headquartered in London, Zeneca was a major international bioscience group engaged in the research, development, manufacture and marketing of pharmaceuticals
24
4.2.3. Analysing the Hypothesis (H1) for M&A Rationales in Listed Companies There is some evidence pointing to different motives for M&A activities in Cybercom as reported in Appendix C. From the interview with the Kristina Cato (Corporate representative), we found evidence of diversification motive in 2005 when the company acquired Netcom Consultants (Telecom management outfit) to gain presence in Singapore but was later sold. Also Economy of scale and scope is another main found motive to the various M&A deals that Cybercom have been engaged. This is because they tend to improve on sales and profit margin by increasing production and reducing cost per unit. Another recognizable motive in Cybercom as documented in the interview was that the founder wanted to expand its operations. In 1999, Cybercom became a listed company, floating shares in the Swedish stock exchange to the public in other to increase capital base. The stock market reaction to the acquisition announcement reflects the market estimates of future effect on the value of the acquirer and target firms. Thus, when a synergy motivated acquisition is announced, the stock market is expected to react positively to the announcement of the acquisition. In 2207, the merger between Varchar AB, which was a small acquisition, did not integrate well and there was no reaction of market upon announcement of the acquisition. In 2008, the acquisition of Plenware Oy a Finnish company though a good company but because of the financial crises at the time there was not much reaction recorded and major deals and work needed to be put in place as reported by Kristina Cato. In AstraZeneca, as reported in the Table iii there is a strong indication that the major motive for acquisition is to diversify its operations and products and to pursue entry into new markets. AstraZeneca reported a total of eleven acquisitions from 2006 – 2010. In 2007 they were involved in 6 different acquisitions but they diversified their operation in two of the acquisitions. Also in 2006, three acquisitions were made and they were all diversified acquisition. However, there were other motives as synergy gain in terms of market shares, financial synergy, economy of scale and economy of scope. The change in sale can be seen in figure 3. Because of the major diversification in AstraZeneca the company is yet to reap full advantage in the form of high sales. However, sales are expected to increase in the long run as operation is successfully integrated.
Key products at merger
1. Oncology - Zoladex (goserelin acetate), Casodex (bicalutamide), Nolvadex (tamoxifen citrate), Arimidex (anastrozole)
2. Cardiovascular - Zestril (lisinopril dihydrate), Tenormin (atenolol) 3. Respiratory - Accolate (zafirlukast)
4. Central nervous system - Zomig (zolmitriptan)
5. Anaesthesia - Diprivan (propofol), the world's largest selling injectable general anaesthetic