Institutionen för kultur, energi och miljö
Avdelningen för biologi
Högskolan på Gotland, SE-621 67 Visby
www.hgo.se
A
P
LANT-
P
OLLINATOR
N
ETWORK
ON
F
ÅRÖ ISLAND
D
ESCRIPTION,
C
OMPARISON AND
G
ENERAL
P
ATTERNS
Anna ”Sixten” Johansson
Examensarbete i biologi 30 högskolepoäng, 2012
Handledare: Jette Knudsen och Bertil Ståhl
Bilden på framsidan föreställer det studerade pollinationsnätverket på Fårö
sorterat i moduler. Punkter symboliserar arter och streck länkarna mellan
dem. Punkter med samma färg tillhör samma modul. Den eller de mest
centrala arterna i respektive modul benämns med latinska namn.
Denna uppsats är författarens egendom och får inte användas för publicering utan författarens eller dennes rättsinnehavares tillstånd. Anna ”Sixten” Johansson
1
C
ONTENTS
ABSTRACT ... 2
INTRODUCTION ... 3
Pollination ... 3
The evolution of insect-pollination ... 3
General network patterns and their implications ... 4
Aims of study ... 5 METHODS ... 5 Study area ... 5 Fieldwork ... 6 Analyses ... 6 RESULTS ... 8
The Skalasand network ... 8
Comparison of Skalasand and Gotska Sandön networks ... 10
General patterns in the combined networks ... 11
DISCUSSION ... 13
The Skalasand network ... 13
Comparison of Skalasand and Gotska Sandön networks ... 15
General patterns in the combined networks ... 16
ACKNOWLEDGEMENTS ... 17
REFERENCES ... 17
SAMMANFATTNING ... 20
2
A
BSTRACT
The overall aim of this study was to deepen the knowledge of multi-habitat networks. A broad array of basic aspects of the studied plant-pollinator network at Skalasand on the island of Fårö, Gotland was covered and compared with a similar study at the island of Gotska Sandön. The species composition differs considerably between the two networks. The Skalasand network has a richer fauna of insects belonging to the groups Syrphidae and Apiformes, while Muscidae-flies constitute a considerable part of the Gotska Sandön network. However, the networks also have resembling modules. The modules are always established around one or a few plant species acting as hubs while animals visiting several habitats work as connectors linking the different modules. The Syrphidae and Apiformes are the two taxonomic groups that are the most generalistic when it comes to interacting in different habitats.
3
I
NTRODUCTION
Pollination
Pollination is the transport of pollen grains from the anther to the stigma and from the perspective of the plant, preferably from one individual of the same species to another, hopefully resulting in reproductive success in form of seeds and fit offsprings (Proctor and Yeo 1973, Willmer 2011). The transfer of pollen can be managed by abiotic factors such as wind and water, but nearly 75% of all angiosperms are dependent on animals for their pollen transport (National Research Council 2007). At higher latitudes pollinating animals are usually insects, this being the case in the whole of Europe. Elsewhere, and especially in the tropics, birds, bats and lizards among others also function as pollen vectors (Willmer 2011). In this study, “pollination” henceforth refers to pollination by insects.
The evolution of insect-pollination
Angiosperms diversified at a seemingly high rate during the early Cretaceous and became a dominant group of plants about 100 million years ago. Insects are believed to have become the most important means of pollination for angiosperms during the late Cretaceous, 100-65 million years ago (Pellmyr 1992, Proctor and Yeo 1973, Willmer 2011). At first the insects are believed to have been herbivores rather than pollinators, feeding on the protein-rich pollen/microspores. To maintain this relationship and still save the precious resource of pollen, carbon-based nectar was developed as an energy-rich substitute much “cheaper” for the plant to produce. The selective pressure on flower foods changed at the end of Cretaceous when bees evolved, because bees depend on pollen as food for their larvae. Plants that
adapted to bee pollination thus have to produce sufficient pollen both for pollination purposes and to provide food for bee larvae (Willmer 2011).
The advantages of biotic pollination are many. Plants do not have to produce as much pollen as if pollen was dispersed by the wind. Many pollinators form search images of plants and thus reduce waste of pollen and increase cross-fertilisation rates. This behaviour enables scattered plant populations because many pollinators can move long distances. In addition, visits to one species of plant at a time improve the handling of flowers and make food gathering more efficient (Willmer 2011).
Symmetrical, bowl-shaped flowers were probably most common in early angiosperms because they provided shelter, and were easy to land on and eat from. According to one theory the radiation in angiosperms was caused by innovations within the plants themselves and to a lesser extent affected by genetic exchange provided by pollinators. But another theory claims the fast speciation of both angiosperms and their visiting insects wasdue to their mutualistic bonds. Whatever was the cause of the radiation of angiosperms, recent studies show patterns that more diverse pollinator communities lead to higher diversity in plants (Willmer 2011). As long as one pollinator is not more beneficial for a plant than the others, there is no initiative for the plant to favour traits attracting the insect, but if a plant experience a fitness gain, the plant should, in theory, specialise on it (Muchhala et al. 2008 and references therein). Scents, vivid colours and flower shapes in different combinations are means for plants to attract particular visitors (Willmer 2011) and a separation of niches
lessens the competition among species and makes it possible for more species to coexist in the same area (Townsend et al. 2008).
4
General network patterns and their implications
Earlier research shows that pollination networks are basically structured in the same way in a variety of biotopes and climates and have several general patterns in common (Olesen et al. 2007, Bascompte and Jordano 2007).
Pollination networks can be described as constructed of nodes and links. The nodes are all species involved, both plants and animals, and the links are the interactions when species meet. For obvious reasons a link in a pollination network cannot appear between two animals or two plants (Olesen et al. 2010). Generally, subsets of species, called modules, are more tightly linked to each other than to the rest of the network. In a network with strong modularity disturbances in one of the modules will not spread to the rest of the network as easily as in networks with weaker modularity because the disturbance often stays in the module (Olesen et al. 2007).
Nodes, i.e. the different species, have specific roles relative to modules. The peripheral species form the bulk of the network. They only interact with one or a few species within its own module. A total 85% of all interacting species are usually found here. The disappearance of a specialized peripheral species will have little effect on the survival of the rest of the species in the network (Dupont and Olesen 2009, Olesen et al. 2007). Module-hubs are species interacting with many other species and they are central to keep the modules together because the majority of their links are within their own modules. If a module-hub disappears the module will break apart and some specialist species will have a hard time surviving. The connectors are species that link different modules together. If a connector species disappears the effect in the different modules will not be great but modules may become isolated from each other. The network-hubs are the most central species in the network and have the highest linkage level, i.e. most connections. They are generalists and important to many other species. Consequently, the role of a species tells us how important it is for the network as a whole and helps us prioritise when it comes to conservation of biodiversity (Olesen et al. 2007).
Nestedness, a general pattern found in pollination networks, means that generalist species often interact with specialists. This goes both ways, i.e. specialised pollinators tend to visit generalistic plant species and specialised plant species get most of their visits from
generalistic pollinators. The generalistic species are often abundant and their abundance does not fluctuate much over time. A nested structure brings stability and persistence to the system even if some of the species involved disappear (Bascompte and Jordano 2007, Mitchell et al. 2009). For conservation purposes a nested pattern implies focus on generalised and common species as a means to help preserve unusual, specialised species.
The concept of pollination syndromes is a much-discussed phenomenon amongst researchers. Some argue that many unrelated plant species share similar floral traits and consequently pollinators and these mutualisms reappear in nature more often than they should by chance (Johnson and Steiner 2000, Mitchell et al. 2009). Coevolution with their visitors is considered to have caused these groups of plant species to converge and develop similar traits (Olesen et al. 2007). Others claim that since very wide ranges of pollinator species often visits flowers, the coevolutionary process from certain insects cannot have been so profound as to be the selective force behind pollination syndromes (Mitchell et al. 2009). But if only a small proportion of the visitors are actually effective pollinators they can direct the coevolution, thus causing pollination syndromes (Johnson and Steiner 2000).
5
Aims of study
The overall aims of this project were to: 1) study the structure of a plant-pollinator network at a coastal area of mixed habitats at Skalasand on the north-eastern part of the island of Fårö, Gotland, 2) to compare the results with a similar study carried out in similar types of habitats at Gotska Sandön island the previous year, and 3) to search for general patterns with the networks combined. The study covered a broad array of basic aspects of pollination biology and community ecology focusing on the structure of modules, the species roles, habitat generalists, and taxonomic groupings.
M
ETHODS
Study area
The study area was located at the north-eastern part of Fårö island, north of Gotland, Sweden (N 57° 57' 442'', E 19° 19' 390'' figure 1). Most of Fårö consists of limestone except for the north-eastern part, which is covered by the same postglacial sandbank as Gotska Sandön, situated 40 km north of Fårö. At this part of the island the living conditions are therefore similar to those on Gotska Sandön and for comparative reasons the study plots were chosen to resemble those used by Wallin (2011) for his pollination network study at Gotska Sandön (see Wallin 2011, for further information). However, in contrast to the more isolated Gotska Sandön, the study site was expected to be influenced by a broader fauna potentially arriving from the nearby limestone areas where different plants and animals dominate. Data for the present study was collected in three different habitats, viz. a dune area, a pine forest and a meadow. The plots furthest apart were located at a distance of 0,6 km, which should be a range most insects can manage to fly.
Figure 1. Map of the north-eastern part of Fårö with the six study plots marked as red rectangles.
The dune habitat was most affected by wind and the grass Ammophila arenaria dominated there. The forest was dominated by pine (Pinus sylvestris) and was located on old overgrown dunes. Mosses and shrubs of Ericaceae covered the forest floor. The microclimate was cool and less windy than that of the dune habitat. The meadow was blooming plentiful in early summer. Buttercups (Ranunculus bulbosus and R. acris) and greater yellow-rattle (Rhinanthus
6
serotinus) were abundant. The meadow was harvested in midseason, which ruled out continued collecting in that habitat.
Fieldwork
The data was collected on eight occasions. In total, flower visitation was observed during 44 hours between June 3 and September 3, 2011. Each of the three habitats (dune, forest and meadow) was represented by two 500 m²-sized plots (six plots in total). In each plot all flowering plants were identified to species (Mossberg et al. 1992) and randomly selected individuals were then observed during 30 minutes between 9:30 and 16:30. Pollinating insects visiting the flowers during that period were collected for later identification. However,
bumblebees (Bombus spp.) and butterflies (Lepidoptera spp.) were identified to species or morpho-species in the field (Chinery and Coulianos 1988, Cederberg 2009a, b). An insect visit to a flower was classified as pollination if the insect touched either anthers or stigma. Collected insects were identified using Douwes et al. (1997) and Bartsch (2009a, b). The identifications were later verified by specialists (see acknowledgments). A list of the species recorded in the study is presented in the Appendix.
Analyses
A total of seven network combinations were analysed; three one-habitat networks (dune, forest, and meadow), three combined two-habitat networks (dune-forest, forest-meadow, and meadow-dune) and the total network with all three habitats combined. Some basic measures were calculated (see Table 1). I then used the method of functional cartography by simulated annealing (SA) to test for modularity and species composition of the modules in the different networks (Guimerá and Amaral 2005a, Olesen et al. 2007). SA maximises the modularity of the tested network and compares it to randomly assembled networks with the same number of nodes. To analyse the one-habitat networks I used iteration factor 1, cooling factor 0,999, final temperature 0 and 100 randomisations, the two-habitat networks iteration factor 1 cooling factor 0,995, final temperature 0 and 75 randomisations and the three-habitat network iteration factor 1, cooling factor 0,99, final temperature 0 and 50 randomisations (for further information, see Guimerá and Amaral 2005a and references therein). The differences in iteration factors, cooling factors and randomisations were dependent on how large the data-set was and were adapted so the results would be solid but the computer-processing would not take too much time. Modularity (M) is a measure of how much the nodes are organised in modules. The higher M-value, the more tightly linked the modules are while low M-values are seen in networks with many links between the modules. In a network of randomly placed nodes the modularity index is M=0 (Guimerá and Amaral 2005a, Olesen et al. 2007). A network is considered modular if the modularity index (M) is significantly higher than that of the random networks (Olesen et al. 2007). Only qualitative data, i.e. presence-absence of links, were used since no method that incorporates interaction strength is yet developed (Dupont and Olesen 2009).
The grouping of species into different roles is based on two values, represented by c and z. The among-module connectivity (c) is a measure, from 0 to 1, of how well distributed node links are among different modules. A node with low c-value has most of its links within its module, while a high value signifies a uniform distribution. Nodes with a c-value higher than 0,62 are referred to, depending on their z-value, as either connector- or network-hub-species. Lower values signify module-hubs and periphery-species. The within-module degree (z) describes how well-connected the nodes are to other nodes within their own modules. Species with a z-value larger than 2,5 are considered hubs in either the module or in the whole
7
information, see Guimerá and Amaral 2005a, b, and Olesen et al. 2007). The species roles are later on referred to as 1- peripherals (c < 0,62, z < 2,5), 2-connectors (c > 0,62, z < 2,5), 3- module-hubs (c < 0,62, z > 2,5) and 4- network-hubs (c > 0,62, z > 2,5), respectively.
When the insects were identified to species I realised that the proportions of species belonging to different taxonomic groups differed considerably compared to those of the Gotska Sandön network. As a way of easily comparing the proportions in the networks, the species were divided into the six different taxonomic groups previously used by Wallin 2011: plants, Apiformes (bees and bumblebees), Coleoptera (beetles), Syrphidae (hoverflies),
Syrphidae Diptera (other flies, hoverflies excluded) and others. Lepidoptera species and non-Apiformes-Hymenoptera species were placed in the “others” category together with other infrequent insects such as Thysanoptera.
Numbers of species present in more than one of the habitats were recalculated to percentages for comparative reasons.
As a way to see if the modules of the Skalasand and Gotska Sandön networks resembled each other, the species compositions of the different modules were compared. This was done subjectively and similarities found were not tested statistically so the result is to be interpreted with caution. Three of the modules seemed to reappear in both networks with roughly the same number of species. A χ²-test (r*c) (Fowler et al. 1998) was used to test if the number of species in the three modules was constant.
Comparisons of species present in both Skalasand and Gotska Sandön networks (n=35 species) were made to see general patterns and not to, in detail, compare the species. Spearman Rank Correlation Coefficient (Fowler et al. 1998) was used to see if the species linkage levels (the node´s number of links), habitat generalisation levels (in how many of the habitats the species was found), and the species roles in the two networks were correlated i.e. if the species interacted in the same way in both networks. The critical values at n: 30 were used because no values at n: 35 were found.
To discover more general patterns the results from both the Skalasand and the Gotska Sandön studies were combined. This was done to get as large a dataset as possible and thereby
increasing the reliability of the results. Data on the species present in both studies were not combined but treated as independent species in the following analyses, resulting in a total of 323 “species” used in these analyses, of which 248 were animals and 75 plants. Animals and plants were analysed separately because of their differences in living conditions. Animals are not as dependent on the conditions of their environment being perfect because they can move if the conditions change. Plants on the other hand are more rarely able to live in very
dissimilar habitats. Spearman Rank Correlation Coefficient (Fowler et al. 1998) was used to analyse correlations between 1) habitat generalisation levels and roles, 2) habitat
generalisation levels and 3) linkage levels and linkage levels and roles. The critical values used to compare the results were lower (n: 30) than what should have been used (n: 248 and n: 75) but since the test statistic in all cases but one were far larger than the critical values this was not a problem.
When all species were plotted in a diagram according to their c- and z-values, plants and animals seemed to differ in the roles they had and consequently how they function in the networks. To compare the c- and z-values values of plants with those of animals, t-tests were performed on the c- and z-values of all plants and animals present in the two studies,
To investigate which taxonomic groups of species are the most pronounced habitat
generalists, I used χ²-test (r*c) (Fowler et al. 1998) to see if there was a relationship between different taxonomic groups and habitat generalisation levels. To judge what taxonomic groups
8
were the most generalist I divided the number of generalist species with the total number of species in each taxonomic group to get a proportion.
R
ESULTS
The Skalasand network
The total number of species in all three habitats was 119, including 88 insect (A) and 31 plant species (P). They were found to interact in 224 combinations (I), which results in a
connectance (C) at 0,082 (C=I/(A*P)) i.e. 8,2 % of all theoretically possible interactions are realised (Table 1) (Kearns et al. 1998).
Three out of the seven analysed networks were significantly modular; the meadow, the forest-meadow and the total network with all three habitats. The modularity indexes were 0,57, 0,56 and 0,48, respectively (Table 1).
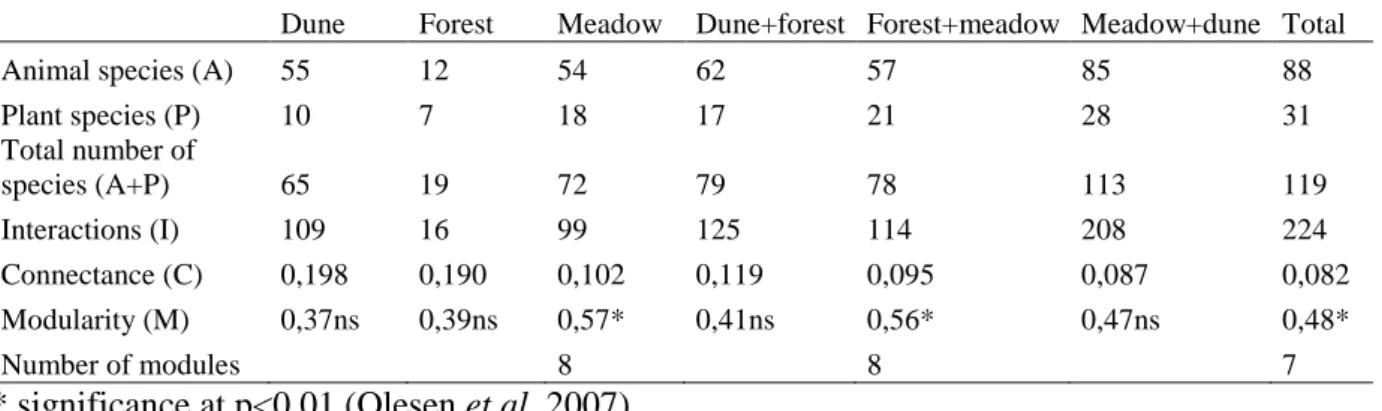
Table 1. Basic parameters of the Skalasand network.
Dune Forest Meadow Dune+forest Forest+meadow Meadow+dune Total
Animal species (A) 55 12 54 62 57 85 88
Plant species (P) 10 7 18 17 21 28 31 Total number of species (A+P) 65 19 72 79 78 113 119 Interactions (I) 109 16 99 125 114 208 224 Connectance (C) 0,198 0,190 0,102 0,119 0,095 0,087 0,082 Modularity (M) 0,37ns 0,39ns 0,57* 0,41ns 0,56* 0,47ns 0,48* Number of modules 8 8 7
* significance at p<0,01 (Olesen et al. 2007)
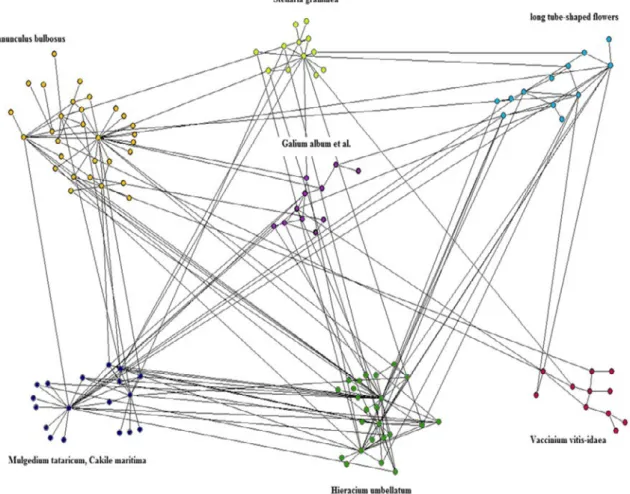
The SA algorithms found eight modules in both meadow and forest-meadow networks and seven in the total network. In the meadow, the network with the strongest modularity, the modules gather around 1) Ranunculus bulbosus, 2) Potentilla erecta, with a large proportion of its visitors being Muscidae-flies, 3) Stellaria graminea, 4) plants with long tube-shaped flowers, for example Trifolium repens, visited by bumblebees and a butterfly, 5) Vaccinium vitis-idaea and Maianthemum bifolium, 6) mainly Galium album, 7) Sorbus aucuparia, and 8) Ranunculus acris and Saxifraga granulata, among others.
9
The forest-meadow network, in which only six new species are added, is composed of the same modules as described above. However, the total network including all three habitats differs considerably from the one- and two-habitats networks. The Stellaria graminea and Sorbus aucuparia modules are merged while the module bound together by Ranunculus bulbosus is merged with those gathered around Potentilla erecta, and Ranunculus acris plus Saxifraga granulata. To the module of tubular shaped flowers, Rubus ideaus among others is added. Vaccinium vitis-idaea and Maianthemum bifolium are added with two white flowers as well as several insect species, and the Galium album module is also quite altered. When the dune is included in the network, two modules around dune plants are created: one gathered around Mulgedium tataricum and Cakile maritima but Bellis perennis from the meadow is also found here, and the other module is gathered mostly around Hieracium umbellatum, which has the highest linkage level of all species (i.e. has most interactions), but also frequently visited Epilobium angustifolium and Thymus serpyllum are part of this module (Figure 2).
Figure 2. The Skalasand network organised in modules. Species are symbolised by dots and the lines are the interactions between them. Gatherings of dots of the same colour represent modules and the most central species in each module is listed with their Latin names.
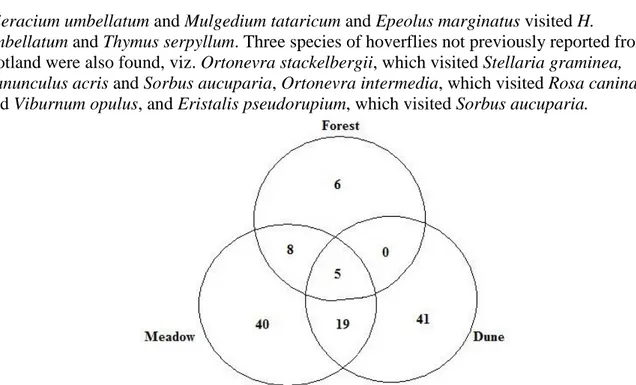
Species found in more than one habitat (dune, forest and meadow) are regarded as habitat generalists. Of the 119 species forming the Skalasand network, 32 are found in more than one habitat and of these 5 species are found in all three habitats (Figure 3).
Two of the bee species found at Skalasand, Dasypoda hirtipes and Epeolus marginatus, are classified as nearly threatened (NT) on the Swedish list of endangered species
10
Hieracium umbellatum and Mulgedium tataricum and Epeolus marginatus visited H.
umbellatum and Thymus serpyllum. Three species of hoverflies not previously reported from Gotland were also found, viz. Ortonevra stackelbergii, which visited Stellaria graminea, Ranunculus acris and Sorbus aucuparia, Ortonevra intermedia, which visited Rosa canina and Viburnum opulus, and Eristalis pseudorupium, which visited Sorbus aucuparia.
Figure 3. Number of species (animals+plants) in habitats and number of habitat generalists. Circles represent the different habitats and the numbers how many species are found there. Numbers in overlapping areas represent species present in more than one habitat i.e. habitat generalists. For example the total number of species in the forest is 6+8+5+0=19.
Comparison of Skalasand and Gotska Sandön networks
Collecting data for the Skalasand network a total of 44 hours were spent in field. This resulted in 224 observed interactions including 88 animal and 31 plant species. On Gotska Sandön 98 hours in the field resulted in 348 observed interactions including 160 animal and 44 plant species (Wallin 2011). The number of species divided into taxonomic groups is shown in Figure 4.
Figure 4. Number of species divided into taxonomic groups. In the category “others” Lepidoptera and
non-Apiformes-Hymenoptera species are placed together with other infrequent insects e.g. Thysanoptera. The total
number of species are 119 at Skalasand and 204 at Gotska Sandön. The Gotska Sandön figures are based on Wallin (2011). 0 10 20 30 40 50 60 70 80 90 100 N u m b er o f s p eci es Skalasand Gotska Sandön
11
In the Skalasand network, the percentage of habitat generalists, visiting or growing in more than one habitat is 26,9% (32 species), and 4,2% (5 species) are found in all three habitats. Corresponding figures for Gotska Sandön were 21,6 % (44 species) and 4,4 % (9 species) (Wallin 2011).
When comparing the composition of modules of the Skalasand and Gotska Sandön networks, three of the modules were roughly similar. These are the modules gathered around 1)
Ranunculus bulbosus, 2) plants with long-tubed flowers and 3) Vaccinium vitis-idaea plus Maianthemum bifolium. In both networks, the R. bulbosus-modules are being visited by a large proportion of non-Syrphidae flies. In the Skalasand network this module consists of 31 species and in the Gotska Sandön network of 33 species. The tube-shaped-flower modules have flower shape and bumblebee visitation in common. In the Skalasand network this
module is composed of 12 species, in Gotska Sandön of 11 species. The V. vitis-idaea plus M. bifolium modules share these two plant species but are enlarged by additions of other white flowers. Eleven species form this module in Skalasand and 14 on Gotska Sandön. The number of species in the three modules found in both networks does not differ significantly (χ²=0,324, df: 2, p>0,05).
The networks of Skalasand and Gotska Sandön have 35 species in common. The species’ linkage levels in the two networks are significantly correlated (rs= 0,385, p<0,05) (Figure 5A). Both habitat generalisation levels and roles are highly significantly correlated (rs= 0,601, p<0,01) (Figure 5B) and (rs= 0,505, p<0,01) (Figure 5C) respectively.
Figure 5. Linkage levels, habitat generalisation levels and roles in the Skalasand and Gotska Sandön networks. Dots represent the 35 species present in both network studies. In diagrame B and C several species, with the same values, are represented by one dot.
General patterns in the combined networks
When testing the combined networks of both Skalasand and Gotska Sandön, plants have a generally higher within-module degree (z) than animals (t-test= 9,274, p<0,05) (Fowler et al. 1998). Performing the same test on the among-module connectivity (c), plants are also
0 5 10 15 20 25 30 35 0 10 20 30 N um be r o f l ink s, G ot sk a S an d ön
Number of links, Skalasand
1 2 3 1 2 3 H ab it at ge n er al is at ion le ve l, G ot sk a S an d ön
Habitat generalisation level, Skalasand
A B 1 2 3 4 1 2 3 4 R ol es , G ot sk a S an d ön Roles, Skalasand C
12
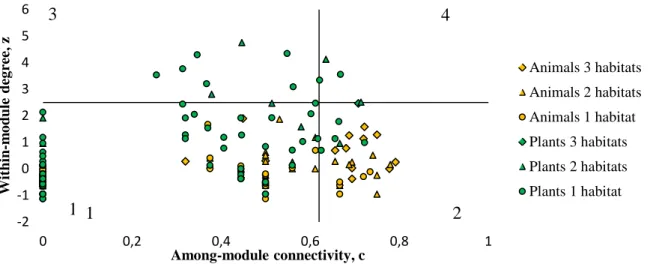
generally more connected to other modules (have higher c-values) than are animals (t-test= 4,434, p<0,05). The roles 3 “module-hub” and 4 “network-hub” are only applicable to plants (Figure 6).
For animals there are highly significant correlations between habitat generalisation levels and roles (rs= 0,759, p<0,01), habitat generalisation levels and linkage levels (rs= 0,778, p<0,01) and linkage levels and roles (rs= 0,719, p<0,01). Plants have highly significant correlations between habitat generalisation levels and roles (rs= 0,533, p<0,01) and linkage levels and roles (rs= 0,724, p<0,01), and significant correlations between habitat generalisation levels and linkage levels (rs= 0,382, p<0,05). Species which are found in several habitats tend to have more links and more central roles in the network.
Figure 6. All species in the combined Skalasand and Gotska Sandön networks marked in a cz-plot. Plants and animals have symbols in different colours and the shapes symbolise the habitat generalisation levels. The quadrants define the different roles here referred to as 1- peripheral species, 2- connector species, 3- module-hubs and 4- network-module-hubs.
A highly significant difference between different taxonomic groups and habitat generalisation levels was found (χ²=34,706, df: 10, p<0,01). The percentages of habitat generalist species in the different taxonomic groups are presented in Figure 7.
Figure 7. Percentages of species in different taxonomic groups that are habitat generalists. In the category “others” Lepidoptera and non-Apiformes-Hymenoptera species are placed together with other infrequent insects, e.g. Thysanoptera. The figures are calculated from the combined Skalasand and Gotska Sandön networks.
-2 -1 0 1 2 3 4 5 6 0 0,2 0,4 0,6 0,8 1 W it h in -m o d u le d eg ree, z Among-module connectivity, c Animals 3 habitats Animals 2 habitats Animals 1 habitat Plants 3 habitats Plants 2 habitats Plants 1 habitat 1 2 3 4 2 1 0 10 20 30 40 50 P ercen t o f s p eci es
Interacting in more than one of the habitats
13
D
ISCUSSION
The Skalasand network
When testing for modularity, only three of the seven networks are significantly modular. Some of the modules seem to be more tightly bound together. They stay quite intact when other habitats are added while other modules split apart and form new modules.
The meadow has the highest modularity value of all the significantly modular networks. When networks in other habitats are added to the meadow network, the modularity decreases as a result of decreased connectance, i.e. a larger part of the possible links are not realised. Connectance decreases when the size of the network increases (Olesen et al. 2007). Three out of the four network combinations including the dune habitat are not significantly modular (Table 1). A reason for this might be the high connectance in the dune (19,8 %). If the nodes are very tightly linked to each other, the whole dune network can be seen as one large module and the program of SA cannot detect separate modules within the tightly linked set of species (Olesen et al. 2007). Possibly this has had an effect in the combined-habitat networks with non-significant modularity as a result. In the total network the majority of dune-species (40 of 65) are found in two “dune modules”.
To communicate with pollinators plants use flower shapes, colours and, scents (Willmer 2011). Humans cannot, without chemical analysis or technical gadgets, detect the scents or true colours of the flowers. Insects also have many adaptations due to their choice of flowers to visit. For example they can be variously sensitive to different colours. Trying to determine what characters unite the modules is very much biased toward how humans perceive and interpret colours, morphology and physiology. The species composition of the modules does sometimes seem somewhat random. However, the modules of the meadow-network, in my view, show uniting traits which to some extent get blurred or disappear when more habitats and consequently more species are added.
1. Tube-shaped flower module
The linking traits appear the clearest in the meadow network where the module is composed of three plants with tube-shaped flowers, four bumblebees and one butterfly. Bumblebees and butterflies have long tongues and can therefore reach the nectar hidden at the bottom of the tube-shaped flowers (Proctor and Yeo 1973). In the three-habitat network Rubus ideaus is included in this module which does not fit very well with the previous image of the module. Perhaps the tube-shape is the base of the module but the visiting insects also interact with plants with other flower shapes thus including them as well in the module. It is probable that the interacting insects are generalists, especially when one looks at this module with the perspective of
nestedness. Tube-shaped flowers are impossible for many insects to pollinate, i.e. the plants must be specialists. If the module is in a nested manner this means the visitors should be generalists, which they are in this study. The addition of plants with flowers shaped differently to the rest of the module is then a consequence of the generalist insects.
2. Dune module
One of the modules in the three-habitat network consists of 18 species of which all but one are found in the dune habitat. Bellis perennis is only found in the meadow and is linked to the dune module by three hoverflies. Eleven of the 18 species are hoverflies. The central plant species, Mulgedium tataricum and Cakile maritima have blue flowers. I do not know what the linking traits are for this module. Perhaps it is the
14
adaptation to the dune habitat. But why are as much as 11 of the hoverflies gathered in this module? Why are they so very fond of the two plants with blue flowers that keep the module together? Are they attracted by the blue flower colour? For further studies it would be interesting to try to find out what interlinks this module.
3. White flower module
In the meadow and forest-meadow networks Stellaria graminea and Sorbus aucuparia are central in different modules, but when all three habitats are combined they
constitute a single module. The species composition, though, is very constant. The plants have the white colour of the flowers in common but in addition to this I do not know what keeps the module together. All species but one are found in the meadow. 4. Yellow-white bowl-shaped flower module
The modules gathered around Ranunculus bulbosus, Potentilla erecta and Ranunculus acris and Saxifraga granulata are in the three-habitats-network merged to become one module with a high proportion of non-Syrphidae Dipterans as visitors. The probable uniting traits are the flat and open, white or yellow flowers of the plants. Bowl-shaped flowers are easy for the flies to both land on and eat of (Willmer 2011). All of the species are found in the meadow, though some visit other habitats as well. It is unclear what keeps this module from merging with the Stellaria graminea and Sorbus
aucuparia module. The colours and flower-shapes are the same with an exception of size.
5. White campanulate flower module
In the meadow-network the Vaccinium vitis-idaea and Maianthemum bifolium module consists of these two plant species, two bee species and one species of butterfly. The common denominator thus seems to be the small, white, campanulate flowers, which bees can enter by climbing. In the three-habitat network, a variety of insects are added, as are two other white flowers, but these have flat flowers. This makes the previously quite clear module characteristics disappear with only the white colour left.
The Galium and Hieracium modules do not appear to have clearly visual uniting
characteristics. In addition, the species in these two modules are not very faithful to “their” module and many of the links are found between modules (Figure 2).
All five species shared between the dune and forest habitats were also found in the meadow. The lack of species shared only by the dune and the forest habitats is most probably an effect of too little collection effort, Wallin (2011) having found six such species. However, this may indicate that species have more difficulties overcoming the differences in abiotic conditions between the dune and the forest habitats than between the other habitats (forest-meadow and meadow-dune) and, consequently, the dune and the forest are the two habitats that are the most different. The dune is very exposed to sunlight and wind and can become very hot, while the forest has a more stable, less windy and cooler climate. The different conditions probably affect the way insects are attracted to plants, both regarding visual and olfactory cues,
resulting in insects from other habitats having more difficulties finding appropriate flowers. This suggests that the forest constitute more of a barrier between habitats than a meadow. Dunes are not often found as barriers between habitats.
The two bee species at Skalasand classified as nearly threatened (NT) by the Swedish list of endangered species (ArtDatabanken 2010) were both found in the dunes visiting common plant species with high abundances. Dasypoda hirtipes visited Hieracium umbellatum and Mulgedium tataricum and Epeolus marginatus visited H. umbellatum and Thymus serphyllum, some of the most common species in the dune habitat. A preliminary conclusion is therefore
15
that lack of food resources is not the reason for their rarity. To be able to suggest on
conservation measures, one needs to further investigate the role and function of these species in the network, but more importantly to study their niches as a whole.
I found three species of hoverflies not previously reported from Gotland. Ortonevra
stackelbergi was found visiting Stellaria graminea, Ranunculus acris and Sorbus aucuparia. Ortonevra intermedia visited Rosa canina and Viburnum opulus and Eristalis pseudorupium visited S. aucuparia. The presence of these species may be temporary and caused by
favourable winds, but the number of specimens found, three each of the Ortonevra species and two E. pseudorupium, indicates more stable populations.
Comparison of Skalasand and Gotska Sandön networks
The locations of the study plots for the Skalasand study were, for comparative reasons, chosen to resemble those on Gotska Sandön as much as possible. The flora i.e. presence or absence of species at the study plots was not previously known to me and could therefore not, at the time, be taken into consideration. Of the 31 interacting plant species in the Skalasand network, 16 were also part of the network at Gotska Sandön which had a total of 44 interacting plant species. Skalasand and Gotska Sandön have 19 insect species in common, however, some of the insects from Gotska Sandön have not been determined to species and the two networks may have more species in common. So far, all in all 35 species are present in both networks. The lower species richness recorded at Skalasand is most likely a result of fewer hours spent in the field; 44 hours were spent at Skalasand resulting in 224 observed interactions involving 88 animal and 31 plant species. During the 98 hours spent on Gotska Sandön, 348 interactions were observed including 160 animal and 44 plant species (Wallin 2011). For plant species, most of the flowering period was covered at Skalasand so the number of plant species should not be much affected by the smaller number of hours in field, although late meadow plants might be underrepresented or lacking since the meadow was mowed in midseason. For insect diversity, the effect of fewer working hours in the field is probably more apparent.
Differences in species richness may also partly be explained by the fact that Gotska Sandön is a national park maintained with the objective to conserve biodiversity, whereas the Skalasand area is more exposed to anthropogenic influences. Considering that Gotska Sandön is much larger than the sandy part on north-eastern Fårö, it should host a higher number of species according to the theory of island biogeography (Townsend et al. 2008). However, being less isolated than Gotska Sandön, the Skalasand area should be influenced by a taxonomically broader fauna arriving from the nearby limestone areas where different plants and animals dominate. Of unknown reasons the Skalasand network has a richer fauna of insects belonging to the groups Syrphidae and Apiformes while Muscidae-flies constitute a relatively larger part of the fauna on Gotska Sandön.
The percentages of habitat generalists are more or less the same at both study sites. At Skalasand 26,9% of the species are present in more than one habitat and 4,2% are present in all three habitats whereas the corresponding figures for Gotska Sandön are 21,6 % and 4,4 %, respectively (Wallin 2011). These figures ought to be dependent on what species take part in the network. Bees, for example, are often very good flyers with capacity to cover larger areas (Willmer 2011) and thus visiting different habitats. Only a smaller proportion of plants have the ability to live in different habitats. It would be interesting to further study if the proportion of habitat generalists is the same in other multi-habitat networks. If so, does this pattern contribute to reduce the interspecific competition or are there other reasons?
According to Olesen et al. (2007), modules can be constant over time and space even though species composition may differ. The three similar modules found in both Skalasand and
16
Gotska Sandön network may be thought of as coevolutionary units, which may form parts of larger pollination syndromes. If some of the interactions are more beneficial than others the species should specialise on those that enhance fitness the most. However if no such
advantages exist there are no initiatives for the species to favour facilitative traits (Muchhala
et al. 2008). The tube-shaped flowers modules may constitute an example of how coevolution
might work on its participants. To be able to reach the nectar in the tubular flower the insect needs a long tongue. Insects with shorter tongues cannot reach the nectar and will therefore not visit nor pollinate such flowers. Coevolution, in theory, appears when the plant evolves even deeper tubes as a specialisation to favour the best pollinating insects with the longest tongues. The insects thus answer by evolving longer tongues (Willmer 2011). Olesen et al. (2007) suggested that modules may represent coevolutionary units and the tube-shaped flower module may be an example of this. It is plausible that the other modules share similarly strong connections although much harder for us to detect. In the discussion, the Skalasand network, (page 13-14) I have given my suggestions on interlinking traits of the modules.
The analysis of the 35 species common to the Skalasand and Gotska Sandön networks shows that the species’ linkage levels in the two networks are correlated, i.e. a species with many links in one of the networks tends to have many links in the other network as well. This may reflect the differences in niches the species have evolved. Some have a more generalised niche and visit or get visited by many other species while others are specialised on one or a few other species. The habitat generalisation levels of the different species show a similar pattern implying that the number of habitats a species normally visits or lives in is quite constant. This is probably related to ability, or lack of ability, to live in different habitats or, for insects, to fly between them, i.e. a combination of niche width and flying capability. The roles of the species in the two networks are also connected, i.e. a species with a central role in one of the networks tends to have a similar role in the other network as well. The roles are decided in relation to the species composition of the network. The presence, absence and increase or decrease of each species influences the importance of other species, but according to the Spearman Rank Correlation Coefficient test this has not had a great impact on the species compared.
General patterns in the combined networks
Both the within-module degree (z) and among-module connectivity (c) are higher for plants than for animals (Figure 6). The higher z-values imply that plants are more well-connected to nodes within their own modules than are animals, a notion most likely related to the general trend that modules are often formed around plant species rather than animal species (Olesen and Dupont 2009). Animals have the highest c-values, but because a larger proportion of animals (68%) compared to plants (39%) are peripheral species connected to one plant or one insect only (c=0) the average for plants automatically gets higher. As a consequence of the average c and z being higher for plants than for animals, plants often have more central roles in the network (Olesen and Dupont 2009) this was also confirmed for both the Skalasand and Gotska Sandön networks where only plant species represented network- or module-hubs. Part of this pattern may reflect the way data was collected. Most studies are based on data where insects are registered or collected when they visit a particular plant species. As a way of turning the perspective to the point of view of the insects one could investigate networks on the basis of the pollen load of insects determined to plant species. This would be an
interesting approach for further studies.
Most of the animals that visit all three habitats are found in the connector-quadrant (Figure 6). This means that animals living in or flying between different habitats often take the role as
17
connector species linking the modules together. Further analyses are needed to investigate this pattern.
The habitat generalisation levels and roles are highly significantly correlated for both plants and animals. Habitat generalists can interact with species present in the separate habitats while species present in only one habitat will never have the chance of interacting with species only present in other habitats. The probability of the habitat generalist species to have “higher” roles and to function as a connector or hub species thus increases. Figure 6 show a tendency towards such a pattern. The habitat generalisation levels and linkage levels of both plants and animals are correlated. Species found in several habitats tend to have many links to other species. This means that species which are generalists in their choice of habitat seem to be so in species-visits as well. Linkage levels and roles also show highly significant
correlations for both plants and animals, but I think one should be careful not to over-interpret this because the role of a species to a large extent is decided on by its linkage level, although to what modules the links are attached also affects the role distribution. Plants and animals are analysed separately because of their different living conditions. The correlations are stronger for animals than for plants, implying that other factors influence plants more.
With the combination of the results from both Skalasand and Gotska Sandön studies
Syrphidae and Apiformes are the two taxonomic groups with the highest percentage of habitat generalist species visiting more than one habitat (46% and 36% respectively). They have also the highest percentages of species visiting all three habitats (12% and 14%, respectively). This is probably due to different adaptations, for example their ability to fly longer distances
(Willmer 2011).
A plant-pollinator network is a very complex system to investigate and describe. Both analysis of the single network, comparisons of both networks and the search for general patterns should be investigated further. This thesis covers the most basic aspects and form basis for more elaborate studies in the future.
A
CKNOWLEDGEMENTS
This thesis was financially supported by Stiftelsen Extensus and Gotland University. I thank my supervisors Jette Knudsen and Bertil Ståhl for plenty of encouragement and for motivating me to investigate this field of study, Jakob Wallin for letting me use his data and for his good ideas and enthusiasm and David Bystedt for his help and great patience concerning statistics. Furthermore, I am very grateful for all the help I got with identification of the insects. Anders Nilsson, Uppsala University helped with the bees (Apiformes), Jan Edelsjö, ArtDatabanken with the hoverflies (Syrphidae) and Julia Stigenberg and others, Naturhistoriska riksmuseet helped me with all sorts of insects. I also thank all of my family and friends for their support and curiosity to see the finished work.
R
EFERENCES
ArtDatabanken. 2010. Sök rödlistade arter i Sverige 2010.
http://www.artfakta.se/GetSpecies.aspx?SearchType=Advanced, SLU, revised 2010 acquired 2012-06-16
18
Bartsch, H. 2009a. Nationalnyckeln till Sveriges flora och fauna; Tvåvingar: Blomflugor. Diptera: Syrphidae: Syrphinae. ArtDatabanken SLU, Uppsala
Bartsch, H. 2009b. Nationalnyckeln till Sveriges flora och fauna; Tvåvingar: Blomflugor. Diptera: Syrphidae: Eristalinae & Microdontinae. ArtDatabanken SLU, Uppsala Bascompte, J. and Jordano, P. 2007. Plant-animal mutualistic networks: the architecture of
biodiversity. Annual Review of Ecology, Evolution, and Systematics. 38: 567-593 Chinery, M.and Coulianos, C-C. 1988. Insekter i Europa. Bonnier, Stockholm.
Cederberg, B. 2009a. Fältbestämning av humlor (arbetare & drottningar) Sydsverige, nemoral region http://www.artdata.slu.se/Humlor/filer/Schema_sydsverige_090404.pdf,
ArtDatabanken, SLU, revised 2009-04-01 acquired 2011-05-28 Cederberg, B. 2009b. Humlor i Sydsverige,
http://www.artdata.slu.se/Humlor/filer/Humlor_sydsverige_090404.pdf, ArtDatabanken, SLU, revised 2009-04-01 acquired 2011-05-28
Douwes, P., Hall, R., Hansson, C. and Sandhall, Å. 1997. Insekter. Interpublishing, Lund, Sweden
Dupont, Y. L. and Olesen, J. M. 2009. Ecological modules and roles of species in heathland plant–insect flower visitor networks. Journal of Animal Ecology 78:346-353
Fowler, J., Cohen, L. and Jarvis, P. 1998. Practical statistics for field biology. 2nd edition John Wiley & Sons Ltd, Chichester, UK
Guimerá, R. and Amaral, L. A. N. 2005a. Functional cartography of complex metabolic networks. Nature 433: 895-900
Guimerá, R. and Amaral, L. A. N. 2005b. Cartography of complex networks: modules and universal roles. Journal of Statistical Mechanics: Theory and Experiment article number P02001
Johnson, S. D and Steiner, K. E. 2000. Generalization versus specialization in plant pollination systems. Trends in Ecology and Evolution. 14, 4:104-1043
Kearns, C. A., Inouye, D. W. and Waser, N. 1998. Endangered mutualisms: the conservation of plant-pollinator interactions. Annual Review of Ecology and Systematics 29: 83-112 National Research Council of the National Academies. 2007. Status of pollinators of North
America. National Academies Press, Washington DC, USA.
Mitchell, R. J., Irwin, R. E., Flanagan, R. J. and Karron, J. D. 2009. Ecology and evolution of plant-pollinator interactions. Annals of Botany. 103:1355-1363
Mossberg, B., Stenberg, L. and Ericsson, S. 1992. Den nordiska floran. Wahlström & Widstrand, Solna, Sweden
Muchhala, N., Caiza, A., Vizuete, J. C. and Thomson J. D. 2008. A generalized pollination system in the tropics: bats, birds and Aphelandra acanthus. Annals of Botany. 103: 1481-1487
Olesen, J. M., Bascompte, J., Dupont, Y. L. and Jordano, P. 2007. The modularity of
pollination networks. Proceedings of the National Academy of Sciences 104:19891-19896 Olesen, J. M., Dupont, Y. L., O´Gorman, E., Ings, T. C., Layer, K., Melián, C. J., Trøjesgaard,
K., Pichler, D. E. and Rasmussen, C. 2010. From Broadstone to Zackenberg: Space, time and hierarchies in ecological networks. In G. Woodward, editor. Advances in Ecological Research. Elsevier Ltd., Burlington 42: 1-69
Pellmyr, O. 1992. Evolution of insect pollination and angiosperm diversification. Trends in Ecology & Evolution, 2: 46-47
Proctor, M. and Yeo, P. 1973. The pollination of flowers. Harper Collins Publishers, London, UK pp. 34-43, 356
Townsend, C. R., Begon, M. and Harper, J. L. 2008. Essentials of Ecology. 3rd edition Wiley-Blackwell, Oxford, UK
19
Wallin, J. 2011. Plant-pollinator networks in three habitats on a Baltic island. Bachelor thesis,Ekologiprogrammet, Gotland University
Willmer, P. 2011. Pollination and floral ecology. Princeton University Press, New Jersey, USA
20
S
AMMANFATTNING
Växter, närmare bestämt angiospermer, började pollineras av insekter redan under Krita för cirka 100 miljoner år sedan. Vissa hävdar att det var pollination med hjälp av insekter som gjorde att angiospermerna blev en så artrik grupp så snabbt. En av fördelarna med
insektspollination var att växterna inte behövde producera lika mycket pollen som vid vindpollination eftersom pollenet fastnade på insekternas kroppar och sedan spreds när insekterna flög från blomma till blomma. Insekternas rörlighet medförde också att individer av samma växtart inte längre behövde stå lika nära varandra för att kunna bli pollinerade utan insekterna kunde hitta, besöka och pollinera dem ändå. För att locka till sig insekter började växterna utveckla olika dofter och färggranna blommor i olika former. Insekterna i sin tur utnyttjade pollenet som födoresurs och specialiserade sig så småningom på olika sorters blommor för att effektivisera samlandet av födan.
Studier har visat att pollinationsnätverk världen över är uppbyggda på ungefär samma sätt. Det finns arter som är anpassade att besöka eller besökas av många och medan andra har anpassningar endast för att passa en eller ett fåtal arter. Arterna i pollinationsnätverk bildar ofta moduler där vissa arter har väldigt centrala roller medan andra inte alls är lika viktiga för att hålla ihop nätverket. Pollinationsnätverk är väldigt fascinerande och komplexa strukturer där mängder av olika aspekter påverkar det slutgiltiga utfallet.
Det översiktliga målet med arbetet är att fördjupa kunskapen om pollinationsnätverk som omfattar flera habitat. De mer direkta målen med arbetet är att 1) studera strukturen hos ett pollinationsnätverk insamlat på Skalasand, Fårö, Gotland 2) jämföra resultatet med en
liknande studie utförd på Gotska Sandön året innan och 3) att leta efter generella mönster med de båda nätverken sammanslagna. Metoden för skalasandsstudien baserades på Gotska Sandö-projektets för att underlätta jämförelser. Även platsen för studien valdes för att i så hög grad som möjligt likna de habitat som besökts på Gotska Sandön. Tre habitat, dyn, skog och äng, á två 500 m2 rutor vardera besöktes vid åtta tillfällen spridda över sommaren 2011. Alla
blommande växtarter iakttogs vid varje tillfälle och pollinerande insekter samlades och artbestämdes. Materialet analyserades därefter, bland annat med hjälp av programmet SA (simulated annealing).
I skalasandnätverket ingick 88 insektsarter och 31 växtarter. De interagerade i 224 olika kombinationer. Gotska Sandöns 160 insektsarter och 44 växtarter interagerade i 348 kombinationer. Skillnaderna i antalet arter och interaktioner beror till viss del på att
skalasandnätverket baseras på data från färre timmar i fält. Skalasandnätverket hade en rikare fauna av grupperna Syrphidae och Apiformes (blomflugor och bin och humlor) medan
Muscidae och andra liknade fluggrupper utgör en stor del av faunan på Gotska Sandön. Trots stora skillnader i artsammansättning fann jag tre moduler som återkom i båda nätverken. Det var modulerna samlade kring Ranunculus bulbosus, växter med tubformade blommor och Vaccinium vitis-idaea och Maianthemum bifolium. Det är osäkert vilka karaktärer som gör att de här modulerna återkommer i någorlunda lika former i båda nätverken, men troligtvis söker sig den stora andelen egentliga flugor (Muscidae) och snarlika flugor, till växter med gula eller vita blommor med en platt och öppen form som är lätt att landa i vilket R. bulbosus och de övriga växterna i modulen hade gemensamt. Växterna med tubformade blommor besöks främst av bin och humlor (Apiformes) som tack vare sin långa tunga kan nå nektarn som bildas längst ner i botten av blomman. Gemensam nämnare för V. vitis-idaea plus M.
bifolium-modulen är den vita färgen på blommorna. Huruvida de gemensamma drag jag antar att modulerna grundar sig på stämmer med insekternas och växternas verklighet är svårt att säga eftersom vi människor inte uppfattar naturen på samma sätt som de gör. Till exempel kan
21
vi varken se uv-ljus eller känna vissa av de dofter som växterna sänder ut. Intressant var också att se att artantalet i de olika modulerna var i stort sett det samma i de båda nätverken.
Nätverkens olika moduler bildas runt en eller ett fåtal växtarter, så kallade hubbar. Jag fann inga insekter med dessa roller. Däremot verkar de djur som är habitatgeneralister i stor grad fungera som konnektorarter som länkar samman de olika modulerna vilket kan förklaras av att insektsarter som är habitatgeneralister ofta även är generalister vad gäller växtval vilket framkom av studien. De taxonomiska grupperna Syrphidae och Apiformes utmärker sig som de grupper där störst andel av arterna är habitatgeneralister. De har dessutom de största andelarna av arter som återfinns i alla tre habitaten.
22
A
PPENDIX
Species/Species epithet Swedish name
Species found in habitats:
Insect species
Agathidinae sp. 1 brackstekel dune
Ammophila campestris rovstekel dune
Anastrangalia sanguinolenta tegelbock meadow dune
Ancistrocerus scoticus nordmurargeting dune
Anthocoridae sp. 1 näbbskinnbagge meadow
Bombus hortorum trädgårdshumla meadow dune
Bombus jonellus ljunghumla meadow dune
Bombus lucorum mindre jordhumla meadow forest dune
Bombus pascourum åkerhumla meadow forest dune
Bombus terrestris större jordhumla meadow forest dune
Braconidae sp. 3 brackstekel meadow
Callophrys rubi grönsnabbvinge meadow dune
Ceratopogon sp. 1 svidknott meadow
Cerceris arenaria knutstekel dune
Chelonus sp. 1 brackstekel dune
Chloropidae sp. 10 fritfluga meadow dune
Chloropidae sp. 9 fritfluga meadow
Chrysididae sp. 1 guldstekel dune
Cicadellidae sp. 2 dvärgstrit meadow
Coleoptera sp. 3 skalbagge dune
Conops quadrifasciatus stekelfluga dune
Dasypoda hirtipes praktbyxbi dune
Didea alneti grön vinkelblomfluga dune
Dolichopodidae sp. 1 styltfluga meadow
Empididae sp. 4 dansfluga meadow forest
Epeolus marginatus rödfiltbi dune
Ephydridae sp. 4 vattenfluga meadow
Eristalinus sepulchralis dyngslamfluga meadow dune
Eristalis interrupta fältslamfluga dune
Eristalis pertinax gulfotad slamblomfluga forest
Eristalis pseudorupium sommarslamfluga meadow
Eristalis similis vandrarblomfluga dune
Eristalis tenax storslamfluga dune
Eupeodes corollae nyfiken blomfluga meadow dune
Eupeodes latifasciatus blank fältblomfluga meadow
Eupeodes lundbecki glasvingad blomfluga dune
Eupeodes luniger månfältblomfluga dune
Formica fusca svartslavmyra meadow forest
Gonepteryx rhamni citronfjäril dune
Halictus rubicundus skogsbandbi meadow
Helophilus affinis mörk kärrblomfluga meadow
Helophilus hybridus större kärrblomfluga meadow dune
Helophilus pendulus pendelblomfluga meadow dune
Helophilus trivittatus ljus kärrblomfluga meadow dune
Hoplitis claviventris märggnagbi dune
Hylaeus confusus ängscitronbi meadow dune
Lasioglossum fratellum svartsmalbi meadow
Lasioglossum leucopus bronssmalbi meadow
Lasioglossum punctatissimum punktsmalbi meadow
Lasioglossum zonulum zonsmalbi meadow
23
Macropis europaea lysingbi meadow
Melanostoma scalare lång gräsblomfluga meadow
Melitaea sp. nätfjäril meadow forest dune
Mordellidae sp. 1 tornbagge dune
Muscidae sp. 12 egentlig fluga meadow
Muscidae sp. 33 egentlig fluga meadow forest
Muscidae sp. 34 egentlig fluga meadow
Muscidae sp. 35 egentlig fluga meadow dune
Muscidae sp. 36 egentlig fluga meadow forest
Muscidae sp. 37 egentlig fluga meadow
Muscidae sp. 8 egentlig fluga meadow
Myrmica rubra trädgårdsrödmyra forest
Oedemeridae sp. 1 blombagge meadow dune
Oedemeridae sp. 2 blombagge dune
Oedemeridae sp. 3 blombagge dune
Orthonevra intermedia kärrglansblomfluga meadow dune
Orthonevra stackelbergi ängsglansblomfluga meadow
Pelecocera tricincta spetsöronblomfluga meadow dune
Phthiria pulicaria svävfluga dune
Phyllopertha horticola trädgårdsborre dune
Pieris napi rapsfjäril dune
Platycheirus albimanus silverfotblomfluga meadow
Polyommatini sp. blåvinge meadow
Satyrinae sp. gräsfjäril meadow dune
Sericomyia lappona lapptorvblomfluga dune
Sericomyia silentis ljungtorvblomfluga meadow forest dune
Sphaerophoria batava sandsländfluga meadow dune
Sphaerophoria scripta mörk sländfluga meadow dune
Sphex funerarius gräshoppsstekel dune
Syrfus torvus hårig solblomfluga dune
Syritta pipens kompostblomfluga dune
Tachinidae sp. 8 parasitfluga meadow
Thyrianthrax fenestratus vitfläckig svävfluga meadow dune
Thysanoptera sp. trips forest
Volucella pellucens fönsterblomfluga dune
24
Plant species
Bellis perennis tusensköna meadow
Cakile maritima marviol dune
Calluna vulgaris ljung forest
Epilobium angustifolium mjölkört dune
Galium album buskmåra meadow
Hieracium sect. vulgata hagfibblor meadow forest
Hieracium umbellatum flockfibbla dune
Lathyrus japonicus strandvial dune
Maianthenum bifolium ekorrbär meadow forest
Malus domestica äpple dune
Melampyrum pratense ängskovall forest
Mulgedium tataricum sandsallat dune
Plantago lanceolata svartkämpar meadow
Potentilla erecta blodrot meadow
Ranunculus acris vanlig smörblomma meadow
Ranunculus bulbosa knölsmörblomma meadow
Rhinanthus serotinus höskallra meadow
Rosa canina stenros dune
Rubus idaeus hallon dune
Saxifraga granulata mandelblom meadow
Sorbus aucuparia rönn meadow
Sorbus intermedia oxel forest
Stellaria graminea grässtjärnblomma meadow
Taraxacum ruderalia sp. maskros meadow
Thymus serpyllum backtimjan dune
Trientalis europaea skogsstjärna meadow forest
Trifolium repens vitklöver meadow
Vaccinum vitis-idaea lingon meadow forest
Viburnum opulus olvon meadow
Vicia cracca kråkvicker meadow
_______________________________________________________________________________________ Avdelningen för biologi, Högskolan på Gotland, SE-621 67 Visby
Department of Biology, Gotland University, SE-621 67 Visby www.hgo.se
Examensarbeten i biologi vid Högskolan på Gotland
__________________________________________________________________________________
1. Enekvist, Elisabeth. 2003. Energy intake of Common Guillemot, Uria aalge, chicks at Stora Karlsö, Sweden. Influence of changes in the Baltic Sea. (20p). Handledare: Kjell Larsson, Henrik Österblom. 2. Britse, Gunilla. 2003. Hävdens betydelse för kärlväxtfloran i gotländska skogsbetesmarker. (20p)
Handledare: Karin Bengtsson.
3. Larsson, Martin. 2003. Vandringshinders påverkan på produktionen av havsöring, Salmo trutta. (20p) Handledare: Bertil Widbom.
4. Johansson, Daniel. 2003. Rekryteringsproblem för kustbestånd av gädda, Esox lucius L., på Gotland. (20p) Handledare: Bertil Widbom, Peter Landergren.
5. Andersson, Morgan. 2003. Predationseffekter av fisk i limniska system. Fiskens strukturerande roll i bottenfaunasamhället. (20p) Handledare: Bertil Widbom.
6. Jacobsson, Marie. 2003. Selectivity in gill net fishery for turbot, Psetta maxima L. Adaptation of mesh size to minimum landing size. (20p) Handledare: Bertil Widbom, Anders Nissling.
7. Svedberg, Amira. 2004. Hävdens inverkan på kärlväxternas fenologi i en gotländsk löväng. (10p) Handledare: Karin Bengtsson.
8. Tjernby, Per. 2004. Tryffel och evertebrater. Den lägre faunans betydelse för spridningen av tryffelsporer. (20p) Handledare: Bertil Widbom, Christina Wedén.
9. Nilsson, Micael. 2004. Födoval hos juvenil piggvar, Psetta maxima, och skrubbskädda, Pleuronectes flesus, i grunda gotländska vikar. (20p) Handledare: Bertil Widbom, Anders Nissling.
10. Johansson, Ulrika. 2004. Reproduktionsframgång hos piggvar, Psetta maxima, i olika temperaturer och salthalter. (20p) Handledare: Bertil Widbom, Anders Nissling.
11. Ansén Nilsson, Marianne. 2004. Jämförande studie av anlagda och naturliga våtmarker på Gotland. Främst med avseende på kärlväxtfloran. (20p) Handledare: Karin Bengtsson.
12. Östbrant, Inga-Lena. 2004. Vegetation och fårbete på Stora Karlsö. (20p) Handledare: Karin Bengtsson. 13. Henningson, Eva. 2005. Predationens betydelse för habitatspecifik pigmentering hos sötvattensgråsuggan,
Asellus aquaticus. (20p) Handledare: Bertil Widbom, Anders Hargeby.
14. Martinsson, Jesper. 2005. Skillnader i otolittillväxt och ålder vid metamorfos mellan olika populationer av skrubbskädda (Pleuronectes flesus). (20p) Handledare: Anders Nissling.
15. Dahlman, Gry. 2005. Äggproduktion i förhållande till fiskens storlek, ålder och kondition hos skrubbskädda (Pleuronectes flesus). (20p) Handledare: Anders Nissling.
16. Larsson, Kristin. 2005. Storlek och täthet hos årsyngel av havsöring (Salmo trutta) – en studie relaterad till omgivningsfaktorer i sex närliggande vattendrag på Gotland. (20p)
Handledare: Bertil Widbom, Lars Vallin.
17. Pennanen, Petri. 2005. Ägg- och larvkvalitet hos skrubbskädda, Pleronectes flesus, i relation till honans storlek, ålder och kondition. (20p) Handledare: Anders Nissling.
18. Hallberg, Nina. 2005. Födoval hos juvenil skrubbskädda (Pleuronectes flesus) och piggvar (Psetta maxima) i relation till födoutbudet: Föreligger födokonkurrens? (20p).
Handledare: Bertil Widbom, Anders Nissling.
19. Larsson, Therese. 2006. Boplatsval, täthet och kläckningsframgång hos vadarfåglar på gotländska strandängar. (20p) Handledare: Kjell Larsson.
20. Björklund, Teresa. 2006. Etnobotanik och diversitet i köksträdgårdar på Kuba. (20p). Handledare: Bertil Ståhl.
21. Ridbäck, Ulrika. 2006. Botanical diversity in fragments of semidecidous forest in western Ecuador. (20p) Handledare: Bertil Ståhl.
22. Britse, Lina. 2006. Frö- och groningskaraktärer hos Styrax officinalis (Styracaceae) och deras samband med artens begränsade spridningsförmåga i Italien. (20p) Handledare: Karin Bengtsson, Francesco Spada. 23. Garnett, Jason. 2006. Best Environmental Practices and Technology on U.S. Golf Courses: Factors