Influence of Institutional Shareholders on CEO
Compensation in Sweden
Authors: Ashot Khalatyan, Luay A. Sh. Jouri
Subject: Master Thesis in Business Administration 15 ECTS
Program: Master in International Management
Gotland University
Spring semester 2010
Abstract
Chief executive officer’s (CEO) compensation and its optimal level is an interesting and important topic. How successful and skilled are shareholders monitoring and making changes in its level and its mix? Ownership dispersion is an important determinant of it. In this study we try to answer this question from the perspective of institutional shareholders as they hold a substantial part of equity in firms. The paper sheds light on institutional ownership dispersion effect on CEO total and cash compensation in Sweden. Analysing data from the 26 largest companies listed on Stockholm Stock Exchange over the time period 2004 - 2008 we find that institutional ownership concentration decreases top executive officer’s total and cash compensation. We also find that small institutional shareholdings are positively associated with chief executive officer’s total and cash compensation. Overall this relationship suggests that institutions are powerful monitors of corporate governance.
Keywords: Business administration, Corporate governance, CEO compensation, Institutional investor dispersion, Sweden
Acknowledgment
We would like to express our gratitude to our supervisor Adri de Ridder for his valuable guidance. We are thankful to Mathias Cöster as his comments contributed greatly to our thesis. The help and assistance of our fellow students during writing our thesis cannot be neglected. Particularly we would like to thank our classmates Usman Tariq and Yan Jing Jing. We are also grateful to our families, especially to Gagik Sardaryan for his support, practical suggestions and encouragement in the hard phases of our research. Thank you all.
Table of Contents
1. Introduction ... 1
1.1 Background ... 1
1.2 Problem formulation and aim ... 3
2. Prior studies and hypothesis development ... 4
2.1 Prior studies ... 4
2.3 Hypothesis development ... 10
3. Methodology ... 13
3.1 Sample selection... 13
3.2 Research design and variable definition ... 14
4. Empirical results ... 17
4.1 Descriptive Statistics ... 17
4.2 Analysis and discussion ... 19
5. Conclusion ... 23 References
1.
Introduction
1.1
Background
Nowadays chief executive officer’s (CEO) compensation has become important discussion topic as it shows great inequality when compared to wages of workforce in other occupations. Many researchers examine the relation between CEO compensation, its mix (i.e. salary, stocks, stock options etc.) and different other variables (e.g. institutional holding concentration, cultural differences, company size, industry, country etc.). One reason for its importance can be that CEO compensation has a rising trend. Murphy (2002) reports that CEO total compensation has increased for S&P 500 industrials in 1990s by more than 2.5 times and the stock option grants about 5 times. For Sweden, Swedish Trade Union Confederation reports that the large companies’ CEOs’ average compensation has increased in the last decade drastically and that it exceeds the average industrial worker compensation around 50 times (Bergström, 2009). However, despite this increase Sweden is one of the countries in Europe that have the lowest CEO compensation as reported by Svenska Dagbladet (2007).
In order to increase shareholder awareness about the CEO compensation and increase transparency and accountability in corporate governance of companies many countries have adopted regulation enforcing companies to disclose their CEO compensation with its components (e.g. the Security Exchange Commission adopted that regulation in USA in 1992). Another relatively new legislation that was initially adopted in the UK and later many other countries including USA and Sweden, on corporate governance is the so called “Say on pay” legislation which gives shareholders non-binding or advisory rights to vote for or against CEO compensation (UK Companies Act, 2006).
According to Swedish Corporate Governance Board (2010, a, b) Swedish corporate governance regulation has a specific feature compared to the US or UK. Nomination committee in Sweden is not subunit of board like in most of the World’s countries including US and UK, and its members are elected by the shareholders. The underlying assumption of this is that the board should not set its own remuneration (Swedish Corporate Governance Board, 2010 b), but it must be done by a representative of shareholders. Another specific feature of Swedish Corporate Governance according to Swedish Corporate Governance Board (2010 b) is that the boards are mostly non-executive. At most one member of firm’s executive team can sit on the board unlike in US and UK.
The major ownership in firms has increased since 1965 (Coffee, 1991), when that was less than 20% for institutional investors. More precisely Useem (1996) reports that on
average institutional investors' share has increased in 1965-1994 period in USA by more than 40% reaching 57%. Because of these increase in institutional ownership proportions in firms, the individual ownership in firms has reduced in comparison making institutional investors holders of major power in companies. Though institutions individually can hold little portion of company equity, the sum of their shareholdings give them power over management (Davis and Thompson, 1994).
Our involvement with “Influence of institutional shareholders on CEO compensation in Sweden” topic is based on the fact that most of researches examine institutional ownership dispersion influence on CEO compensation in USA. Studies of Swedish, USA and France corporate governance practices by Lubatkin et al. (2005) show that corporate governance developed by one nation (in our case USA) is a set of solutions to problems that can be feasible only in the same or similar social and cultural context as it was developed in. Thus findings for USA can’t be accepted as granted and generalized on Sweden. However because of lack of studies in this area in Sweden we mostly discuss research results from USA.
On average CEOs in USA are paid much more that in Sweden (Randøy and Nielsen, 2002). These authors found that on average in 1998 the Swedish CEO's were paid around SEK 1.5 million ($180.000) which is much lower than that in USA. Companies from the same sector in Sweden and in USA like Ericsson and Motorola paid their CEOs $1,1 million and $58,9 million (including stock options) respectively in 1999 (Randøy, Nielsen, 2002). Murphy (1998) found that levels of pay and pay-performance sensitivities are in general higher in USA than in other countries, which of course can distort relations found for US between CEO compensation and institutional shareholdings.
While discussing the corporate governance differences in Sweden and USA Lubatkin et al. (2005) argue that CEOs in Sweden deviate from the traditional agency theory model. This study highlights that in the more collectivistic and egalitarian Sweden CEOs are more into voluntary alignment of their actions with interest of shareholders unlike in USA where dominating is the use of opportunity for individual’s interests. These authors also show that in Sweden executives are reluctant to use chances to increase their benefits, as they’ll be severely judged and punished by the society because of egalitarian norms and equality of this country.
1.2
Problem formulation and aim
Agency theory (Jensen and Meckling, 1976) suggests that the principal (shareholders) should monitor the agent’s (manager) actions and make arrangements in his compensation. Institutional investors are heterogeneous group of organizations with different disposition toward exercising their influence (O'Barr and Conley, 1992). This comes from the differences of the institution-firm relations (e.g. David, Kochhar and Levitas (1998), Hartzell and Starks (2003)) and the size of institutional shareholding (e.g. Khan, Dharwadkar and Brandes (2005), Ozkan (2007), Hartzell and Starks (2003) etc.). Prior studies find negative correlation between institutional shareholding concentration and the level of CEO compensation (e.g. Ning, Hu and Garza Gomez, 2009), and positive correlation between institutional ownership aggregation and the level of CEO total compensation (e.g. Khan, Dharwadkar and Brandes, 2005). However limited research has examined the effect of institutional ownership dispersion on the CEO compensation level in Sweden.
From the studies mentioned in introduction we can say that the chief executive officer’s compensation is on average quite modest in Sweden compared to that in other European countries and especially compared to USA. We can also say that corporate governance specific features and cultural differences can be factors that can affect the relationship found in USA, between CEO compensation and institutional ownership aggregation and concentration. The facts and findings described in this chapter motivate us to examine the effect of institutional ownership dispersion on chief executive officer’s compensation in Sweden. The aim of our study is to find out if there is any correlation between CEO total remuneration and institutional shareholding dispersion in 26 largest firms listed on Stockholm Stock Exchange in the 2004 to 2008 time period.
In this study we divide institutional ownership into two groups: institutional ownership concentration and institutional ownership aggregation. The term concentration shows the ownership of top 5 institutions as a percentage of total shares outstanding. The term aggregation indicates the difference of the total institutional shareholdings as a percentage of total shares outstanding and the holding of top 5 institutions as a percentage of total shares outstanding. While using the term institutional ownership dispersion we refer to both institutional ownership aggregation and concentration.
2.
Prior studies and hypothesis development
2.1
Prior studies
The relationship between agent and principal in firms cause a relation termed by Jensen and Meckling (1976) as an agency relation. Agency relations are defined by Jensen and Meckling (1976, pp. 308) as "contract under which one or more persons (the principal(s)) engage another person (the agent) to perform some service on their behalf which involves delegating some decision making authority to the agent." They discuss further that if both sides of agency relations are rational people, who want to maximize their utility, then the agent would not always act in the way that will maximize the principal’s welfare. In order to reduce the agents actions that would not maximize the principal's welfare the principal bears monitoring costs (these authors highlight that monitoring cost is not only the cost and efforts for measuring or observing the managers actions, but also to control his actions by budget restrictions, compensation policies, operating rules etc.). In the analysis Jensen and Meckling (1976) show that in some cases the agent is motivated to incur some costs (bonding costs) to guarantee the principal that he will not take some actions that will reduce the principal’s utility or that even if he takes such actions, the principal will be rewarded for that. Particularly Craig, Giao and Salil (2006) find that managers bonding efforts and agency costs are negatively related. Jensen and Meckling (1976) show in their analysis that when managerial function separates from ownership, it is impossible to ensure that the agent will work on the behalf of principal at zero cost, thus the both sides incur costs called agency cost. The reduction in the firm value due to agency cost is defined by Jensen and Meckling (1976) as residual loss which together with the monitoring and bonding costs make up the whole agency cost.
Agency theory suggests that monitoring activities can improve company value. Ning, Hu and Garza Gomez (2009) argue that monitoring cost consist of two parts: outside monitoring cost and self monitoring cost. Some studies show (e.g. Eisenhardt (1989), Beatty and Zajac, (1994)) that manager-shareholder interests can be tied by shareholders either through behaviour-based (e.g. salary, bonus correction i.e. influence on cash compensation) or outcome-based (e.g., stocks and stock options grants i.e. through adding incentives to CEO compensation package) compensation arrangements. However top executives are considered risk averse and by getting incentive based compensation they are bearing risk that is tied to one specific company i.e. they bear the firm specific risk. Findings of Ofek and Yermack (2000) support this. They found that managers being granted additional options sell the shares they had previously in order to reduce their portfolio risk. Hartzell and Starks (2003) discuss the incentive payment to executives and direct monitoring as two alternatives for reducing agency cost. They find that institutions adopt both mechanisms taking into account the costs and the benefits from each of them
as the use of the two can incur rather different costs in different industries and in different companies. Various authors argue (e.g. Burkart, Gromb and Panunzi (1997), Jensen (1993), Chidambaran and John (1999)) that none of these mechanisms is perfect and that they can just coexist together in a firm complementing each other.
However, large shareholding of institutional investors motivates them to monitor firms directly (e.g., Shin (2005), Cremers and Nair (2004), Grossman and Hart (1980), Shleifer and Vishny (1986), Huddart (1993) etc.). These authors find that direct monitoring is cost-effective only for large institutional investors (i.e. costs for direct monitoring are lower than benefits). Consistent with these findings Parrino, Sias, and Starks (2003) argue that it is much costly for small shareholders to monitor the company directly, and they usually are aggressive traders (Noe, 2001) as in case of dissatisfaction with a firm’s corporate governance they sell their shares. This was termed by Parrino, Sias, and Starks (2003) “voting with feet” i.e. leaving the company. From the perspective of costs and benefits of direct monitoring Ning, Hu and Garza Gomez (2009) argue that large institutional shareholders reduce the share of CEO incentive compensation in total compensation as they monitor him directly and the small shareholders increase the share of incentive compensation.
To study if institutional investors influence on CEO compensation level directly or indirectly Hartzell and Starks (2003) investigate the relationship between executive compensation and institutional investors’ concentration and aggregation in companies. Shareholders (in our case institutional shareholders) influence the CEO compensation directly through voting for or against CEO compensation. Hartzell and Starks (2003) found negative correlation between top executive salary, total compensation package and institutional investors’ concentration calculated either for the sum of top 5 institutional shareholdings or institutional investors Herfindahl Index. This implies that large institutional shareholders increase decreases total CEO remuneration and salary. This implies that large shareholdings of institutions enables them influence their power on CEO compensation directly.
Institutions can influence firm indirectly through trading and specific preferences (Hartzell and Starks, 2003). Some small institutional shareholders’ active trading pattern implies that they are not concerned with heavy investment in firm’s corporate governance and they are more likely to be concerned with the liquidity of their investments (Coffee (1991), Bhide (1994)). Accordingly companies being concerned with the preferences of institutional investors design remuneration packages for their executives in order to attract or keep certain “targeted” tips of institutional investors (e.g. Bushee and Noe, 1999), Brickley, Lease and Smith (1988), Allen, Bernardo and Welch (2000)). This was termed by Hartzell and Starks (2003) clientele effect. An example of clientele effect can
be designing executive remuneration package which can be attractive for long term investor clients.
Consistent with Hartzell and Starks (2003), Ning, Hu and Garza Gomez (2009) found that institutional ownership concentration or top 5 institutional shareholdings are negatively related to CEO total compensation and equity based compensation. The authors interpret these findings with two concepts: “political concerns” and “shareholder concerns” (Johnson, Porter, and Shackell, 1997). Examples of “political concerns” can be the influence from negative media coverage, labour unions, regulatory changes etc. Ozkan (2007) studied our topic for 414 firms from United Kingdom and found negative and significant correlation between chief executive officer’s total compensation and institutional ownership concentration. This author highlights two major reasons why institutions with large shareholdings in a firm can be highly motivated in actively monitoring firms and consequently being much involved with CEO compensation level. Those reasons are that large amount of shares can’t be sold immediately without causing stock price decline (so selling large number of shares will cost large institutional shareholders) and shareholding in a company can be connected with investment strategy of an institution. Additionally David, Kochhar and Levitas (1998) argue that selling shares of a poorly performing firm, large institutional shareholders have problem selecting alternative investments because of their large number of investments in various companies. So due to these points institutional investors are motivated to exercise their power on CEO compensation and CEO compensation mix.
Khan, Dharwadkar and Brandes (2005) analyse data of 224 companies from US to investigate the effect of institutional ownership dispersion (both concentration and aggregation) on CEO total compensation. They found that aggregated institutional ownership is positively and significantly correlated to chief executive officer’s salary and total compensation. These findings are consistent with those of Ning, Hu and Garza Gomez (2009). Khan, Dharwadkar and Brandes (2005) also investigate relationship between institutional investors’ concentration on CEO salary and total pay and found negative and significant correlation. They explain negative correlation between ownership concentration and CEO compensation with large institutional shareholders’ preferences to monitor the CEO directly. According to Khan, Dharwadkar and Brandes (2005) the positive correlation between aggregated institutional ownership and CEO total pay is due to the problem of coordination and information asymmetry among large number of institutional investors. They argue that this problem increases CEO discretion and leads to compensation increase.
O'Barr and Conley (1992) define institutional investors as a heterogeneous group of organizations (e.g. banks, public and private pension funds, mutual funds, and insurance
companies etc) with different disposition toward exercising their influence. Several interesting for our topic studies examine the influence of institutional investors on CEO compensation by dividing them into pressure-resistant and pressure-sensitive ones (e.g. David, Kochhar and Levitas (1998), Hartzell and Starks (2003)). Brickley, Lease and Smith (1988) argue that institution-firm relationship can be described either investor relationship or business relationship. Investor relationship is the one that is present in all cases of institutional investments: i.e. the fiduciary responsibility to protect investments against reduction of their investments’ value (O’Barr and Conley, 1992). Business relationship appears when aside of investor relationship the institutional investors have some business relations with a firm (Cook (1977), Levine and White (1961)). On these two dimensions David, Kochhar and Levitas (1998) divide institutional investors pressure resistant (these have only investor relations with firms) and pressure sensitive (these are the ones that have business relationship together with investor relationship).
Pressure sensitive institutional investors (e.g. insurance companies, banks, nonbank-trusts) are in dependent position from the companies, consequently from the CEOs’ of that companies, thus they even can increase their compensation in order to keep and secure positive relations with them and avoid “punishment” from their side (Heard & Sherman, 1987). David, Kochhar and Levitas (1998) further argue that, pressure resistant institutional owners (e.g. public pension funds, mutual funds, endowments and foundations), being independent, influence CEO pay by reducing total compensation and increasing long term incentives in it. These findings are consistent with those of Hartzell and Starks (2003). These findings are also consistent with the definition of institutional investors reported above by O'Barr and Conley (1992) showing that different institutional investors have different disposition towards influencing their power on firms.
Summarizing the previous studies we can say that ownership concentration decreases CEO total compensation. This effect can be explained with findings of some researchers presented above, that imply that large shareholders are much concerned with corporate governance of their firms thus they directly monitor and influence their power on firms to reduce chief executive officer’s compensation and enhance the value of the firm. Direct monitoring is discussed in literature as more preferred and reliable method of monitoring and controlling the CEO. However extensive number of studies found that direct monitoring is mostly cost-effective in case of large shareholdings.
Previous studies concerning the relationship between CEO compensation and institutional ownership aggregation report positive correlation. It is due to higher costs compared to benefits for small institutional shareholders to monitor and influence firms directly. This explains their aggressive trading behaviour. Small institutional shareholders’ large number hampers them to coordinate their actions and influence the
CEO compensation level effectively. In these conditions the chief executive officer being not controlled influences his own compensation level increasing it.
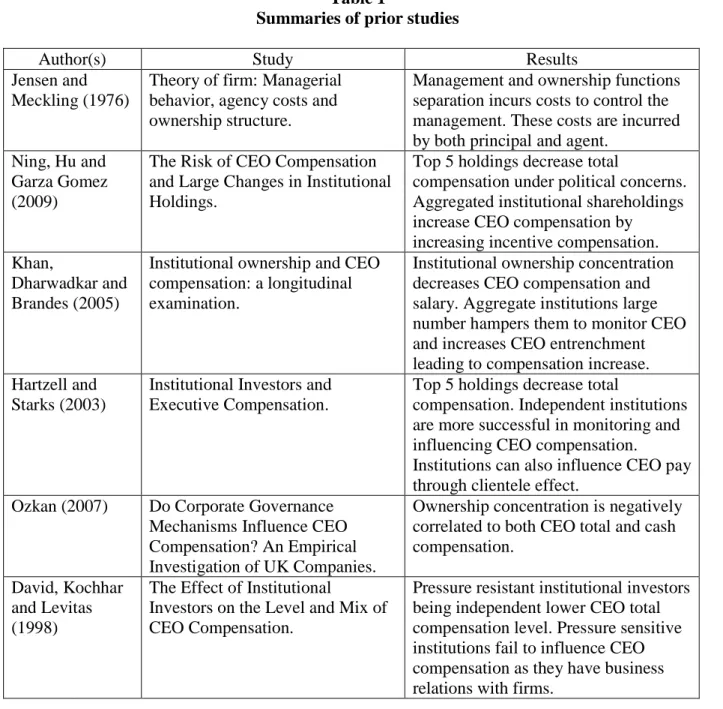
Table 1 summarizes the findings of prior studies that are discussed in this chapter and are relevant for our topic. Overall these studies examine and explain factors and motives of institutional investors influencing CEO compensation.
Table 1
Summaries of prior studies
Author(s) Study Results
Jensen and Meckling (1976)
Theory of firm: Managerial behavior, agency costs and ownership structure.
Management and ownership functions separation incurs costs to control the management. These costs are incurred by both principal and agent.
Ning, Hu and Garza Gomez (2009)
The Risk of CEO Compensation and Large Changes in Institutional Holdings.
Top 5 holdings decrease total
compensation under political concerns. Aggregated institutional shareholdings increase CEO compensation by
increasing incentive compensation. Khan,
Dharwadkar and Brandes (2005)
Institutional ownership and CEO compensation: a longitudinal examination.
Institutional ownership concentration decreases CEO compensation and salary. Aggregate institutions large number hampers them to monitor CEO and increases CEO entrenchment leading to compensation increase. Hartzell and
Starks (2003)
Institutional Investors and Executive Compensation.
Top 5 holdings decrease total
compensation. Independent institutions are more successful in monitoring and influencing CEO compensation.
Institutions can also influence CEO pay through clientele effect.
Ozkan (2007) Do Corporate Governance Mechanisms Influence CEO Compensation? An Empirical Investigation of UK Companies.
Ownership concentration is negatively correlated to both CEO total and cash compensation.
David, Kochhar and Levitas (1998)
The Effect of Institutional
Investors on the Level and Mix of CEO Compensation.
Pressure resistant institutional investors being independent lower CEO total compensation level. Pressure sensitive institutions fail to influence CEO compensation as they have business relations with firms.
Beatty and Zajac (1994)
Managerial Incentives,
Monitoring, and Risk Bearing: A Study of Executive Compensation, Ownership, and Board Structure in Initial Public Offerings
Behaviour-based and outcome-based compensation arrangements are used in firms as alternatives to align principal-agent interests.
Shin (2005) The Composition of Institutional Ownership and the Structure of CEO Compensation.
Large shares of institutional
shareholders’ enable them to monitor firms effectively.
Parrino, Sias, and Starks (2003)
Voting with their feet: institutional ownership changes around forced CEO turnover.
Small institutional shareholders influence CEO compensation through their buying or selling decisions
(“voting with feet”) as they believe it is too much costly to influence the CEO compensation directly.
2.3
Hypothesis development
As Jensen and Meckling (1976) discuss agency relations are caused by the assumption that rational agent in strive of maximizing his or her utility not always would take decisions that would maximize the wealth of the principal. The solution suggested by these authors is that some costs must be incurred by the principal to control the agent and as they argue it is not possible with zero cost. Important for our study methods of controlling the agent are outside direct monitoring and self monitoring. These two methods can be used as two alternatives (Ke, Petroni and Safieddine, 1999). The preference of an institution for using one of these methods depends basically on the size of their holdings and it influences CEO total compensation.
Large institutional shareholders have strong motives to monitor the CEO actions directly. These shareholders in case of dissatisfaction with corporate governance of a firm cannot sell their shares (like in the case of small shareholders). Large shareholders are unwilling to sell their shares as (1) it will cause the share price to decline and will affect negatively their wealth (Ozkan, 2007), (2) the investment in certain companies can be in line with those institutional investors’ investment strategy (Ozkan, 2007) and (3) after selling shares of a firm institutional investors can have problem in reinvesting money as they own shares in large amount of firms (David, Kochhar and Levitas, 1998). There are also some drawbacks for large institutional shareholders to use incentive self-monitoring methods of CEO. Murphy (1991) points out disadvantages for using option grants as an incentive mechanism. Particularly he argues (1) because options don’t give dividends and can be beneficial for CEO only if stock price increases, CEO can be reluctant to pay dividends and be more inclined for share repurchase, (2) to increase the value of his options CEO can take riskier projects and (3) if the stock price falls too much and the CEO believes that the probability of exercising them is too little then options lose their incentive effect.
These disadvantages can influence especially the large institutional shareholders, because of their large stakes in companies. As prior studies show outside direct monitoring is cost-effective for large institutional shareholders (e.g., Shin (2005), Cremers and Nair (2004), Grossman and Hart (1980), Shleifer and Vishny (1986), Huddart (1993) etc.) so it is reasonable to think that large institutional shareholders do monitor their firms directly in Sweden too. In these circumstances large institutions can influence their power to reduce CEO total compensation. Taking into account disadvantages described for incentive payment (self monitoring), the motivation factors of large shareholders that discourage share selling and consistent with Ning, Hu and Garza Gomez (2009), Hartzell and Starks (2003), Khan, Dharwadkar and Brandes (2005) Ozkan (2007) we hypothesize:
Hypothesis 1: Institutional ownership concentration (measured with the sum of top 5 institutional shareholdings) is negatively correlated to CEO total compensation. As Parrino, Sias, and Starks (2003) argue it is costly for small shareholders to monitor the company directly. Thus small institutions prefer chief executive officer’s self monitoring through granting him equity based compensation (Ning, Hu and Garza Gomez, 2009). However in case of dissatisfaction with the firm’s corporate governance (in our case CEO compensation) small shareholders have only one way to act: sell their shares (Parrino, Sias, and Starks, 2003).
As Noe (2001) reports small institutional shareholders are aggressive traders. Thus we conclude that from small shareholders’ perspective the ownership is changing rapidly in firms. This can be an obstacle among small shareholders to create relationship with each other in order to coordinate their efforts to influence the CEO compensation level effectively.
On the other hand institutional investors are diverse group of companies with different propensity to influence their power (O'Barr and Conley, 1992). The findings of David, Kochhar and Levitas (1998) and Hartzell and Starks (2003) described in previous chapter evidence that institutions can influence CEO compensation in quite different ways depending from their relationships with the firm. This means there is conflict of interests among them, which can be another obstacle for small shareholders to coordinate their efforts and influence CEO compensation effectively.
So in sum, small institutional shareholders will try to increase equity based compensation (increasing at the same time CEO total compensation) to align principal-agent interests. In case if they fail to act in this way because of conflict of interests or other difficulties to coordinate their efforts to influence CEO compensation level the CEO will gain power and will influences his own compensation level increasing it. So in both cases institutional ownership aggregation will lead to CEO compensation level increase, thus consistent with Khan, Dharwadkar and Brandes (2005) we hypothesize:
Hypothesis 2: Aggregate institutional shareholding (measured with total minus top 5 institutional holdings) is positively correlated to CEO total compensation.
Besides our 2 hypothesis we intend to check also the correlation between institutional shareholding concentration and aggregation with cash compensation. As a proxy of cash compensation we take the sum of CEO salary and bonus pay. We have no clear predictions about institutional influence on CEO cash compensation thus we do not put any hypothesise.
The remaining of the paper is organized in following way. Section three presents the methodology. Section four presents empirical results and discussion. Our conclusions are in the chapter five.
3.
Methodology
3.1
Sample selection
Initially our sample consisted of 30 largest companies of every year listed on Stockholm Stock Exchange (SSE) during 2004-2008 period without financial and utility sector companies as their regulation environment is quite specific. As our study is on Sweden we removed the companies that have their headquarters out of Sweden. Several companies were also eliminated because of limitations to find data. Sample companies are listed in Table 2. The selected research method is cross sectional (Bryman and Bell, 2007) which implies using in a study sample data from different cases (in our case having different sample companies every year). For every year we took the companies with the largest market capitalization. Market capitalization was calculated through multiplying number of companies’ shares outstanding at year end and their year-end stock price which was taken from NASDAQ OMX website.
Data for this study was collected mainly from the annual reports of the companies. Particularly from the annual reports were collected the number of shares outstanding at year end, book value of equity and return on equity (ROE) and CEO total and cash compensation. We calculated market to book ratio (MTB) through dividing market capitalization into book value of equity at year-end. Market to book ratio, market capitalization and return on equity are taken as control variables.
Ownership data was obtained from Almedalsbiblioteket1.The percentage of top 5 institutional shareholdings in total shares outstanding and total institutional shareholding percentage minus top 5 institutional holding percentages in total shares outstanding were taken for every company as a proxy for ownership concentration and aggregation respectively.
We use also institutional ownership Herfindahl Index2 as an ownership concentration alternative indicator. All in all, our sample consists of 26 companies (total 119 company-year observations).
1 Almedalsbiblioteket is the local library of Visby city, Sweden. 2
The Herfindahl index is a measurement of concentration in industry (it is calculated by the sum of squared market shares of each firm in the industry). In our case instead of share of a firm in industry we use the percent of ownership of each institutional shareholder in total institutional ownership.
Table 2: Sample companies
1. Alfa Laval AB 14.Saab AB
2. Assa Abloy AB 15.Sandvik AB
3. Atlas Copco AB 16.Scania AB
4. Boliden AB 17.Seco Tools AB
5. Elekta AB 18.Securitas AB
6. Getinge AB 19.Skanska AB
7. Hakon Invest AB 20.SKF AB
8. Hexagon AB 21.SSAB Svenskt Stål AB
9. Husqavarna AB 22.Swedish Match AB
10.Lundin Petroleum AB 23.Telefon AB LM Ericsson
11.Meda AB 24.TeliaSonera AB
12.Modern Times Group MTG AB 25.Trelleborg AB
13.NCC AB 26.Volvo AB
3.2
Research design and variable definition
This study aims at studying the effect of institutional shareholders on the total CEO compensation in Sweden through an empirical and quantitative study. We construct our dependent variables (cash compensation and total compensation) according to the method used by Kole (1997) and Conyon and Murphy (2000). Total compensation consists of salary, bonus, stock and stock option grants, pension and perk. Cash compensation is the sum of fixed salary plus bonus. Our independent variables are institutional ownership concentration (Top 5) and aggregation (Total-Top 5). Concentration is measured by percentage of the sum of top 5 institutional shareholdings in firm’s total shares outstanding and the aggregation is measured by the percentage of total institutional shareholdings minus the top 5 institutional shareholdings in a firm’s total outstanding shares.
In addition to institutional ownership concentration, firm-specific characteristics such as firm size measured by firm market capitalization of equity, investment opportunities measured by market to book ratio and profitability measured by return on equity have also been found to be related to CEO pay and pay structure. We took 1 year lagged values of control variables as it is logical that if they effect CEO compensation, then the latest data (i.e. the data from previous year) will be used by remuneration committee to determine CEO compensation.
Firm size has been repeatedly found as an important determinant of executive pay. To manage larger companies CEOs are taking extra responsibility and extra risk and consequently they demand higher compensation. Several other studies report significant association between firm size and CEO compensation (e.g. Conyon and Murphy (2000), Zhou (2000), Hartzell and Starks (2003), etc.). We take market capitalization control variable as a proxy for firm size (SIZE). Market capitalization was calculated by multiplying number of the year-end shares outstanding by their year-end stock price. Based on these findings, we expect a positive relation between firm size and the CEO compensation level.
Market to book ratio (MTB) is used to control for the growth opportunities of a firm. A
firm with higher growth opportunities usually requires more experienced and skilled
CEO, who is then provided with a higher level of pay. Prior studies report significant and positive association between growth opportunities and CEO compensation (e.g. Gaver and Gaver (1993), Baber, Janakiraman and Kang (1996), Guay (1999), and Richardson (2002) etc.). We calculated market to book ratio as year-end market capitalization of a firm equity divided into book value of equity at year-end. Based on findings of prior studies, we expect a positive relation between growth opportunities and the CEO compensation level.
Remuneration committees check the company performance and assign compensation accordingly. While assessing company performance profitability measured with return on equity (ROE) can be a good proxy. However there are quite contradicting findings on pay for-performance relationship. Various researchers use return on equity as control variables for CEO compensation (e.g. Finkelstein and Boyd, 1998, Ozkan, 2007, etc.). Thus we use profitability as a control variable. This data is gathered from companies’ annual reports or calculated through dividing net income to year-end book value of total equity.
To measure the impact of institutional ownership concentration on the CEO total compensation, simple ordinary least square regression model is to be employed. In model 1 we take natural logarithmic3 series of CEO total compensation in yeart as a dependent
variable, a is the intercept, while independent variable is the institutional ownership concentration in the yeart.
ln CEO compensationit = a + b1(% ownership of Top 5 institutions it) + ε (1) In model 2 we control for firm-specific characteristics such as firm size growth opportunities and profitability. The dependent variable is the natural logarithmic series of
3
As the distribution of above mentioned variables is skewed, we used log in order to make the sample more normally distributed.
CEO total compensation at yeart, a is the intercept and independent variable is the
institutional ownership concentration measured by percentage of the sum of top 5 institutional shareholdings in the yeart. Control variables that we use in model 2 are
natural logarithmic series of firm size of prior year (yeart-1), natural logarithmic series of
investment opportunities of prior year (yeart-1) and firm profitability (ROE) in the prior
year (yeart-1).
ln CEO compensationit = a + b1(% ownership of Top 5 institutionsit) +
b2(ln SIZEit-1) + b3(ROEit-1) + b4(ln MTBit-1) + ε (2)
In model 3 we take an alternative measure of institutional ownership concentration: institutional Herfindahl Index and we control for firm-specific characteristics such as those in the second model. The dependent variable is the natural logarithmic series of CEO total compensation at yeart, a is the intercept and independent variable is the
institutional Herfindahl Index at yeart. Control variables utilized are the same as in the
second model.
ln CEO compensationit = a + b1(Institutional Herfindahl Indexit) +
b2(ln SIZEit-1) + b3(ROEit-1) + b4(ln MTBit-1) + ε (3)
In order to check our second hypothesis: the impact of institutional ownership aggregation on the CEO total compensation, simple OLS regression is to be employed. In this model we use the natural logarithmic series of CEO total compensation in yeart as a
dependent variable, a is the intercept while using the institutional ownership aggregation as an independent variable at yeart.
ln CEO compensationit = a + b1(total – top5it) + ε (4)
Further the same control variables as in the second model were introduced in model 4 in order to control for firm-specific characteristics such as firm size growth opportunity and profitability at yeart-1. That is our model 5, which will enable us to study institutional
ownership aggregation effect on CEO compensation.
ln CEO compensationit = a + b1(total – top5it) + b2(ln SIZEit-1)+ b3(ROEit-1) +
b4(ln MTBit-1) + ε (5)
To measure the impact of institutional ownership dispersion on cash compensation we used the same variable but we change the dependent variable into natural logarithmic series of CEO cash compensation. The results of the regression analysis together with descriptive statistics are reported and discussed in the next chapter.
4.
Empirical results
4.1
Descriptive Statistics
The descriptive statistics of sample companies is reported in Table 3 in Appendix. Panel A shows CEO compensation mean median and standard deviation, which consists of salary, bonus, stock and stock option grants, pension and perk. The average compensation for 26 largest companies listed in Stockholm Stock Exchange during the period 2004-2008 is presented in Figure 1. It is remarkable that the largest portion of CEO compensation in Sweden is fixed salary and that the share of equity based compensation is quite small unlike that in US.
From panel A of the Table 3 it can be seen a rising development of CEO compensation in Swedish largest firms during the 2004-2008 period. Mean total compensation has increased by around 5.9% annually4 and median by around 10.7% annually. Despite this it is still about seven times lower than that in USA as compared with the figures reported by Ning, Hu and Garza Gomez (2009).
The highest compensation during sample period was paid to the CEO of Volvo AB in 2008 (41,436 KSEK) and the lowest to the CEO of Hakon Invest AB in 2008 (4 241 KSEK). We took the sum of CEO salary and bonus as cash compensation paid. The highest cash compensation was paid to Modern Times Group MTG AB 2007 (24 692 KSEK) and the lowest was paid to CEO of Hakon Invest AB in 2008 (1 413 KSEK). The
4 The percentage change was calculated through geometric mean.
Fixed salary 44% Bonus 24% Pension 21% Equity based 7% Perk 4%
Figure 1: CEO compensation structure
Average compensation components for the 2004-2008 period from the collected data.
cash compensation like total compensation has a rising trend with little decrease in 2008 which can be the result of financial crisis. The cash compensation has increased in these 5 years by 3.2% annually.
Panel B in Table 2 reports means medians and standard deviations of control variables. As mentioned above we took our control variables for each year for the previous year. The mean market capitalization value of equity has increased since 2003 till 2006 by more than 29.9% annually, but it has gone down in 2007. However, despite this decrease in 2007 it has still increased compared to market capitalization value of equity in 2003 by around 19.1% annually. The highest and the lowest market capitalization in our sample has Telefon AB LM Ericsson in 2006 (449 928 MSEK) and Meda AB in 2003 (1 195 MSEK) respectively.
The mean market to book ratio has risen in 5 year period in our observations by about 18.5% annually (from 2.72 to 5.38). Swedish Match AB has abnormal market to book ratio in 2006 and 2007 years (17 and 57 respectively), but in general means and medians of the years are reasonable.
Our last control variable used is return on equity (ROE). It has increased by 10.1% annually during 5 year period. The most profitable company in our sample is Lundin Petroleum AB in 2003 with return on equity equal to 67 and the lowest one is Telefon AB LM Ericsson with two digit negative return on equity. Our sample means and medians of ROE are quite close.
Panel C of the Table 2 shows institutional ownership descriptive statistics of our sample companies. We can see from it that ownership aggregation has rising development during the 5 years, but the other variables have changed randomly. The top 5 institutional shareholding varies between 16% and 75%. The lowest concentration measured by top 5 institutional shareholdings was observed in Boliden AB in 2006 and the highest in Seco Tools AB in 2007. The lowest and the highest institutional ownership aggregation was observed in Hakon Invest AB (15% in 2006) and Securitas AB (72% in 2008) respectively. The institutional ownership aggregation varies between 15.8% (Hakon Invest AB in 2006) and 72,2% (Securitas AB in 2008).
4.2
Analysis and discussion
In Table 4 (presented in Appendix) we check institutional ownership concentration (measured with ownership percentage of top 5 institutional shareholdings) on CEO total compensation (Model 1). Results of ordinary least square regression show that institutional ownership concentration is negatively related to chief executive officer total compensation (t=-3.544 significant at 1% level). In Model 2 we introduce one-year lagged values of the control variables. After controlling for firm size, profitability and growth opportunities we got the same results as in the Model 1, but with lower level of significance. Particularly we find that institutional ownership has negative and statistically significant correlation with CEO total compensation (t=-2.148 significant at 5% level). Our results show that on average and holding all the other variables of the second model the same, a 1% increase in top 5 institutional shareholding percentage reduces total compensation of chief executive officer by 0.62%.
We test our results of previous tests in Model 3 by using alternative indicator of ownership concentration. Instead of top 5 institutional shareholdings’ percentage, here we use institutional Herfindahl Index. The results of pervious tests still hold in this case (regression analysis results are reported in Table 4 in Appendix). The correlation between Herfindahl Index and chief executive officer’s total compensation is negative (t=-4.075 significant at 1% levels). We can infer from the explanatory power (R2) of Model 2 and Model 3 (47% and 52% respectively) that these models do explain CEO compensation quite well. However we can also infer from them that there should be some other factors that explain its level. Overall the results of regression analysis of Model 1, Model 2 and Model 3 indicate that institutional ownership concentration is negatively and significantly correlated to CEO compensation. Our findings suggest that large institutions are successful in monitoring and reducing CEO total compensation. This can be explained by the findings of some researchers that direct monitoring is cost-beneficial mostly in case of large institutional shareholdings (e.g., Shin (2005), Cremers and Nair (2004), Grossman and Hart (1980), Shleifer and Vishny (1986), Huddart (1993) etc.). On the other hand there are a number of factors that don’t allow the large institutional shareholders to sell their stakes (price decline, selecting new investment etc.). Our results are consistent with those of Ning, Hu and Garza Gomez (2009), Khan, Dharwadkar and Brandes (2005), Hartzell and Starks (2003), Ozkan (2007) etc., supporting our Hypothesis 1 that says institutional ownership concentration is negatively correlated to CEO total compensation in Sweden.
In model 4 (Table 4) we examine the effect of institutional ownership aggregation on CEO total compensation level. First we run regression without using any control variable. The results of the regressions show that there is a positive and statistically significant relationship between institutional ownership aggregation and CEO total compensation
(t=4.869 significant at 1% level). In model 5 we use one-year lagged values of control variables. After controlling for firm size, profitability and growth opportunities we got the same results as in the Model 4. This indicates that institutional ownership aggregation is positively correlated to chief executive officer’s total compensation (t=2.710 significant at 1% level). After controlling for MTB, SIZE and ROE the explanatory power (R2) increased substantially from 17% till 48%. This again, as in the case of ownership concentration effect on CEO total compensation, means that although the Model 5 has enough explanatory power, however there should be other variables that would explain CEO compensation level more. We can say from the analysis results of Model 5 that on average holding all other variables of the model the same, 1% increase in institutional ownership aggregation will lead to 0.784% increase of CEO total compensation. Our results are consistent with those of Ning, Hu and Garza Gomez (2009), Khan, Dharwadkar and Brandes (2005) etc. Our findings can be explained with different factors. One possible explanation of it can be that as it is not cost-effective for small institutional shareholders to monitor and try to influence the CEO pay directly (e.g., Parrino, Sias, and Starks, 2003) they have little motivation and power to act in this way. Consequently they can be more concerned with the liquidity of their shares (Coffee (1991), Bhide (1994)) and not with corporate governance of a firm. In this conditions CEO will not be monitored and influenced by shareholders and can bargain with board and increase his own compensation. Another explanation of negative correlation between ownership aggregation and CEO compensation can be that large number of institutional shareholders, their diverse preferences and information asymmetry among them hamper coordination of their efforts to monitor and influence CEO compensation. These conditions effect CEO entrenchment, increasing his total compensation (Khan, Dharwadkar and Brandes, 2005). Overall our findings support our second hypothesis which says: aggregated institutional shareholding is positively correlated to CEO total compensation.
We checked validity of our results by varying the institutional concentration and aggregation definitions. The Top 5 and total minus Top 5 where changed into Top 3, Top 7 and total minus Top 3, total minus Top 7 (these analyses are not reported). The results reported above still hold for these cases.
The analysis results of Model 2 Model 3 and Model 5 also show that firm size (market capitalization of equity) is positively and significantly correlated to CEO total compensation. These findings suggest that firm size is an important determinant of executive pay, i.e. the larger the company the higher is the CEO compensation. These are consistent with the findings of Conyon and Murphy (2000), Zhou (2000), Hartzell and Starks (2003). The larger the company is the higher is the responsibility and riskier is the job of CEO, which leads to higher CEO compensation. We find weak or no correlation at all between dependent variable and MTB. It is positively correlated to total CEO pay.
This association can be explained with that the boards of companies with high growth opportunities select skilled and experienced CEOs who will be able to utilize these opportunities and increase the firm value. These CEOs at the same time demand higher compensation. These findings are consistent with those of prior studies such as Gaver and Gaver (1993), Guay (1999) etc. As our results evidence firm profitability is negatively and significantly (significant at 5% level) correlated to CEO compensation. These findings are hard to explain, however Duffhues and Kabir (2007) explain negative correlation between CEO compensation and profitability with that firms keep paying their executives even if their firms perform poorly in order to attract, retain and motivate them and to create long-term relations. According to Duffhues and Kabir (2007) another explanation of this effect can be the entrenchment of manager and extraction of higher rents.
In Table 5 we report the results of ordinary least square regressions for studying ownership dispersion influence on CEO cash compensation. The estimated coefficients from Model 1, Model 2 and Model 3 indicate that ownership concentration (measured either by Top 5 of Institutional Herfindahl Index) is negatively and significantly correlated to top executive’s cash compensation. Our findings are in line with those of Ozkan (2007). This means that large shareholders actively monitor CEO actions and influence their power to reduce his salary and bonus. As Beatty and Zajac, (1994) argue the behaviour based and outcome based compensation arrangements can be used as alternatives to align principal-agent interests and various authors discuss that none of them is perfect (e.g. Jensen (1993), Chidambaran and John, (1999) etc.). According to Figure 1 the sum of average salary and bonus in our sample is about 70%, and equity based compensation is 7%. Thus one possible explanation of negative correlation between CEO cash compensation and ownership concentration in Sweden can be that the large shareholders directly monitoring top executive’s actions would be unwilling to reduce equity based compensation further, which is already too low. The explanatory power of the Model 2 and Model 3 is 29% and 36% respectively.
Model 4 and Model 5 in Table 5 report estimated coefficients of OLS regression of institutional ownership aggregation influence on CEO cash compensation. The results indicate that ownership aggregation is positively and significantly correlated to chief executive officer’s cash compensation (significant at 1% level). An explanation for this may be that in case of institutional ownership aggregation CEO is not being monitored directly. This leads to CEO entrenchment and pressuring firm to increase his cash compensation (Khan, Dharwadkar and Brandes, 2005). The emphasis of CEO influence on his own cash compensation is due to his risk aversion (Ofek and Yermack, 2000). The R2 of Model 5 is 33%, which is high.
The correlation between dependent variables and control variables is about the same (significance level is a bit higher) as in the Table 4, in case of CEO total compensation. The explanations of these correlations are basically the same.
5.
Conclusion
Our aim was to examine if there is any correlation between CEO total remuneration and institutional shareholding concentration in large firms in Sweden. Our findings suggest that large institutional holdings do influence the CEO total compensation. This indicates the role of institutions as powerful monitors for companies. These actions are cost-beneficial for large holdings as selling and selecting new company has its negative sides. We tested the effect of institutional ownership aggregation on CEO total pay. We found that in this case the correlation between the two is positive, indicating that small institutional holdings does not monitor and control CEO pay which leads to increases of CEO compensation. On the other hand small holdings do not tie institutions to the company as in the opposite case which allows them to “vote with feet” and sell the company shares (Parrino, Sias, and Starks, 2003).
We checked robustness of our results by changing concentration indicator into Herfindahl index, altering the definition of concentration from Top 5 to Top 3 and Top 7. An alternative check for aggregation was done by varying Total-Top 5 into Total-Top 3 and Total-Top 7. The results were still the same supporting our hypotheses.
Our study investigates also institutional investors’ concentration and aggregation effects on CEO cash compensation. We found that institutional shareholding concentration decreases CEO cash compensation, and aggregation leads to its increase. The possible explanations for these findings are the same as that for the case of total compensation. It can be concluded from our results that firms with institutional ownership concentration are attractive for investment as there is so called free-rider effect. Small shareholders can invest in these firms knowing that large shareholders are monitoring and controlling CEO compensation. However reducing CEO compensation has its negative side. These firms can have issues to attract and retain skilled managers. So the balance must be kept between the two, in order to benefit the firm.
We suggest further study on correlation of CEO compensation risk and the ownership dispersion in Sweden. As our empirical material shows the equity based compensation is quite low in Sweden (7%) compared with that in USA (about 40%), which makes one think about the validity of incentive compensation benefits and its low use by shareholders in this country.
References
Allen, F., Bernardo, A.E. & Welch, I., 2000. A Theory of Dividends Based on Tax Clienteles. The Journal of Finance, 55(6), 2499-2536.
Baber, W.R., Janakiraman, S.N. & Kang, S., 1996. Investment opportunities and the structure of executive compensation. Journal of Accounting and Economics, 21(3), 297-318.
Beatty, R.P. & Zajac, E.J., 1994. Managerial Incentives, Monitoring, and Risk Bearing: A Study of Executive Compensation, Ownership, and Board Structure in Initial Public Offerings. Administrative Science Quarterly, 39(2), pp. 313-335.
Bergström, J., 2009. Makteliten - mycket vill ha mer: en studie av inkomstutvecklingen för makteliten perioden 1950 till 2007, Stockholm: Landsorganisationen i Sverige. Available at:
http://www.lo.se/home/lo/home.nsf/unidview/D7E75939D1A3368CC1257553002881A
A/$file/Makteliten_10.pdf [Accessed April 6, 2010].
Bhide, A., 1994, Efficient markets, Deficient Governance: U.S. Securities Regulations Protect Investors and Enhance Market Liquidity. But Do They Alienate Managers and Shareholders? Harvard Business Review 72, pp.128-140.
Brickley, J.A., Lease, R.C. & Smith Jr., C.W., Ownership structure and voting on antitakeover amendments. Journal of Financial Economics, 20, 267-291.
Bryman A., Bell E. 2007. Business Research Methods revised edition, Oxford University Press.
Burkart, M., Gromb D., & Panunzi F., 1997, Large Shareholders, Monitoring, and the Value of the Firm, Quarterly Journal of Economics 112, 693728.
Bushee, B., & Noe C., 1999, Unintended Consequences of Attracting Institutional Investors with Improved Disclosure, Harvard University working paper.
Chidambaran N., & John K., 1999, Relationship Investing, Managerial Compensation, and Corporate Governance, Tulane University and New York University working paper. Coffee, J.C., 1991. Liquidity versus control: the institutional investor as corporate monitor. Columbia Law Rev. 91 (6), pp. 1277–1368.
Conyon, M.J., & Murphy, K.J., 2000. The Prince and the Pauper: CEO Pay in the US and UK. SSRN eLibrary. Available at:
Cook, K.S., 1977. Exchange and Power in Networks of Interorganizational Relations. The Sociological Quarterly, 18(1), 62-82.
Cremers, K. & Nair, V., 2004. Governance mechanism and equity prices. Working paper, Yale University.
David, P., Kochhar, R. & Levitas, E., 1998. The Effect of Institutional Investors on the Level and Mix of CEO Compensation. The Academy of Management Journal, 41(2), 200-208.
Davis, G. F., & Thompson, T. A. 1994. A social movement perspective on corporate control. Administrative Science Quarterly, 39: 141-173.
Depkin, C., Nguyen, G., & Sarkar, S. (2006). Agency costs, executive compensation, bonding and monitoring: A stochastic frontier approach. Paper presented at annual meeting of American Economic Association (AEA), Boston, MA.
Duffhues, P.J.W. & Kabir, R., 2007. Is the Pay-Performance Relationship Always Positive? SSRN eLibrary. Available at:
http://papers.ssrn.com/sol3/papers.cfm?abstract_id=962030 [Accessed June 8, 2010].
Eisenhardt, K.M., 1989. Agency Theory: An Assessment and Review. The Academy of Management Review, 14(1), 57-74.
Finkelstein, S. & Boyd, B.K., 1998. How Much Does the CEO Matter? The Role of Managerial Discretion in the Setting of CEO Compensation. The Academy of
Management Journal, 41(2), 179-199.
Gaver, J. J. and K. M. Gaver, 1993, Additional evidence on the association between the investment opportunity set and corporate financing, dividend, and compensation policies, Journal of Accounting and Economics, 16, 125-160.
Grossman, S.J. & Hart, O.D., 1980. Takeover Bids, The Free-Rider Problem, and the Theory of the Corporation. The Bell Journal of Economics, 11(1), 42-64.
Guay, W. R., 1999, The sensitivity of CEO wealth to equity risk: An analysis of the magnitude and determinants, Journal of Financial Economics, 43-71.
Hartzell, J.C. & Starks, L.T., 2003. Institutional Investors and Executive Compensation. The Journal of Finance, 58(6), 2351-2374.
Huddart, S., 1993. The Effect of a Large Shareholder on Corporate Value. Management Science, 39(11), 1407-1421.
Jensen, M. & W. Meckling, 1976, Theory of firm: Managerial behavior, agency costs and ownership structure, Journal of Financial Economics 3, 305 – 360.
Jensen, M.C., Modern Industrial Revolution, Exit, and the Failure of Internal Control Systems. SSRN eLibrary. Available at:
http://papers.ssrn.com/sol3/papers.cfm?abstract_id=93988 [Accessed May 31, 2010].
Khan, R., Dharwadkar, R. & Brandes, P., 2005. Institutional ownership and CEO compensation: a longitudinal examination. Journal of Business Research, 58(8), 1078-1088.
Ke, B., Petroni, K.R. & Safieddine, A., Ownership Concentration and Sensitivity of Executive Pay to Accounting Performance Measures: Evidence from Publicly and Privately-Held Insurance Companies. SSRN eLibrary. Available at:
http://papers.ssrn.com/sol3/papers.cfm?abstract_id=138838 [Accessed April 2, 2010].
Kole, S.R., 1997. The complexity of compensation contracts. Journal of Financial
Economics, 43(1), 79-104.
Langsam, S.A., Kreuze, J.G. & Newell, G.E., 1997. Is CEO compensation related to company performance? Journal of Corporate Accounting & Finance, 9(1), 91-99. Levine, S. and P. White. 1969. Exchange as a Conceptual Framework for the Study of Interorganizational Relations. Administrative Studies Quarterly 5: 583-601.
Lubatkin, M.H. et al., 2005. Origins of Corporate Governance in the USA, Sweden and France. Organization Studies, 26(6), 867-888.
Murphy, K.J., 1998. Executive Compensation. SSRN eLibrary. Available at:
http://ssrn.com/paper=163914 [Accessed March 29, 2010].
Murphy, K.J., 2002. Explaining Executive Compensation: Managerial Power versus the Perceived Cost of Stock Options. The University of Chicago Law Review, 69(3), 847-869.
Ning, Y., Hu, X. & Garza Gomez, X., 2009. The Risk of CEO Compensation and Large Changes in Institutional Holdings. SSRN eLibrary. Available at:
http://ssrn.com/paper=1364013 [Accessed March 28, 2010].
Noe, T.H., 2001. Investor Activism and Financial Market Structure, Center for Research on Pensions and Welfare Policies, Turin (Italy). Available at:
http://ideas.repec.org/p/crp/wpaper/14.html [Accessed April 19, 2010].
O'Barr, W.M., Conley, J.M. & Brancato, C.K., 1992. Fortune and Folly: The Wealth and Power of Institutional Investing, Irwin Professional Pub.
Ofek, E., D. Yermak, 2000. Trading stock: equity-based compensation and the evolution of managerial ownership. Journal of Finance 45, 1367-1385.
Office of Public Sector Information & United Kingdom Parliament, Companies Act 2006. Available at: http://www.opsi.gov.uk/acts/acts2006/ukpga_20060046_en_1
[Accessed April 6, 2010].
Ozkan, N., 2007. Do corporate governance mechanisms influence CEO compensation? An empirical investigation of UK companies. Journal of Multinational Financial Management, 17(5), 349-364.
Parrino, R., R.d W. Sias, and L. T. Starks, 2003. Voting with their feet: institutional ownership changes around forced CEO turnover. Journal of Financial Economics 68, 3-46.
Randøy, T. & Nielsen, J., 2002. Company Performance, Corporate Governance, and CEO Compensation in Norway and Sweden. Journal of Management and Governance, 6(1), 57-81.
Richardson, S. A., 2002, Corporate governance and over-investment of surplus cash, Working Paper, University of Michigan
Shin, J.Y., 2005. The Composition of Institutional Ownership and the Structure of CEO Compensation. SSRN eLibrary. Available at: http://ssrn.com/paper=639797 [Accessed April 2, 2010].
Shleifer, A. & Vishny, R.W., 1986. Large Shareholders and Corporate Control. The Journal of Political Economy, 94(3), 461-488. Studies 15, 289-318.
Smith, C.W. & Watts, R.L., 1992. The investment opportunity set and corporate
financing, dividend, and compensation policies. Journal of Financial Economics, 32(3), 263-292.
Svenska Dagbladet, E24 Näringsliv. (2007). Svenska styrelsearvoden i botten.
http://www.e24.se/dynamiskt/sverige/did_15043802.asp [Accessed April 10, 2010].
Swedish Corporate Governance Board. 2010 a. Nomination Committees in Swedish Listed Companies. [Online]. Available at:
http://www.corporategovernanceboard.se/media/15381/nomination%20committees%20in
%20swedish%20listed%20companies%20-%20artikel%20i%20icgn%20yearbook%202008.pdf
Swedish Corporate Governance Board. 2010 b. The Swedish Corporate Governance Model. [Online]. Available at:
http://www.corporategovernanceboard.se/media/28166/the%20swedish%20corporate%2 0governance%20model%20-%20article%20in%20the%20iod%20handbook%202009.pdf
Toyne, M.F., Millar, J.A. & Dixon, B.L., 2000. The relation between CEO control and the risk of CEO compensation. Journal of Corporate Finance, 6(3), 291-306.
Useem, M., 1999. Investor Capitalism: How Money Managers Are Changing the Face of Corporate America. New York: Basic Books.
Zhou, X., CEO Pay, Firm Size, And Corporate Performance: Evidence From Canada.
SSRN eLibrary. Available at: http://papers.ssrn.com/sol3/papers.cfm?abstract_id=238659