52
ECOLOGICAL TECHNOLOGY AND MANAGEMENTKALMAR. SWEDEN. September 22-24, 1 999
URBAN METAL METABOLISM
Bo Bergbdck
University of Kalmar, Sweden
AbstractThere is an urgent need of comprehensive studies of total flow and accumulation of metals in the anthroposphere to assess present and future risks in urban areas. Here a case study of Stockholm is presented. The administrative boarder of Stockholm City was chosen as spatial system boarder. The work focused the urban metabolism of the metals cadmium (Cd), chromium (Cr), copper (Cu), lead (Pb), mercury (Hg), nickel (Ni) and zinc (Zn). This includes calculation of metal flows and stocks in various goods for different time periods. Further, emissions from these goods to the environment have roughly been calculated.
It is possible to reconstruct the stock of goods even for a long time period. Here we have shown that the accumulation of metals in goods is most extensive. The emissions from the anthroposphere of Stockholm are so far small in relation to the stock. Thus, most environmental concern should be directed to manage the stock in order to minimise future environmental impact. Further, older areas of use often dominate the stock for goods with a long "life expectancy". Some of the goods, e.g. "dead cable", are today forgotten, and the responsibility for the good is unclear. This approach gives possibilities for pre early recognitions which is more pro active instead of re active.
Introduction
The enormous variety of chemicals used during the last century has resulted in large amounts of "metabolites" in the anthroposphere, especially in urban areas. However, the present knowledge of accumulated amounts of metals in the infrastructure of urban areas is limited. Studies have been performed of metal flows through e.g. households, local industries and sewage treatment plants. Obviously, to assess present and future risks in urban areas there is an urgent need of comprehensive studies of total flow and accumulation of metals in the anthroposphere. Further, methods to estimate the rate and magnitude of the dissipative losses from various goods to the biosphere must be developed.
The Swedish Environmental Protection Agency (SEPA) performed a research program "Metals in urban and rural areas - ecocycles and critical load" in the time period 1 994 -99. The objectives of the research activities were to provide a scientific basis for evaluating the present state of the environment, future risks and the need for remedial measures. The research was done as a case study covering the flows and accumulation of heavy metals from 1 900 up to
Bo Bergback, Sweden 433
ECOLOGICAL TECHNOLOGY AND MANAGEMENT KALMAR, SWEDEN, September 22-24, 1999
1995 in the anthroposphere of the Swedish capital Stockholm. The administrative boarder of Stockholm City was chosen as spatial system boarder. The work focused the urban metabolism of the metals cadmium (Cd), chromium (Cr), copper (Cu), lead (Pb), mercury (Hg), nickel (Ni) and zinc (Zn). This includes calculation of metal flows and stocks in various goods for different time periods. Further, emissions from these goods to the environment have roughly been calculated. Finally, these emissions were analysed in relation to present metal flows in storm water, sewage water etc. and to present metal stocks in soils and sediments. Methodology/ Approach
Stockholm is divided and surrounded by water. To the west of the city lies Lake Malaren, Sweden's third largest lake, which discharges into the Baltic Sea east of Stockholm via the central parts of the city, mainly through a short river ( Norrstrom). Stockholm is densly populated with approximately 700 000 inhabitants in an area of 190 km2 . ln I 995 there were 711 1 19 inhabitants in Stockholm city, corresponding to 8.0% of the Swedish population. i.e. close to the average part of the Swedish population for the 20th century.
In order to map the flows and stocks of heavy metals in the anthroposphere of Stockholm, data has been collected for total amount of metal used during the 20th century, total amount used today and finally, the present net inflow. Official statistics on a national, regional and local level were used and contacts were established with industrial/sector representatives from production/ construction/ authorities in order to calculate flows and stocks of the different metals. The number of information sources and the total data presented constitute a most comprehensive data base. For details, see Lohm et al. (1996 and 1997). Thus, data has been collected for: total amount of metal used during the 20th century, total amount used today and the present net inflow.
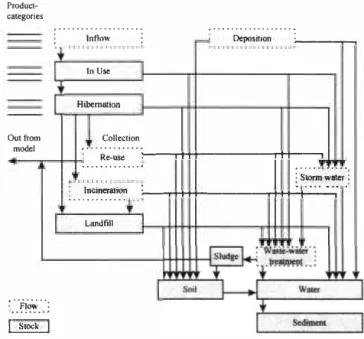
In the second part of the project, flow schemes and a flow model (figure I ). that synthesise flows and stocks in the anthroposphere were constructed. The model serves as an interface to the metal data, allowing e.g. graphic display, overview and simulation. Hence the model is based on concepts which is familiar to e.g. a decision maker, and it is intended to be useful in educational context.
: _. --��
:_-}!��----;
ECOLOGICAL TECHNOLOGY AND MANAGEMENT KALMAR, SWEDEN, September 22-24, 1999
Product categories
. . .
.
.
.. . .
.. . .
.
,... .
.
lntlow.
: •.
°"position.
In Use Hibernation Out from Collectionmodel ,
...
,. �-,ttt---rt-t---, Rc--=usc:...
,... .
: Stormwater : Incineration _: --rt-tt--t---T+t+---i. ,...··_·_····- · --. � . . . . LandfillI
StockI
Figure 1. Model structure.
The upper left part is related to the use of goods, the lower left part the management of wasted goods and the right part corresponds to leakage of metals during use and waste management. The definitions of the sub-processes are as follows:
Inflow. Flow of different kinds of goods containing heavy metals to the urban region, i.e. Stockholm city. Only the quantity of goods used in the region will be considered. E.g. a power cable imported to a dealer in the city to be cut, re-packed and sold in smaller quantities to customers outside the region is not included.
In use. The stock of a good which provides the service it is made for. The use may generate an emission of heavy metal.
Hibernation. The stock of a good which no longer provides the service it is made for. E.g. a cable which is no longer in use but still left in the ground will be considered as hibernating. Hibernation may also generate an emission of heavy metals. Hibernation may be subject to a considerable uncertainty, since all goods that "disappear" out of control are considered to be in Hibernation (i.e., all that is no longer In use and is not transferred to Collection).
Re-use. Flow of goods out of the scoop of model, i.e. goods that are not anymore considered to be a part of the consumption process within Stockholm city. Re-use means additional use of the used goods, or additional use of the substances in the goods. The management may generate an emission. Re-used amounts may be re-input again via Input as new goods. Incineration. An important part of the waste management is incineration, often utilising the energy in wasted goods for co-generating electricity and heat. Ashes from the incineration
ECOLOGICAL TECHNOLOGY AND MANAGEMENT KALMAR, SWEDEN, September 22-24, 1999
plants are deposited in landfills. At incineration the energy in the wasted goods is "re-used". Also this management may generate an emission.
Landfill. When having reached the landfill, the metal has reached its lowest societal value in the consumption process and is not anymore subject to human activities such as utilising, intermediate storage, transports or refining. In the society's perspective this is the "end station" of goods, however emissions may occur.
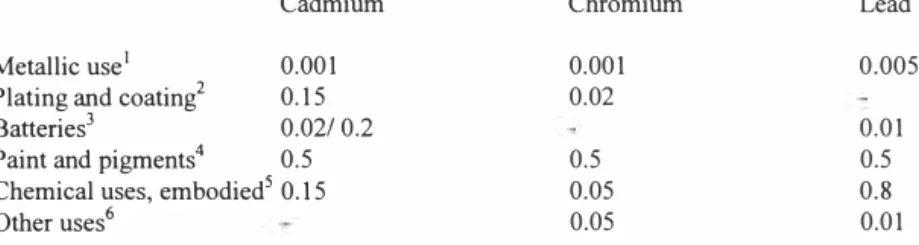
Consumption emissions of metals from the use of various goods may be calculated by the model. Here, a simple approach with emission factors mainly from Tarr & Ayres (1990) and the net inflow of a metal to the anthroposphere per time period has been used. These emission factors give the proportion of a metal in a specific good that will be released into the environment within a decade. In this study, a delay time of 10 years has been used for all type of goods except in case of direct emissions, e.g. lead from petrol. Obviously, this is a simplification as the release from a good often is slow and may go on for more than one decade. As an example, consumption emission factors for Cd, Cr and Pb are given in table 1.
Table 1. Consumption related emission factors for cadmium, chromium and lead (cf Tarr & Ayres, 1990).
Cadmium Chromium Lead
Metallic use' 0.001 0.001 0.005 Plating and coating2 0.15
Batteries3 0.02/ 0.2
Paint and pigments4 0.5
Chemical uses, embodied5 0.15
0.02 0.5 0.05 0.01 0.5 0.8 Other uses6 0.05 0.01
1. For Cd and Cr in alloys. For lead also as pure metal. Losses can be assumed to be due primarily to wear and corrosion.
2. Protective surfaces deposited by dip coating, e.g. electroplating or chemical bath. Losses in use are mainly due to wear and abrasion or flaking.
3. Includes lead coated cables. Discarded equipment goes mainly to landfills or incinerators. Lead batteries and the pocket type of nickel-cadmium batteries are recycled to a much higher degree than the sintered plate type of nickel-cadmium batteries.
4. Paints and pigments are lost primarily by weathering (e.g. for metal-protecting paints), by wear, or by disposal of painted dyes or pigmented objects. Lead oxides have been considered to be extra resistant (emission factor 0.1). A factor of0.5 is rather arbitrarily assumed for all other paints and pigments.
5. Chemical uses embodied in final products: fuel additives (Pb), stabilisers (Cd) in plastics and chromium salts embodied in tanned leather.
6. Ayres gives a higher factor (0.15) for all metals. Here smaller factors have been used in order not to overestimate this relatively uncertain contribution.
ECOLOGICAL TECHNOLOGY AND MANAGEMENT KALMAR, SWEDEN, September 22-24, 1999
Note that calculated consumption emissions per decade from specific goods, represent the total amount of metal ever released from this specific use. Clearly, these calculations are most uncertain and the results give more a hint of the magnitude of potential emissions from goods.
Main results obtained
Results from the use of the data base and the flow model are here briefly presented. For a more detailed presentation of the data base Stockhome - see Lohm et al. ( 1997) and the EU case study report "Metals in Stockholm" (Lohm et al., 1998).
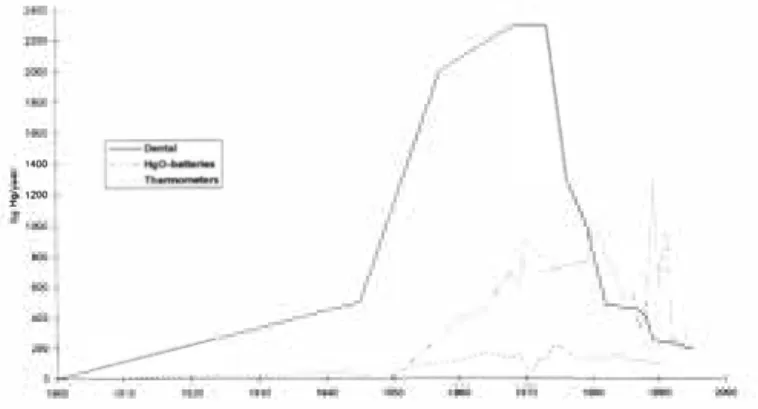
For some metals, e.g. cadmium, lead and mercury, the statistical sources of historical consumption allow us to follow the development over time for the 20th century. For other
metals, e.g. chromium, copper and zinc, the historical consumption has been roughly estimated. Some examples are shown in figures 2-3.
""
r'""'
Fig. 2. Consumption of Hg (kg/year) in Stockholm for major uses, 1900-1995. ID Sintered plate batteries
10000 9000 □ Jungner batteries 8000 ■ Plating 7000 CJ Stabilizers 6000 5000 ■ Pigments 4000 3000 2000 1000 0
"'
"'
"'
"'
"'
"'
0 :is"'
g
0 ,._ ,._ 0 co co 0"'
"'
'3, � � � � � � � � � � �Fig. 3 .. Consumption of Cd (kg/year) in Stockholm for major uses 1940-1995.
ECOLOGICAL TECHNOLOGY AND MANAGEMENT KALMAR, SWEDEN, September 22-24, 1999
The stock of metals in Stockholm has been calculated, see table 2
ECOLOGICAL TECHNOLOGY AND MANAGEMENT KALMAR, SWEDEN, September 22-24, I 999
Table 2. Stock 1995 (tonnes or kg/capita) and inflow 1995 (tonnes/year or kg/capita and year) of metals in the anthroposphere of Stockholm.
Stock, J 995 (tonnes) Stock, 1995 inflow 1995 Inflow 1995
(tonnes (k, lea ita)
Mercury 7 0.01 0.5 0.001 Cadmium 120 0.2 9 0.01 Nickel 2 500 4 190 0.3 Chromium 5 500 8 350 0.5 Zinc 29 000 40 1 900 3 Lead 47 000 65 1 500 2 Co er 120 000 170 1 500 2
Every metal stock has also been divided into different categories - sector of use (household, infrastructure, buildings, vehicles, industry) and degree of exposure ( air, water, soil, protected).
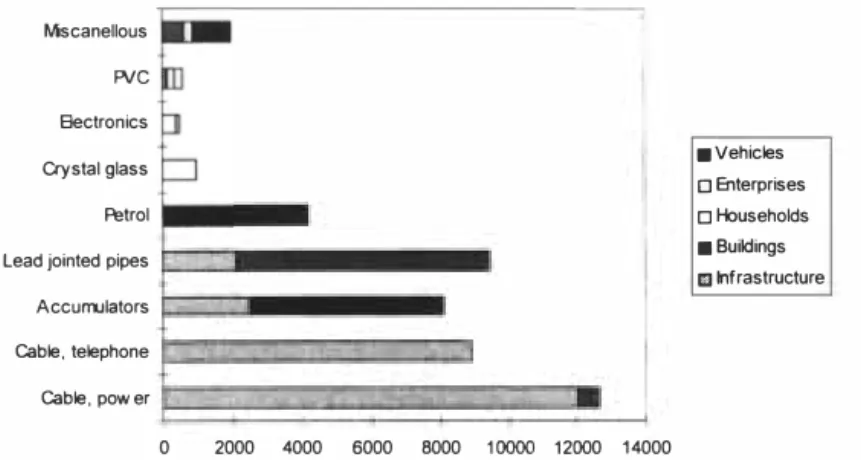
For lead, nearly 50 000 tonnes are in use today in various goods. Approximately 40 000 tonnes are exposed to corrosion in a varying degree. For the other metals the corresponding figures are - cadmium 120/40, copper 120 000/40 000, chromium 5500/2500, nickel 2500/700 and zinc 30 000/20 000. A mercury stock of 7 tonnes is totally dominated by the use of dental alloys.
As an example, the distribution of lead in some goods on different sectors of use is shown in
figure 4. As a comparison, the total amount of lead in petrol, consumed during the 20th
century in Stockholm and now accumulated in soils/sediments, has been included.
Mscanellous FVC Bectronics ■vehicles Crystal glass D Enterprises Petrol o Households ■ Buidings
Lead jointed pipes
!!ii Infrastructure
Accurrulators Cable, telephone Cable, pow er
0 2000 4000 6000 8000 1 0000 12000 14000
Figure 4. Stock of lead (tonnes) in various goods, Stockholm /995 distributed different sectors.
ECOLOGICAL TECHNOLOGY AND MANAGEMENT KALMAR, SWEDEN, September 22-24, I 999
From the Pb inflow per time period the consumption emissions from various goods were calculated. For lead, the emissions from consumption of leaded petrol were dominant for the 1960s - 1980s. However, these emissions excluded, the contributions from other goods are better elucidated, see figure 5.
Eml11lon1
.,...,,.-(1!1
L
1---r-r--
1
-0.18 0.14 <e 0.12 0.16� I I 1 J lJI
m���•-{; 0. 1 O Tube Md pipe joints
□Pv'C j 0.08
■ Building preserve.tive
0.06 ■Public
0.04
D Household & hobby 0.02
year 1980 1990
Figure 5. Calculated consumption emissions of lead from different goods (kg/year and
capita), Stockholm 1900-1995. Eml11lon■
n
-r--·
0.02_,..,, \l
-0.018 0.0160.01◄ m Cable Power & phone
■ Accumulctors
0.012
{; □ Tube and pipe joints
j
0.01 mPv'C0.008 ■ Building preservative
■ Public 0.006
a Vehides & boats
0.004 □ Household & hobby
0.002
1980 1990
(Lead in petrol excluded)
Figure 5, continued. Calculated consumption emissions of lead from different goods (kg/year and capita), Stockholm 1900-1995.
ECOLOGICAL TECHNOLOGY AND MANAGEMENT KALMAR, SWEDEN, September 22-24, 1999
Obviously. the consumption emissions from goods with a long life-time, e.g. lead-shielded cable. will continue to release lead even after 10 years. Thus, the emissions in the 1990s from cables are not zero as indicated in figure 5. However, our model is also prepared for a more sophisticated approach for calculation of consumption emissions. Data is available for the parts of the stock that are exposed to different corrosive environments, i.e. exposed to corrosion in water, soil or atmosphere. The part of the stock that is protected to corrosion, mostly indoor goods, is also given in the data base. From the amount (or surface area) of a specific good in a specific environment, the consumption emission may then be calculated by empirical corrosion factors. These factors are now being developed by the Swedish Corrosion Institute in long time exposure experiments.
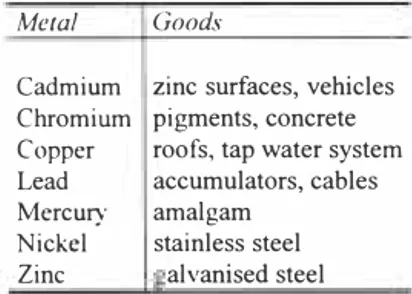
From the simplified method of calculation, given by Ayres, indications of major emission source� per metal may be given as a first approximation, see table 3.
Table 3. Major sources.for consumption emissions from metal containing goods. Metal Goods
Cadmium zinc surfaces, vehicles Obviously, the focus should be on goods
Chromium pigments, concrete with a large stock e.g. zinc surfaces, copper
Copper roofs, tap water system in roofs/ tap water systems or lead in
Lead accumulators, cables cables. But, even a minor stock will be of
Mercury amalgam prime environmental importance if the
Nickel stainless steel "emission/ corrosion factor" indicates a
Zinc alvanised steel high release per unit, e.g. chromium
pigments. Discussion and conclusions
In Stockholm. high, sometimes extremely high, concentrations of cadmium, lead and mercury have been found in sediments, soils and ground waters (Bergback & Johansson, 1996). With
the data base/ flow model approach there has been an intensive co-operation with the Local
Environmental Government in Stockholm and with the Swedish Environmental Protection Agency. From this work it can be concluded:
It is possible to reconstruct the stock of goods even for a long time period. Here we have
shown that the accumulation of metals in goods is most extensive. The emissions from the anthroposphere of Stockholm are so far small in relation to the stock. Thus, most
environmental concern should be directed to manage the stock in order to minimise future
environmental impact. Further, older areas of use often dominate the stock for goods with a long "life expectancy". Some of the goods, e.g. "dead cable", are today forgotten, and the
responsibility for the good is unclear. This approach gives possibilities for pre early
recognitions which is more pro active instead of re active.
ECOLOGICAL TECHNOLOGY AND MANAGEMENT KALMAR, SWEDEN, September 22-24, 1999
In the discussions mentioned above, the need of a data base that could be generalised to other urban areas was stressed. Obviously, this generalisation is a prerequisite to include the Hinterland, both in terms of emissions (drainage areas, sewage treatment plants and waste) and metal resources.
There was also an agreement that environmental indexes could be extracted from the data base/ model. These indexes should be based on the use of material rather than based on the state of the environment. So far, the model gives management of metal-containing goods in individual or collective responsibilities. However, this could easily be extended to e.g. responsibilities for different branches or the private sphere contra public services. For example, a typical question for the Local Environmental Government in Stockholm to address is how to give licence for demolition work.
Through the data base and the model, anthropogenic metal flows/ stocks can be analysed in relation to natural flows/stocks in order to answer questions like What goods can/must be accepted per metal?
What recycling rates must be achieved in order not to exceed natural flows?
Thus, with these tools, there are possibilities to assess metal flows and stocks in the anthroposphere in relation to corresponding flows/stocks in the environment. This gives a platform for early recognition of future problems of environmental loadings and to set priorities/ define measures to protect the environment in urban areas.
However, materials flow analysis (MFA) is not only a policy tool for environmental protection but also a most useful platform for sustainable resource management. Due to metal ore depletion and the high energy consumption of primary production, recycling of accumulated amounts of metals in urban areas becomes increasingly interesting. Obviously, the extraction cost of metals in various applications must be limited in relation to metal market price. In figure 6 roughly estimated extraction costs for lead in some goods have been plotted against the accumulated amounts in the anthroposphere of Stockholm. According to this example, more than 30 000 tonnes of Pb could be "mined" from the anthroposphere. However, today only IO 000 tonnes are profitable to extract.
ECOLOGICAL TECHNOLOGY AND MANAGEMENT KALMAR, SWEDEN, September 22-24, 1999
"'
f"
Urban mining -,:ample Pb Wlls\e"'1tler plpe joint$ buildings P- cable SU1lmEne1VY 20000.
I-Figure 6. Assumed extraction cost (monetary units/tonnes) and accumulated amounts (tonnes) for some goods in the anthroposphere of Stockholm. Goods below market price could be
subject to urban mining
Our first analysis reveals that material flux studies allows for the inclusion of different management and policy approaches. From our study it is obvious that environmental issues cannot be fully understood if they are looked at in only an environmental perspective. MF A is an approach to overcome this. So fare the focus is usually on engineering or applied science but if organisational dynamics could be incorporated the MF A will become a very strong tool regardless which level it is applied.
ECOLOGICAL TECHNOLOGY AND MANAGEMENT KALMAR, SWEDEN, September 22-24, 1 999
References
Bergback, B .. Johansson, K. 1996. Metal/er i stad och land. Ldgesrapport 1996. Report 4677,
The Swedish Environmental Protection Agency. (In Swedish).
Lahm, U., Bergback, B., Hedbrant, J., Jonsson, A., Sonne, L. and Ostlund, C. 1996. Metal/ metabolism - analys av ackumulerad miljopaverkan i storstadsomraden. Report to the Swedish Environmental Protection Agency (In Swedish).
Lohm U .. Bergback B., Hedbrant J., Jonsson A. , Sviden J., Sonne L. & Ostlund C., 1997 . Databasen Stockhome. Floden och ackumulation av metaller i Stockholms teknosfiir. Terna V Rapport 25. Linkopings universitet. (In Swedish).
Lahm U, Bergback B, Hedbrant J, Jonsson A, Sviden J, Sonne Loand Ostlund C.,1998. Materials Accounting as a Tool for Decision Making in Environmental Policy - Mac TEmPo Case Study Report to the European Commisson - Metals in Stockholm. Department of Water and Environmental Studies, Linkoping University, Sweden
SEPA, I 994o. Metals in Urban and Forest Environment. Research programme l 994/95-1998/99. Swedish Environmental Protection Agency, Report 4435.
Tarr J. And Ayres R., 1990. The Hudson-Raritan Basin. In: Turner et al. (eds.). The Earth as Transformed by Human action. Cambridge University press, New York.