Smart Heat Grid on an Intraday Power Market
Christian Johansson
Blekinge Institute of Technology PO Box 214, SE-374 24
Karlshamn, Sweden
christian.johansson@bth.se
Fredrik Wernstedt
NODA Intelligent Systems AB Drottninggatan 5, SE-374 35 Karlshamn, Sweden
fredrik.wernstedt@noda.se
Paul Davidsson
Malmö University SE-205 06 Malmö, Swedenpaul.davidsson@mah.se
ABSTRACT
District heating systems (DHS) is in many countries an important part of the heating infrastructure, especially in and around urban areas. Combined heat and power (CHP) production makes it possible to producer heat while simultaneously producing power. This combination help maximize the energy efficiency in production, often reaching an 80-90% utilization level of the primary fuel, compared to around 30-50% in a traditional power plant. The heat produced in the CHP plant is used to heat the adjacent DHS, while the power is transferred and sold on the power market. The work presented in this paper relates to the Nord Pool Spot power market, which is the leading power market in Europe and one of the largest in the world. On Nord Pool Spot power is bought and sold based on hourly spot prices, facilitated by the primary day-ahead market and the supplementary balancing intraday market.
Since it isn’t possible to separate the physical process of producing heat and power in a CHP production facility, the energy company will want to synchronize high heat load production with high spot prices for power whenever possible. This can be done by using large storage tanks where heat is buffered during hours with high spot prices, while then distributed to the DHS as the heat load demand increases. However, such storage tanks are expensive to build and maintain, and they have limited operational dynamics. An alternative is to use the actual buildings connected to the DHS, in order to utilize their thermal inertia by the use of active load control.
This paper presents a multi-agent system (MAS) designed to bridge the information gap between energy companies and building owners in order to enable the use of system-wide active load control in order to synchronization heat load and spot prices. The presented scheme provides a self-regulating market analogy in which agents act to allocate load control resources. Each participating building is assigned a consumer agent, while each production unit is represented by a production agent. These agents interact on the market analogy which is in turn supervised by a market agent. The work in this paper is focused on the intraday market although the underpinning synchronization scheme is suitable for the day-ahead market as well as the intraday market. The results show considerable gains for participating entities when applying the presented strategy to the often volatile intraday spot price market.
Categories and Subject Descriptors
J.7 [Computer Applications]: Computers in other systems –
industrial control, process control.
General Terms
Management, Performance.
Keywords
Agent-based industrial applications, Smart Heat Grid, Combined Heat and Power
1. INTRODUCTION
This work concerns the ability to use active load control in district heating systems (DHS) in order to maximize revenue from the power market when using combined heat and power generation. A district heating system consists of one or more production plants connected to a distribution pipe network which in turn is connected to heat exchanger substations at consumer buildings. Normally water is used as the energy transfer medium within the pipes, although some older systems use steam. Production units can use more or less any available boiler types, as long as they are able to heat the water or steam to sufficient levels. This makes it possible to use a wide range of primary fuels such as coal, oil, biogas or nuclear power and even makes it possible to utilize low or medium grade energy carriers such as peat, different types of biomass or waste heat from nearby industries. District heating is the predominant heating type in urban areas in northern and eastern parts of Europe including Russia and former Soviet countries, although the technology is present all around the world and gaining increased acceptance throughout North America and Asia [1].
A combined heat and power (CHP) plant produces electrical power as well as heat for the DHS. In a CHP plant water is boiled to steam which is in turn overheated to about 500-600 °C. The steam is then used to run a turbine, which in turn is connected to a generator which converts the mechanical energy to electrical energy. When the steam has passed through the turbine its pressure and temperature is decreased in a condenser unit which absorbs the heat from the steam and transfers it to the water medium in the district heating system. The condensed water (previously steam) is then led back to the original boiler in which the process is repeated. In a normal power plant the heat is normally emitted as waste heat in the turbine/generator process. By instead utilizing this heat a CHP plant is capable of achieving higher levels of energy efficiency in relation to the primary fuel (80-90%) than traditional power plants (30-50%) [2]. CHP plants are common in many DHS and when building new production plants CHP is many times the preferred choice of production, since its efficient use of primary energy makes the system financially and environmentally sound.
The power produced in a CHP plant is normally sold on a regional, national or international power market. The work described in this paper is related to the Nord Pool Spot power market which covers large parts of Northern Europe and which is one of the largest power markets in the world. However, the basic premises are similar for most de-regulated power markets, in that the prices are set based on a balance between supply and demand.
The Nord Pool Spot market is divided into two separate market parts, namely the day-ahead market (Elspot) and the intraday market (Elbas) [3]. The larger of the two is the day-ahead market through which the majority of all power is being bought and sold. Here power contracts are made for delivery the following day. The contracts cover hourly spot prices throughout the next day, and are published on the afternoon the day before. In addition to this there is also an intraday market which supplements the day-ahead market by securing the balance between supply and demand. Traditionally the intraday market has been used as a balancing market mechanism in order to bridge specific incidents such as unplanned operational stops in nuclear power plants. However, as more wind power production enters the grid, the need for intraday balancing increases. Wind power is undeniably a sustainable and environmentally desirable production type, but it is also somewhat unpredictable. A growing percentage of sustainable power production will thus only increase the importance of the intraday power market. The very nature of the intraday market makes for a higher volatility in price compared to the day-ahead market. It is this characteristic that makes the intraday market enticing for power market actors which have the ability to dynamically adapt and conform to that same volatility. Load control is the ability to actively control the heat load in a DHS. This ability is what makes it possible for DHS operator to adapt to the changing conditions on an intraday market by dynamically rearranging the heat load demand among the consumer stations. A similar tool, albeit less flexible, is the use of storage tanks which can be charged and discharged according to changes in spot price instead of directly feeding the heat into the DHS. However, considering their limited operational dynamics, the use of storage tank based strategies is more suited for the day-ahead power market [4]. Load control in DHS can be implemented either actively or passively. Passive load control tries to influence the consumers to act in certain ways, through the use of indirect methods such as differentiating heat load- or flow rates. Such methods are not guaranteed to work, i.e. a consumer might willingly choose to ignore to adapt to current flow rates, or more likely, will not have the technical ability to do anything much the rate even if they wanted. Such methods are also much too inflexible for applications considered in relation to the dynamics of an intraday market. Active load control, on the other hand, provides a technical framework for performing instant heat load manipulation among the consumers.
Previous work has presented the basic centralized synchronization strategy for heat load and spot price management in relation to a basic day-ahead power market [5]. The work described in this paper follows on that previous work by expanding the problem domain to encompass the entire energy system from a multi-agent system (MAS) perspective. Also, the more volatile, and thus potentially more profitable, intraday market is considered. In addition to this the MAS approach provides a framework for compensating the active consumer systems in relation to their actual level of participation. The system is evaluated through simulation experimentation.
2. RELATED WORK
Different strategies for using heat storage in order to improve operations are presented in [6, 7]. The potential of using building mass as short term heat storage is quantified and described in [8]. Further work on thermal mass in buildings is presented in [9]. All these works show consistently that substantial amounts of energy
can be charged and discharged within the structure of individual buildings. In other words, due to the thermal inertia of buildings it is possible to manipulate the heat load demand of a building without affecting the indoor climate [10].
Active load control for individual buildings has been studied since at least the early eighties, although the technical constraints of the hardware of that time limited the practical use of such systems. However, even those early works recognized the potential of the basic load control technique [11]. The importance of two-way communication in order to enable feedback throughout the system was also early established [12].
The theoretical aspects of load control in district heating systems were studied in [13], while a real-time industrial load control system was implemented and evaluated in [14, 15]. Load control in electrical grids through the use of time-varying pricing is studied in [16]. It is concluded that direct load control, in the sense of technology able to response to the pricing scheme, is imperative in order to attain desirable levels of response.
The heating and cooling behaviour of buildings have been studied in many projects. Pre-cooling and demand limiting is studied extensively in [17, 18]. The studies conclude that it is possible to improve demand responsiveness while maintaining acceptable comfort conditions. Heating control strategies are studied in [19]. More adaptive learning algorithms for heating systems are presented in [20, 21]. The common denominator of these systems is that they all directly or indirectly make use of the thermal inertia of buildings in order to streamline the heating or cooling demand in buildings.
As the control strategies become increasingly complex the desire to continuously evaluate the resulting thermal behaviour will become more apparent. This can be done either by simulation, sensor readings or by a combination of the two. A study of how to model the heat dynamics in a building using stochastic differential equations from a simulation perspective is presented in [22]. The impact of using real-time sensory equipment is evaluated in [23]. A theoretical MAS platform for load control in district heating systems has been previously described in [24]. Such a system has since been implemented in a real-time industrial setting which was described in [25]. The implemented system confirmed that the system was able to perform continuous load control schemes corresponding to substantial amounts of the total heat load. Later experiments with the same type of system have shown even greater ability to perform load control [26].
The heat load in a DHS is mainly dependant on the outdoor temperature in combination with social behavior affecting tap water and ventilation. Several studies have been performed in regards to forecasting this behavior. Basic models relating to short-term heat load forecasting are presented in [27, 28]. A seasonal autoregressive integrated moving average (SARIMA) process is presented in [29], while basic Box-Jenkins autoregressive integrated moving average (ARIMA) methods are presented in [30]. Further studies of such methods are presented in [31]. A grey-box approach explicitly using climate measures to forecast heat consumption in a large geographical area is presented in [32].
3. MULTI-AGENT SYSTEM OVERVIEW
The general framework for the MAS consists of three different agent types interacting in order to achieve the overarching goal of
maximizing profits in relation to CHP production while simultaneously ensuring sufficient levels of Quality of Service (QoS) among the participating buildings. The consumer agent is the agent responsible for supervising and controlling the heat load at the individual consumer sub-stations. The producer agent calculates the need for active load control based on projections of the heat load demand in relation to current and future power spot prices. Finally the market agent is responsible for coordinating and allocating active load control among the consumer agent based on the requirements of the producer agent.
The different agents act according to their individual conditions and constraints, although they do hold certain knowledge in common throughout the MAS. The same weather forecast is normally shared among all the agents, although its perceived effect on the individual agents might differ. Historical data regarding the allocating process from the market agent is also freely available among the agents, as well as historical data regarding power market spot prices. Based on this it is possible for producer agents as well as consumer agents to calculate their own projections for spot prices and heat load demand, and hence devise strategies in order to further their individual goals. For a production agent this basically equates to selecting suitable valuation levels for load control and constructing allocation contracts considering an appropriate margin of error. Likewise, the goal for a consumer agent is to get paid as much as possible for performing current load control, while simultaneously maintaining a suitable preparation level for future load control and ensuring sufficient QoS.
3.1 Consumer Agent
The consumer agent (CA) is responsible for maintaining an acceptable level of QoS while at the same time performing load control. These aspects are interconnected since a CA uses its internal QoS status as measurement of load control ability, and can thus only perform load control if the current levels of QoS allow it. In the context of this work QoS is related purely to the indoor temperature. In order to calculate the indoor temperature the CA uses an energy balance model, which in its most fundamental form is shown in Equation 1.
∆
(eq. 1) where is the total heat load being input into the building, is the total amount of heat escaping the building. Any in-balance between these values will result in a non-zero ∆ , i.e. a change in the indoor temperature will occur. Such energy balance equations can be modelled arbitrarily complex. However, in order to adapt to limitations in the current hardware a model based on two temperature zones was developed. The model thus calculates one value for the indoor air temperature and one value for the average temperature of the climate shell of the building. Another issue with such energy balance models is that they tend to require a large amount of well calibrated parameters, especially in relation to the part of the equation, which is exactly what is to be avoided in order to keep the model simple enough to use in practical settings in many buildings. The presented model is built around a traditional heat balance model, although it has been adapted to avoid this very problem. This has been achieved by translating the heat load balance from a physical model into a black box simulation model, in which certain parameters do not
necessarily have any relation to actual physical counterparts. By locking parts of the equation and only letting certain parameters be variable it is possible to retain the characteristics of the original equation (calculating correctly), while simultaneously adding the previously lacking characteristics (ease of use). The resulting model is shown in Equation 2.
∆ ∆ 1.46 2 38.9 / 1 1000000 1.46 2 1.46 2 1 /45000000 (eq. 2) where , and are the indoor, building structure and outdoor temperatures. is the total heat load input into the building and is a state controlled adaptive variable used to adjust the behaviour of the model according to observations in regards to the recovery of temporary temperature fluctuations. The model is first and foremost designed to be used in relation to fast thermal processes; normally the temperature range is only a few degrees up and down and the simulation time frame at most a few hours. The steady state energy balance models which Equation 2 originates from are generally poorly equipped to handle such transient behaviour. Due to constraints in regards to computationally complexity the model is not able to explicitly take into account the dynamically differentiating influence of the different modes of heat transfer, i.e. conduction, convection and radiation. Another aspect is the free heat load input from social behaviour, electric appliances or from outdoor climate variations, which is normally modelled by adding stochastic variables. This is also not feasible due to the added complexity involved in such a solution. In order to still get a good approximation of the observed behaviour the value was instead added into the model. The variable can be seen as a catalyst which changes the speed of reaction within the thermal process. The variable can only take two values, i.e. 0 and 1. The state evaluation is performed according to equation 3.
, , 1 0
(eq. 3) where is the wanted indoor temperature, is the output indoor temperature and is the temperature offset produced by the heat load reductions in question.
In Equation 2 only two simulation parameters need to be set, i.e. the 1 and 2 values. These can be derived from the energy signature and the time constant of the building in question by using equation 2. In contrast, the original version of the energy balance model requires several more simulation parameters, such as the area of the building, mass of the building, average heat capacity of the building structure, air flow throughout the building, mass of air inside the building and so on. The range of parameters has now been reduced to only two parameters. Finding actual values for 1 and 2 involve performing successive runs of steady state situations using equation 2 in order to tune the values in relation to the desired time constant and energy signature values. However, in order to make the use of Equation 2 more convenient a selection of building templates with pre-set 1 and
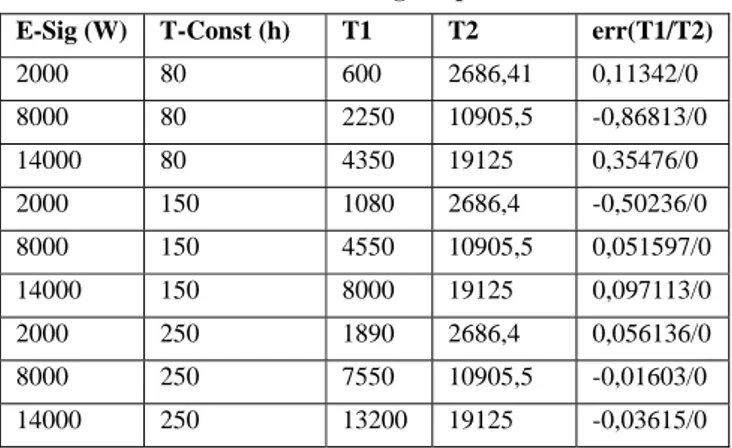
Table 1: Building templates
E-Sig (W) T-Const (h) T1 T2 err(T1/T2)
2000 80 600 2686,41 0,11342/0 8000 80 2250 10905,5 -0,86813/0 14000 80 4350 19125 0,35476/0 2000 150 1080 2686,4 -0,50236/0 8000 150 4550 10905,5 0,051597/0 14000 150 8000 19125 0,097113/0 2000 250 1890 2686,4 0,056136/0 8000 250 7550 10905,5 -0,01603/0 14000 250 13200 19125 -0,03615/0
The error column in Table 1 shows the errors in the 1 and 2 values. A value less than +/-1 is acceptable for 1 whiles the error for 2 should be zero.
In order to actually perform load control the consumer agent has to have the ability to influence the heat load in the consumer substation. In the proposed system this is done through the use of a Linux based computer I/O platform which is connected between the existing control system and the outdoor temperature sensor. By manipulating the signal from the outdoor temperature sensor it is possible to adjust the behaviour of the existing control system while performing load control, e.g. by temporarily telling the control system that it is warmer outside than it really is, the system will decrease its heat load. Figure 1 shows a screenshot from the graphical user interface (GUI) from the I/O platform, which displays an instance of load control being performed in a consumer substation.
Figure 1: Load control in consumer sub-station (C°)
The top line (blue) in Figure 1 shows the supply temperature in the radiator system of the building, while the second line from the top (orange) shows the return temperature in the radiator system. The third line from the top (brown) shows the indoor temperature. The fourth line from the top (purple) shows the difference between the supply and return temperature, which in combination with the current massflow of the fluid is a measurement of the energy being input into the building. The last two lines (green and red) show the actual outdoor temperature (red) and the manipulated outdoor temperature (green). Figure 2 shows the actual heat load reduction in kW from the same example as in Figure 1.
Figure 2: Load control in consumer sub-station (kW)
In Figure 1 and 2 it is clearly visible that the heat load is affected when load control is being performed. By only manipulating the outdoor temperature signal it is possible to install these types of systems relatively cheaply, since there is no need to change or re-configure the existing control system.
This same I/O platform also comes equipped with a module for wireless communication. This is used in a mesh network for wireless indoor temperature sensors, which provides real-time feedback to the CA. This data can then be correlated with the indoor temperature resulting from the energy balance model. The energy balance model is needed since actual indoor temperature sensors provide very random input caused by social behaviour. However, they do provide important statistical input for the CA in combination with the energy balance model.
3.2 Producer Agent
The goal of the producer agent (PA) is to synchronize heat load demand in relation to high spot prices, thereby increasing the earnings when selling electricity on the intraday power market. In order to do this the PA needs to first calculate projections concerning future heat load demand and spot price development. These projections range at most one or two days into the future. The heat load demand is mainly dependant on the outdoor temperature although daily variations due to social behaviour also heavily influence the total heat load demand. The spot price development is more volatile although power shortages, and thus high spot prices, tend to congregate in a way which lends itself to statistical analysis.
The forecasting is done using a seasonal autoregressive integrated moving average (SARIMA) process which uses a dataset of historical operational sensor data in order to forecast future values. This strategy can be used for forecasting future heat load as well as spot price behavior. The basic idea about these types of forecast models is that there is some correlation between historical and future behavior, which on a macroscopic level mostly holds true for the systems in question. The intraday market spot prices normally increase during times of high demand, which in turn is due to predictable behavioral processes in society and industry. However, the most volatile occasions on the intraday market is caused by non-predictable events, e.g. emergency shutdowns in major production units. Although such events are hard to predict, a CHP-based DHS with active load control capabilities would still be able to quickly adapt to the situation once it becomes known. Projecting the heat load demand in DHS is a major research field. Normally the heat load demand is formulated as shown in Equation 4.
Equation 4 says that the total head load demand, , is a combination of the heat losses in the distribution network, , and the combined heat load demand among all the customer sub-stations, . See related work for a full example of short-term heat load forecasting [29].
Using such projections of the heat load demand and the spot price development it is up to the PA to synchronize these. The goal of this process is to align the heat load demand with the high spot prices as far as possible. This is done by dividing the heat load demand into discrete parts and representing this in matrix form. Based on this it is then possible to find an optimal solution to the synchronization problem by solving Equation 5.
max ,
(eq. 5) where is a heat load matrix block and is a spot price array block. The cost function in Equation 5 maximises the total earnings from sold power. This function is subject to a range of constraints detailing the boundaries regarding the operational dynamics of the production units and the QoS among the participating consumer agents. The formal description of this optimization process along with simple examples is provided in previous work [5].
Using the result of this synchronization the PA will not only obtain the desired heat load profile, it will also learn the monetary value of implementing the specific solution. Hence it is possible for the PA to put a price tag on each load control request. This value is used as the maximum price a PA is willing to pay to the consumer agents for having this specific load control implemented. A total load control request is shown in the screenshot in Figure 3.
Figure 3: Load control request by a producer agent
Figure 3 shows load control requested by the producer agent. The top line (light grey) shows the actual outdoor temperature in the area, while the line second from the top (light green) shows the outdoor temperature forecast. The green line shows the heat load block while deviating from zero, while the red line at the bottom shows the total available heat load buffer among all participating consumer agents. The weather forecast in relation to clouds and sunshine is displayed at the top of the screenshot.
Based on the synchronization solution the PA then builds load control contracts. A load control contract specifies the size of the load control to be performed [W], the old spot [h], the new spot [h] and the maximum value for the spot expressed in a monetary
value. In regards to this all time values are in hours, i.e. a contract will always span one hour and the old and new spots refer to specific hours during the day.
The synchronization solution might specify that heat load demand should be moved both back and forth in during the day. This is accommodated in the contract structure by the old/new spot values. The old spot can be both before and after the new spot in time, although they must obviously always be in the future. This corresponds to charging and discharging the thermal buffer of the participating building structures. Figure 4 shows how heat load blocks are moved in order to synchronize with spot prices.
Figure 4: Discharging and charging of heat load blocks
Figure 4 shows discharging when moving a heat load block from A to B, in that the consumer substations first discharge while later charging the building structure. In this case a high spot price is expected in the B column. The second box shows charging when the heat load is increased during column D, and later decreased during column C. In practice the A block is moved to B, while C is moved to D.
3.3 Market Agent
The market agent (MA) acts as a mediating layer between the participating agents. When the MA receives a load control contract by a PA it will start first divide the heat load block into smaller slots. This is done since normally no single consumer agent will control a big enough thermal buffer to implement the entire load control block itself. Thus it has to be coordinated among a group of consumer agents, each one being allotted a single slot of the whole block (see Figure 5).
The MA will then allocate the slots among the consumer agents by using an auction process. A reverse Dutch auction is used in order to speed up the process. In a normal Dutch auction the seller will announce a starting price, and then continuously announce a lower price until a bidder will accept the price. Reversing this price is done by starting at a price close to zero and then continuously increasing the price until either a bidder accepts the price, or the price exceeds the maximum value set by the PA. The consumer agent who wins a slot will then get their heating bill lowered by the same amount as the winning price. After each auction the MA will publish the auction results.
4. EXPERIMENTAL SETUP
The system-wide behaviour is evaluated through simulation using DHEMOS, which is an agent-based district heating simulation platform. In addition to this certain key aspects of the system were studied in industrial installations using the previously mentioned I/O platform. The operational constraints of these systems were then used as parameters for the simulation experimentation. Different CHP system will have a different quota between produced heat and power. In this experiment we used 0.4 as quota, i.e. 0.4 MW power is produced for each MW heat produced. The operational data used in this study comes from the DHS of Landvetter Airport in Gothenburg, Sweden. The upper limit of the production unit is 8 MW, while the lower limit is set to 2 MW. Using a block size of 10% of the average heat load, this correlates to an upper limit of seventeen blocks and a lower limit of four blocks. The dynamic limit is five blocks, which means that the production cannot shift by more than five blocks from one hour to the next.
The consumer agents have a QoS limit of 0.5 °C, which means that the indoor temperature calculated by their internal energy balance model is not allowed to deviate more than 0.5 °C from the wanted indoor temperature. The wanted indoor temperature for all consumer agents is 21 °C in this study, but this can be set individually. In all there are twenty consumer agents in this system.
The optimization model was implemented using Octave 3.2.3, while the simulation experimentation used DHEMOS. Both systems were run on a Linux/Ubuntu 11.10 computer with Intel Core i5 CPU with 4 GB of RAM.
5. RESULTS
Figure 6 shows the projected heat load demand in the district heating system before and after the synchronization process.
Figure 6: Heat load demand, before (continuous) and after (dotted) synchronization
In Figure 6 it is clear to see were the high spot prices are occurring. This closely correlates to the data in Figure 7 showing the intraday spot prices.
Figure 7: Hourly spot prices on the intraday market
Figure 8 shows the indoor temperature according to the energy balance model in one of the participating consumer agents. It is clearly shown that the energy balance shifts as the consumer agent tries to match the charging and discharging requested by the producer agent.
Figure 8: Indoor temperature according to energy balance model
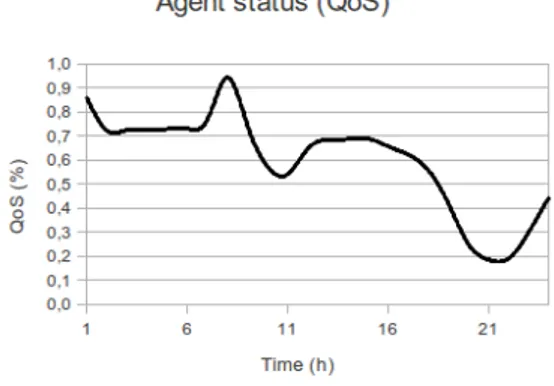
Figure 9 shows status of the same consumer agent in relation to its QoS level. A QoS level of 100% indicates an indoor temperature at the wanted level. Any deviation from this, up or down, will result in decreased QoS.
Figure 9: Agent status expressed in QoS
The gross financial earnings for the production agent in relation to selling electrical power were €835 in the reference case while being €1610 in the optimized case. The difference is €775. These earnings refer to one day of operation. The €775 is not a net profit for the production agent since it has to use part of this to pay consumer agents for performing load control. The amount required by the consumer agents is obviously dependant on the strategies involved, but during this study between 10-30% of the difference was used to pay consumer agents. The more consumer agents participating in the auction the less they will get for each load control slot, since competition among them tends to lower the price.
6. DISCUSSION
The dynamic behaviour shown here is not easily achievable for most other entities present on the power market, such as nuclear, wind or hydro power. Also CHP production is normally not a very large part of the total power production on a power market, e.g. in Sweden only about 5% of the total power production is generated through CHP. So even if all CHP plants would coordinate behaviour similar to that described in this paper, it would not be enough to upset the fundamental balancing market mechanisms. Even using a synchronization scheme such as the one proposed in this paper, it would probably not be preferable to commit all power production to the intraday market, since there is a chance that the market will be balanced due to the day-ahead market. Therefore a strategy which combines day-ahead and intraday power is advisable. The specifics of such a strategy, however, are outside the scope of this paper. Although, one might presume that such a strategy would have to take into consideration the composition and operational behaviour of the entire power market upon which it acts, e.g. a higher degree of wind power might imply a higher dependency on intraday market balancing. In this work we have used a reverse Dutch sealed-bid auction in order to allocate the heat load among the participating consumer agents. The reason for using an auction process to settle the load control allocation is that it cannot be certain that consumer agents are cooperative; in fact the opposite is most likely true most of the time. Therefore we must use some mechanism in order to separate the competing consumer entities. On the other hand, in an
all-cooperative energy system there would be no need for an auction process at all, since the optimal prices could be computed centrally as in [5]. Another good thing about this type of auction is that it strategically equivalent to a first-price sealed-bid auction, in that no relevant information is revealed during the auction process. This is advantageous in relation to the transparency and simplicity of the market agent. Technically there is no reason why any agent shouldn’t be able to perform the task of the market agent. In practice however, it might be desirable to have a stand-alone entity to handle the coordination and allocation of load control. In a de-regulated district energy market it is important that such components are transparent in order to create trust in their function. The individual consumer and production agents are then free to implement whatever strategy they deem prudent in order to further their individual goals. Also having a stand-alone market agent provides for competing groups among production agents in third-party-access networks or competing coalitions among consumer agents belonging to different building owners. There are obvious financial advantages in using such a system for energy companies as well as building owners. However, there is still a question of who should pay for the installation and operation of the hardware and software required to make it work. It might be argued that the energy company or distribution company should do this, since they would then be able to continuously amortize the cost by including this is the on-going valuation process when requesting heat load contracts. The system used in this study costs about €1000 to install per consumer sub-station, which in the DHS in question will lead to a cost of about €20000. Considering the potential earnings this is still amortized within one heating season.
7. CONCLUSIONS
In this paper we present and evaluate a framework for implementing basic smart heat grid technology in a district heating network. The system is evaluated through simulation experimentation based on operational constraints from an industrial installation. Models for all participating agent types are presented.
The results show obvious financial advantages when using this type of technology in district heating systems. It is also shown that these results are possible to achieve without jeopardizing the QoS among the participating consumer buildings.
Since the financial gain of this system is related to the spread between the highest and lowest spot prices it is convenient to use on an intraday market since these tend to be more volatile.
8. FUTURE WORK
Future work will involve tuning the participating agents in order to improve their strategies in relation to the auction and forecasting processes.
Another next step is obviously also to implement and evaluate similar behaviour on a system-wide scale in a real system. During 2012 such an installation will be done in the DHS from which we received the operational data used in the simulation experimentation for this study.
9. ACKNOWLEDGMENTS
Our thanks to Swedavia for letting us use operational data from the district heating system at Gothenburg Landvetter airport.
10. REFERENCES
[1] Constinesco, N. 2007. District Heating and Cooling: Country by Country, 2007 Survey. Euroheat and Power.
[2] Horlock, J.H. 2008. Combined Heat and Power. 2th ed. Pergamon Books Inc.
[3] Nord Pool Spot. 2012. Retrieved February 25, 2012, from http://www.nordpoolspot.com
[4] Andrepont, J.S. 2012. Thermal Energy Storage: Optimizing district heating systems in more ways than one. District Energy, First Quarter 2012. International District Heating Associaton.
[5] Johansson, C., Wernstedt, F. and Davidsson, D. 2012. Combined Heat and Power Generation using Smart Heat Grid. In Proceedings of the 4th International Conference on Applied Energy, Suzhou, China.
[6] Wigbels, M., Böhm, B. and Sipilae, K. 2005. Dynamic Heat Storage Optimization and Demand Side Management. ANNEX VII I 2005:8DHC-05.06. International Energy Agency.
[7] Rolfsman, B. 2003. Combined Heat and Power Plants and District Heating in a De-Regulated Electricity Market. Applied Energy 78 (2004) pp 37-52.
[8] Werner, S. and Olsson Ingvarsson, L. 2008. Building mass used as short term heat storage. In Proceedings of the 11th International Symposium on District Heating and Cooling. Reykjavik, Iceland.
[9] Hietmaäki, T., Kuoppala, J.M., Kalema, T. and Taivalantti, T. 2003. Thermal Mass of Buildings – Central researches and their results. Tampere University of Technology, Instititue of Energy and Process Engineering. Report 174. Tampere, Finland.
[10] Concrete for Energy Efficient Buildings – The benefits of thermal mass. 2007. Irish Concrete Federation Ltd.
[11] Österlind, B. 1982. Effektbegränsning av fjärrvärme. Rapport 63:1982, Byggforskningsrådet, ISBN 91-540-3714 (in Swedish).
[12] Österlind, B. 1990. Avläsnings- och kontrollsystem för fjärrvärmenät. Rapport 85:1990, Byggforskningsrådet, ISBN 91-540-5254-8 (in Swedish).
[13] Sipilä, K. And Kärkkäinen, S. 2000. Demand Side Management in District Heating Systems. Euroheat and Power – Fernwärme International, Vol. 3, p. 36-45. [14] Wernstedt, F. and Johansson, C. 2009.
Demonstrationsprojekt inom effect- och laststyrning. Report 2009:26, The Swedish District Heating Association (in Swedish).
[15] Wernstedt, F., Johansson, C. and Wollerstrand, J. 2008 Sänkning av returtemperaturer genom laststyrning. Report 2008:2, The Swedish District Heating Association (in Swedish)
[16] Newsham, G.R. and Bowker, B.G. 2010. The effect of utility time-varying pricing and load control strategies on
residential summer peak electricity use: a review. Energy Policy, 38, (7), pp. 3289-3296
[17] Xu, P., Haves, P., Piette, M. and Zagreus, L. 2006. Demand Shifting With Thermal Mass in Large Commercial Buildings: Field Tests, Simulations and Audits. Pier Final Project Report, California Energy Commission.
[18] Braun, J.E. 2003. Load Control Using Building Thermal Mass. Journal of Solar Energy Engineering, Vol 125, pp 292-301
[19] Björsell, N. Control Strategies for Heating Systems. Contract 8323P-95-02687, The National Board for Industrial and Technical Development.
[20] Rogers, A., Maleki, S., Ghosh, S. and Jennings, N.R. 2011. Adaptive Home Heating Control Through Gaussian Process Prediction and Mathematical Programming. Second International Workshop on Agent Technologies for Energy Systems, Taipei, Taiwan.
[21] Chahwane, L., Stephan, L., Wurtz, E. and Zuber, B. 2011. On a Novel Approach to Control Natural and Mechanical Night Ventilation. In Proceedings of Building Simulations. 12th Conference of International Building Performance Simulation Association, Sydney, Australia.
[22] Andersen, K.K., Madsen, H. and Hansen, L.H. 2000. Modeling the heat dynamics of a building using stochastic differential equations. Energy and Buildings, Vol. 21, pp 13-24.
[23] Johansson, C., Wernstedt, F, and Davidsson, P. 2010. A Case Study on Availability of Sensor Data in Agent Cooperation. Computer Science and Information Systems, Vol. 7, No 3. [24] Wernstedt, F., Davidsson, P. and Johansson, C. 2007.
Demand Side Management in District Heating Systems. In Proceedings of Sixth International Conference on Autonomous Agents and Multiagent Systems (AAMAS), Honolulu, Hawaii.
[25] Johansson, C., Wernstedt, F. and Davidsson, P. 2010. Deployment of Agent Based Load Control in District Heating Systems. First International Workshop on Agent Technologies for Energy Systems, Toronto, Canada. [26] Johansson, C. 2010, Towards Intelligent District Heating,
Licenciate Thesis, Blekinge Institute of Technology. [27] Jonsson, G. 2002. A model for predicting the yearly load in
district heating systems. In Proceedings of the Institution of Mechanical Engineers, Part A: Journal of Power and Energy 216, pp 277-281.
[28] Dotzauer, E. 2002. Simple model for prediction of loads in district heating systems. Applied Energy 73, pp 277-284. [29] Grosswindhager, S., Voigt, A. and Kozek, M. 2011. Online
Short-Term Forecast of System heat Load in District Heating Networks. In Proceedings of the 31st International
Symposium on Forecasting, Prag, Czech Republic. [30] Box, G.E.P and Jenkins G.M. 1991. Time Series Analysis.
Prentice Hall.
[31] Chramcov, B., Dostal, P. and Balate, J. 2009. Forecast model of heat demand. In Proceedings of the 28th International Symposium on Forecasting, Hong Kong, China. [32] Nielsen, H.A. and Madsen, H. 2006. Modeling the heat
consumption in district heating systems using a grey-box approach. Energy and Buildings, Vol. 38, pp 63-71