Faculty of Technology and Society Computer Engineering
Bachelor Thesis
Real time location system for indoor environment
Real tid lokalisering system för inomhus miljö
By
Gustav Dahlman
Johan Omara
Exam: Bachelor of Science in Engineering in Computer Science 180hp
Area: Computer Science
Date for examination: 28-05-2019
Supervisor: Reza Malekian Examiner: Yuji Dong
Sammanfattning
Fältet inomhuspositionering är en viktig och stor front och är i fortsatt och snabb utveckling in-om IoT-teknik och digitalisering av storstäder. Detta arbete är utformat för att hitta och bygga en lämplig teknik för att komprimera olinjäriteter från multipatutbredning. I denna uppsats un-dersöks olika lokaliseringstekniker och metoder genom en litteraturstudie. Baserat på resultatet av litteraturstudien och en given uppsättning krav designas och implementeras en prototyp. Det resulterande systemet är baserat på UWB-teknik med hjälp av TWR, trilateration och ett kalman-filter. Prototypen testas i olika miljöer. Resultaten visar att systemet kan detektera taggen i LOS förhållanden samt klara av visa NLOS förhållanden med en noggrannhet på mindre än 1m respek-tive 4m. Dessa tester inkluderar både distans mätning (1D) och position mätning i ett plan (2D). Dessutom diskuteras en del om hur man ökar prototypens prestanda.
Abstract
The field of indoor positioning is an important front and in fast and rapid development as the rise of IoT and digitization of big cities. This work is designed to find and build an appropriate technology to compact nonlinearities from multipath propagation. In this paper various available localization-technologies and methods are examined through a literature study. Based on the result of the literature study and a given set of requirements, a prototype is designed and implemented. The resulting system is based on UWB technology using TWR, trilateration and a kalman filter. The prototype is tested in various different environments. The results show that the system is able to successfully locate an object while fulfilling the requirements of this work. Additionally, some ideas on how to increase the performance of the prototype is discussed.
Acknowledgements
We would like to give special thanks to our supervisor Reza Malekian for guiding us throughout this project. We would also like to thank our teacher Magnus Krampell who has been very sup-portive and provided valuable input for our thesis. We would also like to thank our examiner Yuji Dong for giving good criticism about our work.
Innehåll
1 Introduction 1 1.1 Background . . . 1 1.2 General problem . . . 1 1.3 Specific problems . . . 2 1.4 external requirements . . . 2 2 Theory 3 2.1 Multipath propagation . . . 3 2.2 Technologies . . . 3 2.2.1 Bluetooth . . . 32.2.2 Bluetooth low energy . . . 4
2.2.3 Wi-fi . . . 4
2.2.4 Ultra Wide Band . . . 4
2.2.5 ZigBee . . . 5
2.2.6 RFID . . . 5
2.2.7 Ultrasound . . . 6
2.3 Range and Angle measurement techniques . . . 6
2.3.1 RSSI . . . 6
2.3.2 Time of arrival . . . 6
2.3.3 Time difference of arrival . . . 7
2.3.4 Two way ranging . . . 7
2.3.5 Angle of arrival . . . 8 2.4 Localization techniques . . . 8 2.4.1 Trilateration . . . 8 2.4.2 Triangulation . . . 9 2.5 filter . . . 9 2.5.1 Fingerprinting . . . 9 2.5.2 Kalman filter . . . 10 2.5.3 Monte-carlo localization . . . 11 2.6 Hardware . . . 12 2.6.1 Antenna . . . 12 2.6.2 DecaWave DWM1001 . . . 12 3 Related works 13 3.1 “Development of an UWB Indoor 3D Positioning Radar with Millimeter Accuracy” 13 3.1.1 Comments . . . 13
3.2 “Comparison and analysis of indoor wireless positioning techniques” . . . 13
3.2.1 Comments . . . 13
3.3 “Indoor performance analysis of LF-RFID based positioning system: Comparison with UHF-RFID and UWB” . . . 14
3.3.1 Comments . . . 14
4 Method 15 4.1 Construct a Conceptual Framework . . . 15
4.2 Develop a System Architecture . . . 16
4.3 Analyze and Design the System . . . 16
4.4 Build (Prototype) the System . . . 16
4.5 Observe and evaluate the System . . . 16
5 Result 17 5.1 Construct a conceptual framework . . . 17
5.1.1 Problem-tree . . . 19
5.1.2 Literature study . . . 21
5.2 Develop a system architecture . . . 23
5.2.1 System logical view . . . 23
5.3 Analyze and design the system . . . 24
5.3.1 Ranging technology . . . 24
5.3.2 Communication . . . 24
5.3.3 Hardware . . . 24
5.3.4 Filtering . . . 25
5.3.5 GUI . . . 26
5.4 Build(prototype) the system . . . 27
5.4.1 System overview . . . 27
5.4.2 Positioning system . . . 28
5.4.3 Android Application . . . 28
5.5 Observe and evaluate the system . . . 29
5.5.1 LOS ranging . . . 29 5.5.2 NLOS ranging . . . 30 5.5.3 LOS localization in 2D . . . 34 5.5.4 NLOS localization in 2D . . . 37 5.5.5 Real-time tracking in 2D . . . 39 6 Analysis 41 6.1 LOS ranging 1D . . . 41 6.2 NLOS ranging . . . 42 6.3 LOS localization in 2D . . . 42 6.4 NLOS localization in 2D . . . 42
6.5 Real time tracking . . . 42
8 Conclusions and future work 43
8.1 Answering the research questions . . . 43
8.1.1 RQ1.1 . . . 43 8.1.2 RQ1.2 . . . 43 8.1.3 RQ1.3 . . . 44 8.1.4 RQ1 . . . 44 8.2 Future work . . . 45
Figurer
1 The Figure shows the call process for device synchronization and time stamp of a tag (t1, t2, t3), and an anchor(a1, a2, a3) in TWR . . . 82 System overview and problem domains . . . 18
3 Overview over the main subproblems or a RTLS . . . 19
4 scale=0.70 . . . 20
5 System architecture . . . 23
6 System logical view . . . 23
7 Activity diagram of the android app . . . 27
8 An overview of the whole system . . . 28
9 Caption . . . 29
10 Map of the tested area (A represents the anchor location and the Ts represent the tested tag locations). . . 30
11 Table showing the results of the LOS ranging test (units in millimeters). . . 30
12 Map of the tested area (A represents the anchor location and the Ts represent the tested tag locations) . . . 31
13 Table showing the result of the test(units in meters) . . . 31
14 Map of the tested area (A represents the anchor locations and the Ts represent the tested tag locations). . . 32
15 Table of showing the result of the test(units in meters) . . . 33
16 map of the tested area (A represents the anchor locations and the Ts represent the tested tag locations). . . 34
17 table showing the results of the test (units in meters) . . . 34
18 Overview of the the tested area (A represnts the anchor locations, T represents tested tag locations) . . . 35
19 Table showing the results from the LOS test (units in meters) . . . 35
20 Plot of the real tag locations(red dot), the raw location measurements(yellow cir-cle),filtered location measurements(purple circle) and the anchor locations(blue circle) . . . 36
21 A picture of the test setup, anchors are represented by the letter A and the different tag positions tested are represented by the letter T. The x-axis is 11 meters and the y-axis is 10 meters. . . 37
22 Table showing the results from the NLOS test (units in meters) . . . 38 23 Plot of the real tag locations(red dot), the raw location measurements(yellow
cir-cle),filtered location measurements(purple circle) and the anchor locations(blue circle) . . . 38 24 Plot showing the raw location data(magenta), the filtered location data(green) and
the true path(orange) . . . 39 25 Plot showing the raw location data(magenta), the filtered location data(green) and
the true path(orange) . . . 40 26 Plot showing the raw location data(magenta), the filtered location data(green) and
1
Introduction
This section will introduce the problem that this paper aims to solve and give some background information on the problem domain.
1.1 Background
With the rise of Internet of Things (IoT) and ubiquitous computing the demand for locating and tracking objects or devices in an indoor environment is on the rise for a multitude of reasons. The-se reasons includes tasks such as the analyzing of customers patterns in a marketplace, tracking the movement of animals and their behaviour or tracking a robots exact location inside a building [24].
The widely known Global Positioning System (GPS) is one technology used for tracking and loca-ting objects or devices using hyperbolic trilateration with the help of satellites [27]. The system gives a rough estimation with a few meters error of the tracked objects location and it is used mainly for outdoor environment[22]. In an indoor environment there are different factors and pa-rameters to consider like nonlinearities from multipath effects, Non Line Of Sight (NLOS), the setup cost, area in question or the accuracy requirement of the system. Because of these factors there is no universal approach and thus,the choice of technology or approach is usually more de-pendant on these factors.
There are many wireless technologies that have been used in indoor positioning systems such as UWB, ZigBee, Bluetooth, wi-fi etc [32], [34], [25], [33]. The objective of this study is to find an approach or a system that can tackle the above mentioned problems. Building a system that is easy to implement, robust against nonlinearities resulted from different objects or devices in the monitored area and give high accuracy that meets the customers demands.
1.2 General problem
Indoor environments provide several challenges in the positioning field making it hard to locate and estimate the location of a tag especially when using RF-technologies as the measurement system. These challenges includes:
• The structure of the environment and how it is designed as walls can result in NLOS between nodes.
• The internal design and the presence of different objects of different sizes can cause multi-path effects (section 2.1).
• The magnetic field from electronic devices nearby the monitored area. • Moving objects or pedestrians.
All these factors can affect and cause interference in the signals propagation and proprieties resulting in inaccuracies and measurement errors.
1.3 Specific problems
RQ1: How can an indoor Real Time Location System (RTLS) that fulfills the external require-ments be designed and implemented?
RQ1.1: What available technologies can be used to track and locate a moving object in an indoor environment?
RQ1.2: What available techniques can be used to estimate the location of an object in a 2D cartesian space?
RQ1.3: What available techniques can be used to measure the distance between two antennas.
1.4 external requirements
These are the external requirements/limitation of the system based on the customer demands. ERQ1: The systems needs to have an accuracy of at least 1m radius from the actual position in LOS conditions.
ERQ2: The systems needs to have a working range of up to 10 meters.
ERQ3: The system needs to be able to track an object moving at walking speed (About 1.4 m/s).
ERQ4: The system needs to be able to maintain the same accuracy as in ERQ1 in a highly dense area, e.g. an office with different electronic devices and objects of different sizes.
ERQ5: The system only needs to be able to handle positioning in 2D. Additional requirement but not mandatory
2
Theory
This chapter will give a brief overview over different technologies and approaches related to this study, but also insight on signal propagation, theories behind it and different algorithm for measu-ring signals and location estimation.
2.1 Multipath propagation
Multipath propagation are the various paths the signal takes because of the environment the signal travels through resulting in reduction of signal power at the receiving antenna(pathloss) [29]. If it is an open clear space between transmitter and receiver antenna, Line Of Sight (LOS), or a dense area with a lot of object of various sizes. Depending on which, the signal properties can greatly be affected. In plain terms; object of different sizes, buildings or different medium can affect the signal in different ways making the signal weaker, delayed or even blocking it [29]. Which is why it is important in this study to have an understanding of these effects and how to compact them. Are there any existing technologies that are robust against pathloss and multipath propagation or are there some special formulas to calculate the actual signal strength and/ or time of flight. 2.2 Technologies
There exist a wide range of technologies for indoor positioning ranging from RF-systems, came-ras, magnetic fields and laser. Here are some noteworthy IoT technologies that may or may not contribute to this study but nevertheless they are important to look at and understand to have a better view and understanding on different possibilities.
2.2.1 Bluetooth
Bluetooth is one of the most commonly used wireless communication protocols. It uses short wa-velength radio waves in the 2.400 to 2.485 GHz frequency band [19]. The band is divided into 80 channels with 1 MHz bandwidth each. Bluetooth uses frequency hopping spread spectrum, with hops between channels occuring 1600 times per second[20]. This allows efficient sharing of the available bandwidth and also provides resistance to selective fading. Bluetooth offers three diffe-rent modulation schemes: GFSK, DQPSK and 8-DPSK offering data rates off 1 Mbit/s, 2 Mbit/S and 3 Mbit/s respectively[20]. Bluetooth devices connect to each other in a master-slave configu-ration forming a piconet. A piconet can contain up to 8 nodes, with one of the nodes being master and the rest being slaves[14]. It is possible to connect multiple piconets by letting a master in one piconet be a slave in another piconet, the emergent network is then called a scatternet[14]. Blue-tooth devices are divided into different classes based on transmission power and range. The stats for the different classes can be found in the following table.
Table showing the range and transmit power of the different device classes [1]
In the context of indoor tracking and localization, bluetooth is a very popular option. Blu-etooth is widely available and already integrated inside most smart phones and other modern devices. This makes it an attractive technology to use for indoor tracking since it can easily be integrated into many existing devices without the need for any extra hardware. Bluetooth does not allow for precise measuring of time-of-flight[28], instead distance is often estimated by measuring the RSSI(Received Signal Strength indicator). This makes it hard to achieve high accuracy when measuring distance with Bluetooth.
2.2.2 Bluetooth low energy
Bluetooth low energy(BLE) is another version of bluetooth designed for lower power consump-tion while maintaining a similar range. BLE can achieve a communicaconsump-tion range of up to 100 meters[15] with a maximum power consumption of 0.5 W .
BLE operates in the same frequency band, but it is divided into 40 2MHz channels instead of the 1MHz channels used by traditional bluetooth [20].
2.2.3 Wi-fi
Wi-fi is a wireless network technology that is commonly used to access the internet via a wireless access point. There many different versions of Wi-fi operating a multitude of different frequency bands[17]. The communication range varies depending on which frequency band, what kind of antenna is used. For a typical router operating in the 2.4 GHz band the range may be around 40 m[31], but with strong directional antennas the range may be several kilometers. Wi-fi is an attractive option for use in indoor tracking systems since it is already integrated into most modern devices. Measuring precise time-of-flight of wi-fi signals is very hard, which makes it hard to estimate distances accurately. This makes angle based methods such as triangulation more suited for Wi-fi based tracking systems since they do not rely on distance measurements.
2.2.4 Ultra Wide Band
Ultra wide band(UWB) is a wireless communication technology that uses low energy and uses high bandwidth. There exists 14 dedicated channels óf 500 MHz in the 3.1-10 GHz frequency range[2]. The technology works by sending short pulses of low energy over the entire bandwidth. This makes UWB highly resistant to multipath interference[2]. The nature of UWB allows for
very precise measuring of Time-of-flight which means that distances can be estimated with high accuracy[2]. UWBs ability to measure time-of-flight and resistance to multipath effects have made it a popular technology for use in indoor tracking systems. Since accurate distance estimations are possible trilateration can be used to accurately estimate the position.
2.2.5 ZigBee
ZigBee is a wireless communication technology built for low power consumption. It can achieve a maximum data rate of 250 kbps[3] which makes it ill suited for applications where a lot of data needs to be sent between devices. For applications where extended battery life is more important than high data rates however, ZigBee provides an attractive solution.
Most ZigBee devices operate in 2.4 GHz but depending on the location different lower frequency bands may be used, such as 868 MHz(Europe). Using a lower frequency decreases the maximum obtainable data rate significantly, down to 20 kbps for the European 868 MHz band[3]. While using a lower frequency decreases data rates, it does offer higher signal penetration through ob-stacles, which may be beneficial in complex indoor environments.
The maximum communication range for ZigBee is 100 meters[3]. ZigBee is an attractive approach for indoor positioning due to its low power consumption enabling nodes to operate on batteries for long periods of time, however ZigBee suffers from the same problem as other narrowband techniques in that it is hard to estimate an accurate time of flight. There exists some methods to increase the accuracy of TOF estimations, for example [4] who managed to achieve an accura-cy of+- 0.5m using a ZigBee based TOA approach. Other approaches for ZigBee based indoor localization includes measuring RSSI, fingerprinting and CoO.
2.2.6 RFID
RFID(Radio Frequency Identification) is a broad term used to describe any technology that uses radio waves to broadcast their ID[5].
RFID are often categorized based on what types of tags are used. Tags can be either active,passive or semi-active[5]. Passive tags are usually cheaper and have no power source of their own, instead relying on the power transmitted by nearby readers. While this means a tag can operate without being plugged in to a power source, the drawback is that it requires the tag be in close proximity to the reader for the signal to be strong enough to power the tag[5]. Active tags on the other hand has an on-board power source, allowing much greater communication range but often being signi-ficantly more expensive[5]. Semi-active tags carry a small on board battery, but are only activated when in the presence of a reader, allowing for minimal power consumption[5].
There are several different frequency bands allocated for use by RFID all the way from LF(Low Frequency) to UHF(Ultra high frequency) and even microwaves. Higher frequencies requires ac-tive or semi-acac-tive tags since the power provided by passive tags are insufficient[5].
Different tag types and frequency bands are suited for different applications. Passive tags are often attached to cattle and shipping goods etc to provide easy identification. In these types of applica-tions RFID provides an advantage over traditional identification methods such as bar-codes and
qr-codes in that they do not require a clear line of sight[5]. Active tags are often used with higher frequencies in application where longer range is needed, such as positioning systems[5].
2.2.7 Ultrasound
Ultrasound refers to high frequency sound waves above the frequency spectrum audible to the human ear. Ultrasound is used for many different applications such as ultrasonic imaging and object detection. Ultrasound is also used by some animals for localization purposes in a process known as echolocation. The ultrasound waves will bounce of solid obstacles and by measuring the time it takes for the wave to bounce back to its source, the distance to the obstacle can be estimated. This technique can be used to create a sonic image of the surrounding area. While ultrasound can be used to detect objects, it requires a clear line of sight.
2.3 Range and Angle measurement techniques
Range measurement is the most important aspect of indoor positioning, as it is an essential part in determining the location of an object. There is no universal method for determining the distance between two antennas as there are several ways to calculate the distance with help of different techniques. Some techniques use the received signal strength and others use the time of the signal propagation between the antennas.
2.3.1 RSSI
When measuring the time-of-flight is not possible, another approach is to estimate the distan-ce using Redistan-ceived signal strength(RSSI). Because signal strength decreases proportionally with distance, the distance can be estimated by calculating the difference between the transmitted sig-nal and the received sigsig-nal strength. The distance can be obtained from the following equation:
Pr(D)= Pt+ Gt+ Gr+ 20log(λ/4πD)
This approach however yields unreliable distance estimations in complex environment since the signal strength is subject to change from multiple different sources such as NLOS and multipath effects.
2.3.2 Time of arrival
Time of arrival (TOA) is a method used for range measurement between two antennas with the help of the time a signal takes to propagate between them. In theory radio waves can travel at speed of light as radio waves is another form of light [nasa_radio_waves] thus the distance can be measured as:
Where c is the velocity of a signal in air and it is the same as the speed of light 3 ∗ 108m/s. The method is widely used in different positioning and localization systems using radio frequen-cies, one of them is the global positioning system (GPS).
2.3.3 Time difference of arrival
Time Difference of Arrival (TDoA) is another method used for range measurement in systems using radio frequencies. Unlike TOA, TDOA does not require the time departure of a signal, only the time it arrives at the antenna and the velocity of the signal. Once the time of arrival is measured for two points, the difference in time can be used to calculate the difference in distance between the two points to the target. Which gives:
4d= v ∗ 4t
One needs to take into consideration that the anchors need to be exactly synchronized to be able to compare their measurements [6].
2.3.4 Two way ranging
The two way ranging (TWR) is a method used to determine the range or the distance between two RF-devices by synchronizing their internal clock and measuring the time of flight between them. The distance is then measured by multiplying the speed of light c with the time of flight.
d= c ∗ ToF
The synchronization and calculation of ToF is done by sending three calls between a tag and an anchor. The order of who sends first is arbitrary but in this example the tag sends fist. The tag start by sending id-identification and the time it sent (t1). The anchor records the time of the received
message, prepare a response and then sends back the response with its id-identification, recorded time of arrival (a1), and time of transmitting (a2)including the content from the received message.
This process is repeated at the tag. The tag records the messages time of arrival (t2) and send a
final message to the anchor including (t3), time of the transmission from the tag. Upon the message
arrival the anchor records (a3) and calculate ToF:
T oF= (t2− t1) − (a2− a1)+ (a3− a2) − (t3− t2) 4
Figur 1: The Figure shows the call process for device synchronization and time stamp of a tag (t1, t2, t3), and an anchor(a1, a2, a3) in TWR
2.3.5 Angle of arrival
Angle of arrival is the angle of which the propagated signal arrives at the receiver antenna. The angle can be determined with the help of an array antenna or by taking the angle of the maximum signal strength of a rotating antenna. In an array antenna it is possible to determine the angle of received signal by taking TDoA at each antenna. What is actually measured is the phase difference of the received signal at each antenna, the difference is calculated and converted directly to the angle of the object’s direction [8].
2.4 Localization techniques
There are various different methods that can be used to estimate the location of an object. The most commonly used localization techniques are described in the following section.
2.4.1 Trilateration
Trilateration or True Range multilateration is a method used to locate a moving object in a space and is widely used in navigation techniques. The method, using different range measurement from multiple stations (anchors) at different predetermined locations, pinpoints a point (target) in space. For an easy and intuitive explanation, trilateration can be used with the help of circles or spheres to see where they overlap or intersect in a 2D or 3D cartesian space. The overlapping area answers for the location of the targeted object [9].
In a plane it is sufficient with two range measurement to narrow the location of an object to two possibilities. One of which is the true location while the other one is an ambiguous estimation.
With a third measurement the possibilities is narrowed to one location which is the actual one. In a 2D cartesian plane the math is straightforward. That would make three equations with 2 unknown:
(x − x1)2+ (y − y1)2= r12
(x − x2)2+ (y − y2)2= r22
(x − x3)2+ (y − y3)2= r32
The coordinates (x1, y1) and (x2, y2) are predetermined points and answers for anchors location
on the map while (x,y) is the location of the tracked object. 2.4.2 Triangulation
Triangulation or the knowledge of angles is a method used to calculate a point in a space by for-ming triangles with it from known points (references) in space. Like trilateration, triangulation is a method used in navigation, surveying or positioning systems but the main difference lies in its approach. That is, instead of using range measurement directly to the target, like in trilatera-tion, triangulation uses angles measurement form two points to the target with combination of the distance between the points to form a triangle formed by the reference points and the target. From there it is a trigonometric problem to solve the location of the target node [10].
2.5 filter
Here are some filtering algorithms for better localization data. 2.5.1 Fingerprinting
Using the received signal strength for estimating distance can be problematic, especially in com-plex environment. The signal strength is subject to change from multiple sources such as NLOS and multipath effects. This makes estimating the distance hard. One popular method of appro-aching these issues is fingerprinting. The fingerprinting method consists of two phases, the offline phase and the online phase. In the offline phase the RSSI is measured at different locations in the area to model the radiation pattern of the given area.
The online phase is the phase where the system is actually used to for positioning. When a recei-ver receives a signal its RSSI is compared to the database of measured RSSI values to estimate the location. While this approach can improve the accuracy of RSSI-based tracking systems, the offline phase makes it tedious to set up.
2.5.2 Kalman filter
Kalman filter is an algorithm that estimates a set of state variables by combining measured data containing noise and other inaccuracies, with a prediction based on the previous state[11]. Kalman filters have a wide range of applications such as in signal processing, localization etc. Kalman fil-ters can also be used for sensor fusion.
The kalman filter assumes that the current true state is evolved from the previous according to the following equation:
xk= Fkxk−1+ Bkuk+ wK
Where xk is a vector containing all the state variables at time k, i.e the current true state that we
wish to predict.
Fk is the transition matrix, which represents the mathematical model used to calculate the new
state from the previous one.
xk−1is a vector containing all the state variables at time k−1, i.e the previous state.
Bkis the control matrix, which represents a mathematical model for applying control input to the
prediction.
uk is the control vector, which is a vector containing control input to the system at time k. This
term is optional and can be used to represent known disturbances or user input to the system. wkis the prediction noise vector representing noise caused by inaccuracies in the prediction model.
The relationship between the measured data and the true state at time k is given by the following equation:
zk = Hkxk+ vk
Where zk is a vector containing the measured values at time k
Hk is the measurement matrix, which maps the state measurement variables to the state variables.
xk is a vector containing the true values of the state variables at time k.
vkis a vector containing the measurement noise.
In the kalman filter all noise is assumed to be zero-mean gaussian noise. The co-variance of the measurement noise vk is represented by the matrix Rk, which must be measured or estimated by
the designer of the system. The co-variance of the prediction noise wkis represented by the matrix
Qk which must be estimated.
Given the aforementioned assumptions, the kalman filter makes an estimation of current state using an algorithm which can be divided into two steps, the prediction step, and correction step. In the prediction step a prediction of the next state xk+1is made according to the following equation:
xk+1 = Fxk+ Buk
The error co-variance for the next state Pk+1is then predicted according to the following equation:
Pk+1 = FPkFT + Q
When the prediction has been made, it is then updated in the correction step of the algorithm. The correction step begins by computing the kalman gain Kkaccording the following equation:
Kk = PkHT(HPkHT+ R)−1
Once the kalman gain has been calculated the predicted state is updated according to the following equation:
xk = xk+ Kk(zk+ Hxk)
Lastly, the predicted error co-variance is updated according to the following equation: Pk = Pk(1 − KkH)
This process is iterated at every timestep. The algorithm requires that the values of x,P,Q,R be initialized. Choosing the values of these can be hard, and choosing the wrong values can seriously degrade the result of the filter[11].
F,B and H must be adapted for the specific system, and by changing them many different systems can be modelled.
2.5.3 Monte-carlo localization
Monte-carlo localization is a localization algorithm based on particle filtering[12]. The algorithm starts by making several guesses of the current state referred to as particles. Each particle contains all the information needed to describe a state, i.e. a vector containing all the state variables, such as position, rotation etc. The particles are initially uniformly distributed in a random fashion. When new sensor data is available the data is compared to the particles and are resampled using recursive bayesian estimation. The new set of particles have a higher probability of being set near the particles that had the highest correlation to the measured values. By iterating the process, the particles will converge towards the true state[12]. Monte-carlo localizaton is good for dealing with nonlinear systems, but are computationally expensive[13].
2.6 Hardware
This section explains related hardware 2.6.1 Antenna
There are different types of antennas that have different type of functionality and usages. What characterizes an antenna is the radiation pattern it emits and its gain. There are two types of an-tennas, an isotropic antenna which radiate electromagnetic waves equally in all directions and a directional antenna, Which from its name radiate electromagnetic wave in a certain direction for-ming a beam and thus more gain in that direction without the need for higher output power. In Images below show radiation power and the gain for each antenna. The isotropic one to the left and to the right is a directional antenna.
2.6.2 DecaWave DWM1001
The DWM1001 is an UWB module produced by Decawave that incorporates a DWM1000 UWB transceiver, a nRF52832 BLE tranceiver and an accelerometer. This module can be configured as either anchor or tag and set up in a network with other tags, anchors or bridges to map an area. DWM is manily used for positioning for indoor environment as the uwb ability to compac multipath effects (2.2.4).
3
Related works
There exists a multitude of different technologies and methods that can be used for indoor location estimation. A Lot of work has been done in the field of indoor positioning using different appro-aches. Some of the works that are deemed particularly relevant to our work are discussed in the following section.
3.1 “Development of an UWB Indoor 3D Positioning Radar with Millimeter Accu-racy”
In [35] students from ECE and MABE Department, University of Tennessee, Knoxville, works in junction to develop a 3D positioning system that is robust against multipath effects and NLOS. In their work they used UWB with a special built receiver antenna. The system setup utilizing a GPS-like scheme consist of four receivers at different locations and the target node as a transmit-ter. TDOA is calculated as the time difference of the signal arrival between two pairs of antennas to find the direction of the target node and with help of triangulation algorithm to localize the object. The Algorithm for signal detection consist of combining Signal Strength (SS) with first peak-finding algorithm for accurate detection of pulse position.
This work is an experimental research, constructed to test and evaluate the capabilities of the system in 1D, 2D and 3D localization in different environment. With clear line of sight and low multipath effects, dense area of objects and multipath effect, and also in NLOS. The system sho-wed great measurement with little errors of some millimeters in all different areas and scenarios. 3.1.1 Comments
The thesis gives an insight on how to combine different algorithms for signal detection for more accurate measurement but also on system setup and localization algorithm which can be very useful in this study.
3.2 “Comparison and analysis of indoor wireless positioning techniques”
In [26], several different technologies and techniques commonly used for indoor positioning are di-scussed and compared. The techniques didi-scussed in the paper are IR, ultrasound, Optical tracking, Bluetooth, RFID, UWB, AoA, ToA, TDoA and RSSI. A brief overview is given on the principles of the aforementioned techniques, and some of their most prevalent advantages and disadvantages are discussed. Lastly the the different techniques are compared in terms of what level of precision can be achieved.
3.2.1 Comments
This paper is relevant to our work since it provides a good overview of the various different tech-niques available for indoor positioning. The information contained in this paper provides a
theore-tical foundation that may aid in selecting the most suitable approach for our specific application. 3.3 “Indoor performance analysis of LF-RFID based positioning system:
Compa-rison with UHF-RFID and UWB”
In [21] an indoor positioning system based on LF-RFID is proposed and evaluated in comparison to two other techniques commonly used in indoor positioning applications. In most positioning system, high frequencies are used. Low frequencies however provide high resistance to common problems in indoor positioning like NLOS. The proposed system uses RSSI along with trilateration to achieve a mean error of 1.5 m over a 315 square meters area. Two additional systems are constructed for comparison, one using UHF-RFID and one using UWB. Several experiments are conducted with the different systems and their results are presented in the paper. The accuracy of the different are presented and compared.
3.3.1 Comments
This paper is relevant to our work because it evaluates the performance of several available tech-nologies. The results from the paper may be used to further develop our knowledge and in the field and make better choices in the project.
4
Method
This study is conducted using both literature study and and the Nunamaker working method [30].The literature study will be on different works and theories on indoor positioning using RF-technologies and compare them based on accuracy, algorithm complexity and robustness against multipath effects. The last one would be the biggest and detrimental factor on choosing the appro-priate technology to proceed with as its the main factor for better accuracy.
The working method for this study would be an iterative process where one can go back and forth between all levels, from the very first beginning of constructing an idea to building a proto-type and evaluating system results. For this reason we will be choosing the Nunamaker working method to ensure that as we work we don’t miss necessary steps, and that we go in the right direc-tion while progressing in the project.
4.1 Construct a Conceptual Framework
This is the base phase where one have to build a basic understanding of the underlying theories, definition of the domain problem, and which different aspects it have. Aspects such as system
requirements, functionality,limitations, theories like physical or mathematical disciplines, and re-lated works. In this phase the combination of working methods literature work and philosophical discussions, will be used to understand and discuss the different aspects of the problem and how to tackle them.
4.2 Develop a System Architecture
After the first phase, when building an understanding of the problem domain and the different parts of it, comes the second step in which designing a system architecture that describes the inner relation between these parts. Which different parts does the system need and what purpose do they serve. Are they needed or just extras. An easy way to summarize the whole system is by dividing it in a problem tree. One can easily see the underlying parts but also have an abstract understanding of each part.
4.3 Analyze and Design the System
This phase require brainstorming of ideas, what each subsystem should look like and which di ffe-rent solution it can have. After analyzing and evaluating diffeffe-rent solutions with respect to diffeffe-rent criteria a solution is chosen among different possibilities. The set of chosen solutions must all be integrated and work together in the system. That is to say the compatibility of a subsystem or task to work with other parts must also be taken in consideration.
An evaluation matrix is a good tool to collect and sort different ideas under each category and to evaluate them later depending on different criteria the system needs to fulfill.
4.4 Build (Prototype) the System
After finding an appropriate solution comes the building of the system or a prototype. It is usually done building the small subsystems first and testing them. Getting more insight on the complexity in each part and how they work. This will ensure that each part work correctly before integrating them in the system.
4.5 Observe and evaluate the System
This phase is more about testing the whole system and how different subsystems work together to give the desired result. This phase also involves experimental testing to analyze and evaluate different scenarios. Are they good in both LOS and NLOS, how good is the accuracy in both these environments and is the system robust against non-linearities in the signal resulted from signal propagation.
5
Result
This section present the different results of this study. From start to finish, the iteration process of this work and the build up of each step based on the progression made from literature study, task completion, measurements, discussion and evaluation of each step. The discussion and evaluation of each and every step is taken in consideration to different criteria namely:
• Time Frame: Is the time-frame for the task in question constituted from the task complexity suited for our time frame or not.
• Task complexity Is the task at hand too complex based on how much work it requires and is there any workaround or is it a necessity for the progression of the project.
• System limitations and requirements: Does the task at hand fulfill the customers requests as mentioned in 1.4.
• other limitations: Limitation such as components scarcity, budget limitation, soft- or hard-ware restrictions.
This section will also provide results from main system and subsystems tests and measurement in one dimension 1D (straight line), and two dimension 2D (measurement in a plane) in both Line Of Sight (LOS) and Non Line Of Sight (NLOS) etc.
5.1 Construct a conceptual framework
Constructing a conceptual framework comes first from understanding the underlying theories and the problem domain e.g. How to build a Real Time Location System that can meet the customers requirements and the limitations of this work (external requirements) as descried in these sections 1.2 and 1.4.
This step in our development process primarily consists of two parts, a problem tree and a literature study. These are explained in more detail below.
5.1.1 Problem-tree
The problem tree was done to breakdown the problem into different sub problems and thus gain a better perspective on which subjects should be researched in the literature study. The resulting problem tree is shown in fig 2. The subsystems of a RTLS consists of three main parts namely positioning system, communication protocol, and GUI or visual representation as shown in figure 3.
Figur 3: Overview over the main subproblems or a RTLS
• Positioning: To track a moving object/ tag in a RTLS, position measurement must first be calculated and provided to estimate the location of the moving tag. The main goal of this part is to establish connection between the nodes and give an position estimate.
• GUI: The GUI is a visual representation of the monitored area on an android tablet that shows the tracked objects location relative to the tags location at each frame-time.
• Communication Positioning-GUI: For an RTLS to work, a real time updating of the po-sition on the GUI is necessarily. For that, a communication link between the popo-sitioning network and GUI needs to be established to communicate between the subsystems.
Each of these three subsystems have its own bundle of problems and will be identified and clarified accordingly.
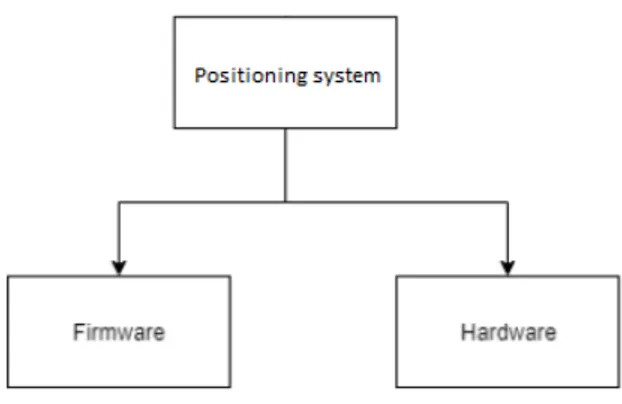
Figur 4: Overview over the positioning subsystem
Positioning: To get position data two main necessities are required, the firmware for position estimation and the capabilities of the component.
1. Does the firmware support or provide basic solutions for the customers requirements. 2. Does the hardware capabilities match this study limitations and to which extent.
Hardware: This step consist of exploring the hardware capabilities and its limitations to have a good grasp of the device limitations which can be detrimental if not considered appropriately. This step consist of:
1. Hardware testing: Includes testing the capabilities of the component in different condition to have a better grasp of the component limitation first hand.
2. Hardware and system setup: includes testing of tag and anchor connection to the network and testing of the positioning system.
Firmware: The firmware section includes exploring the hardwares API. Here it is important to have knowledge on different localization’s algorithms and techniques, the basic requirements of them. Requirements like the amounts of minimum reference nodes needed to estimate the location of a tag or other different and additional parameters like angle of arrival(aoa), time of arrival(toa) etc.
In this section it is also important to understand different ranging techniques and algorithms. They can determine and decide which positioning algorithm to implement.
5.1.2 Literature study
The literature study was conducted to gather knowledge about what technologies and methods are available and how well suited are they for this project. Based on the external requirements we understand that the system need to be able to localize an object in an area where conditions such as NLOS and multipath propagation can exist, but also have a long detection range of up to tens of meters. These parameters narrowed our search area to technologies that use radio wave frequencies like wi-fi 2.2.3, Bluetooth 2.2.1, Bluetooth low energy (BLE) 2.2.2 and Ultra Wide Band (UWB) 2.2.4 etc. More can be found in the theory chapter under technologies section 2.2. Radio waves can travel through solid objects if the waves length is small enough to travel through the molecules or atoms of the object, or big enough compared to the objects size that it is unob-structed. That makes radio wave technologies a good choice for this study.
Below is a table including information on different technologies, their range, accuracy and in-herent ability to compact nonlinearities in an indoor environment. These information are based on different results taken from similar works or studies in indoor positioning field, different theories or other related sources.
For localization and ranging techniques that are compatible with the above mentioned techno-logies many solutions were found. The most common and widely used were Triangulation 2.4.2 and Trilateration2.4.1 which could be used in this paper. The ranging techniques were chosen in respect to the requirements of the localization techniques mentioned previously. There, exists dif-ferent approaches. From just taking the RSSI 2.3.1 (which is very unreliable as it can differ greatly with the distance and very susceptible to multipath) to time of flight approaches like two way raging 2.3.4 and angle measurement like angle of arrival 2.3.5. More on ranging and localization techniques can be found in 2.4 and 2.3.
As can be seen in table 1 and based on the accuracy criteria in section 1.4 UWB would be the best choice to proceed with. It is very robust against multipath effects which is the biggest factor in determining the consistency of a system but also it does provide very high accuracy of up to few centimeters as can be seen in section 3.1.
References Technologies Accuracy Range Advantages Disadvantages [18] RFID 4m 200m Consumes low po-wer, can be combined with other technologies for high accuracy poor accura-cy [16] Wi-Fi 1m-3m 35 m indo-or Widely used and availab-le Susceptible to noise, complex algorithm [36] [23] ZigBee 2m 1000m cheap and power efficient Low data speed [18] Bluetooth /BLE 3m 100m Widely used, good reception range, have low energy consumption Low accura-cy
[18] UWB less than
1m 60m High accura-cy and ro-bust against multipath ef-fects Requires ex-tra hardwa-re and high cost
5.2 Develop a system architecture
The system architecture based on the the problem domains and their relationships is shown below in figure 5.
Figur 5: System architecture 5.2.1 System logical view
System logical view is another way of representing systems architecture but more abstract and with little details on low level function giving clarification on the context of each of the subsystems.
• Back-end: Back-end includes a real time operating system to read from anchors, calculate position and give an real-time position estimate.
• Communication: Communication transferring data between the front-end and back-end. It is a two way communication to configure the nodes and to read position from them. • Front-end: The front-end includes the visualization och the tag location on a map based
window and show position measurement. 5.3 Analyze and design the system
In this section the choice of the different parts of the system are analyzed. 5.3.1 Ranging technology
Though there are a multitude of different technologies that can be used for localization, each with their own strengths and weaknesses. Based on the requirements of the project discussed in the limitations section, and the previously mentioned literature it was concluded that UWB would be the most suitable technology for performing the localization. One of the reasons is that it is allows for precise ToF measurements which leads to high accuracy. When taking the range into account it was concluded that UWB can provide the best accuracy while fulfilling the range requirements specified in section 1.4.
Another reason for choosing UWB is that it is highly resistant to multipath effects, which can be a big problem in cluttered indoor environments. This makes it highly suited for the aim of this project.
5.3.2 Communication
For communicating the location data to the device holding the GUI, BLE was chosen. The reason for this is mainly because of its compatibility with the hardware chosen for this project.
5.3.3 Hardware
When researching the available UWB-transceivers on the market, all of the results where based on the Decawave DWM-1000 module. After researching the available it was concluded that the Decawave DWM-1001-DEV board would be best suited for our purpose. The main reason for this choice is that apart from being equiped with a dwm-1000 module, the board also comes equipped with a nRF52832 MCU BLE-transceiver. The BLE-transceiver is useful to the project since the location-data needs to be sent to a user device for visualization, and most common devices such as smartphones and laptops do not support UWB-communication. With the DWM-1001 the location-data can be sent to the users device via BLE.
The board comes loaded with firmware that has internal ranging- and location engine based on TWR and multilateration, which can be accessed through different APIs. One of the supplied
APIs is based on a Bluetooth GATT-server, and allows for both configuration of the system and extraction of data through BLE.
DWM-1001 is capable of updating its position 10 times per second, which should be enough to track an object moving at walking speed(1.5 m/s) as demanded by our requirements in section 1.4. 5.3.4 Filtering
Based on the literature study there where to types of that where widely used in position scenarios and which seemed the most relevant to this project. These were kalman filter and particle filter. Even though the particle filter may have some benifit over the kalman filter in its ability to hand-le nonlinearirities, such as those caused by NLOS, the kalman filter was chosen for this project. There are two main reasons for this. The first is that particle filtering requires a map of the area, which would reduce the range of use cases. The other reason is that particle filtering is much more computationally expensive.
When the type of filter had been chosen, the parameters of the kalman filter where set as follows: xk = (posXk, posYk): The state is described by only two state variables, posXkand posYk.
zk = (posXk, posY − k): The measurement vector also contains two variables, which are the
mea-sured x and y coordinates as obtained from the DWM1001-location engine.
Hk = 1: Because the measured variables are the same as the state variables, no measurement
matrix is needed since the measurement variables are already mapped to state variables.
Fk = 1: The model used to predict the next state is a stationary model, which assumes that
xk = xk−1. This model was chosen because the because with a timestep of 0.1 s and a maximum
speed of 1.5 m/s, the maximum difference in position between two timesteps is only 0.15 m. The possibility of using a motion model based on dead reckoning was also investigated, however this model was discarded due to the sensors required for such a task where not available to us at the time.
R = 4.409, 0, 0, 4.409: The value 4409 is the variance of the positioning systems, measured by us. The zeroes mean stems from the assumption that the noise for the variables is independent. Q= 5000: The Q value was chosen to be set slightly higher than R.
In order to estimate the initial state of the system, the system performs 10 position measurements and sets the initial position to the average of those 10 measurements. P is initiated as an identity matrix, since we dont know how big the errors will be.
modifying the location data retrieved via the APIs without completely disabling the internal loca-tion engine. For this reason the filter will be hosted in the android applicaloca-tion where it is applied to the raw location data received from the tag.
5.3.5 GUI
The location data will be vizualized to the user through an android application. The reason for this is that most android phones comes bluetooth and they are highly portable. Apart from hosting the GUI, the android app also contains the kalman filter. The filtering is done on the app because of compatibility issues with the DWM-firmware. An activity diagram for the android app is show in figure 7.
Figur 7: Activity diagram of the android app 5.4 Build(prototype) the system
In this section build and design of the final system is presented. 5.4.1 System overview
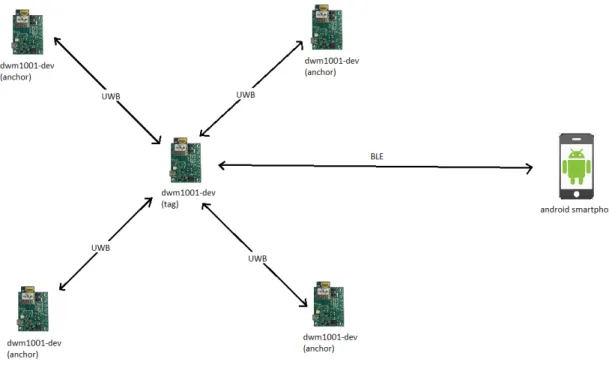
Based on the system design presented in section 5.3 a protoype of the system was built. The sy-stem consists of the positioning sysy-stem and a GUI, who communicates with each other via BLE. The positioning system consists of 4 DWM1001-dev boards used as anchors and one used as a tag.
All communication within the positioning system is done via UWB. The tag sends the positioning data via BLE to an android device, where it is visualized in the app. An overview of the whole system can be seen in figure 8.
Figur 8: An overview of the whole system 5.4.2 Positioning system
4 DWM1001-DEV boards are configured as anchors and placed in the corners of the room. Anot-her DWM1001-DEV is configured as tag. The tag takes disance measurements from each anchor and estimates its position 10 times per second. The tag hosts a bluetooth GATT server, through which the location data can be retrieved.
5.4.3 Android Application
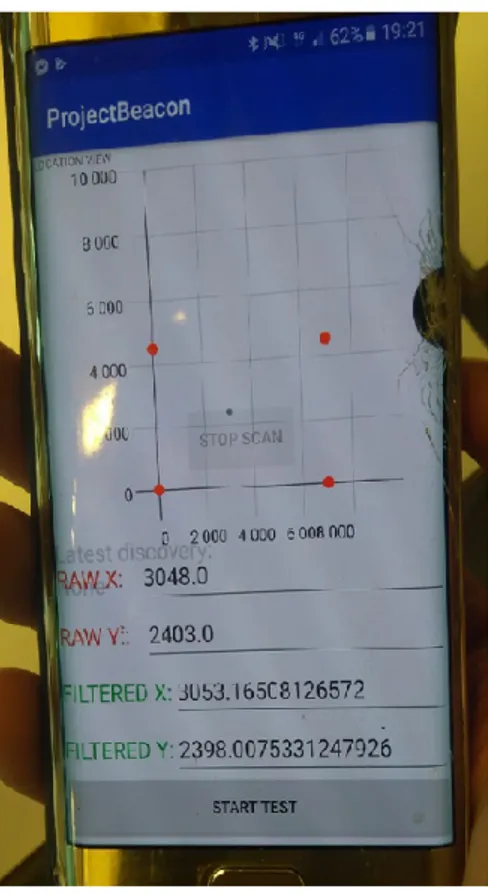
The android application is responsible for applying the kalman filter and vizualize the location data. The application connects via bluetooth to the GATT server hosted by the tag, and reads the location data 10 times per second. The location data is then filtered with the kalman filter. Both the raw and filtered location data are visualized graphically in the android application through the use of textViews and a graphview. The GUI of the ndroid application is shown in figure 9
Figur 9: Caption 5.5 Observe and evaluate the system
In this section the system is observed and evaluated. The results of performed tests are presented here.
5.5.1 LOS ranging
Testing for distance measurement in LOS was performed in a 10x10 room. An overview of the area and test setup is shown in figure 10. The results of the test are presented in figure 11. Each presented value is the average of 10 measurements.
Figur 10: Map of the tested area (A represents the anchor location and the Ts represent the tested tag locations).
Figur 11: Table showing the results of the LOS ranging test (units in millimeters). 5.5.2 NLOS ranging
Three different tests were performed in various NLOS environments. The first test was performed in the same area as the LOS test. The anchor was placed in a neighbouring room, separated 4 cm thick wooden door. The test setup is shown in figure 12 and the results are presented in figure 13. Each presented value is the average of 10 measurements.
Figur 12: Map of the tested area (A represents the anchor location and the Ts represent the tested tag locations)
Figur 13: Table showing the result of the test(units in meters)
The second test was performed in a hallway with the tag placed behind a corner. A map of the tested area is shown in figure 14 and the test results are presented in figure 14. Each presented value is the average of 10 measurements.
Figur 14: Map of the tested area (A represents the anchor locations and the Ts represent the tested tag locations).
Figur 15: Table of showing the result of the test(units in meters)
The third test was performed in the same area as the second test, but the anchor was placed behind a thick concrete wall. A map of the tested area is shown in figure 16 and the results are presented in figure 17. Each presented value is the average of 10 measurements.
Figur 16: map of the tested area (A represents the anchor locations and the Ts represent the tested tag locations).
Figur 17: table showing the results of the test (units in meters) 5.5.3 LOS localization in 2D
Testing for LOS was performed in a 10x10 meter area with clear line of sight to all anchors. A map of the area and the tested tag locations is shown in figure 18.
Figur 18: Overview of the the tested area (A represnts the anchor locations, T represents tested tag locations)
The results of the test are shown in figure 19 and figure 20. Each presented value is the average of 10 measurements.
Figur 20: Plot of the real tag locations(red dot), the raw location measurements(yellow circ-le),filtered location measurements(purple circle) and the anchor locations(blue circle)
5.5.4 NLOS localization in 2D
Testing for NLOS was performed in a 11x10 meter area(the dining hall of orkanen, floor 3). An overview of the room and test setup is shown in figure 21
Figur 21: A picture of the test setup, anchors are represented by the letter A and the different tag positions tested are represented by the letter T. The x-axis is 11 meters and the y-axis is 10 meters. The results of NLOS test is shown in figure 22 and figure 23. Each presented value is the average of 10 measurements.
Figur 22: Table showing the results from the NLOS test (units in meters)
Figur 23: Plot of the real tag locations(red dot), the raw location measurements(yellow circ-le),filtered location measurements(purple circle) and the anchor locations(blue circle)
The tests shows that while the system has some resistance to NLOS, severe NLOS conditions can seriously reduce the performance of the system. The filter shows minimal improvement over the raw data.
5.5.5 Real-time tracking in 2D
Three tests were performed to verify that the system is able to maintain an acceptable accuracy when the tag is moving. The tests where done in a 10 x 10 meter area by walking with the tag along a predetermined path at normal walking speed. The estimated positions are then plotted against the true path. The results of the tests are shown in figure 24, 25 and 26.
Figur 24: Plot showing the raw location data(magenta), the filtered location data(green) and the true path(orange)
Figur 25: Plot showing the raw location data(magenta), the filtered location data(green) and the true path(orange)
Figur 26: Plot showing the raw location data(magenta), the filtered location data(green) and the true path(orange)
6
Analysis
In this section the system and results are analyzed with respect to the research questions and requirements described in section 1.
6.1 LOS ranging 1D
The results from LOS ranging tests as shown in table 11 shows that the ranging accuracy was between 5 cm to max 40 cm in clear LOS conditions. It is important to note that these values were the average of each measurement iteration. These result were very promising for the overall result of the whole system as it can give good accuracy in clear open conditions. While one might expect the accuracy to decrease with distance, the test results show that this is not always the case. There may be several reasons for this. One reason may be due to limitations in the time resolution of the system. Since the signals travel at the speed of light they can reach significant distances in even a single tick of the systems internal clock. If the distance that we are aiming to measure is close to a multiple of the distance travelled in one tick, the measured distance will be more accurate than if is not.
6.2 NLOS ranging
The results of the NLOS measurement in the three scenario’s are shown in section (5.5.2) ()
Table (13) shows the average estimated distance measurement behind a door. At worst the accuracy was off by one meter and at best is was the same as the actual measurement. The door composes mostly of wood and is not that dense which makes it easier for the signal to penetrate and still give good ranging.
This test displays the same phenomena as the LOS ranging test, where the accuracy does not strictly decrease with distance. Possible reasons for this observation is is discussed in section 6.1. In scenario 2 the measured accuracy was between 20 cm and 4.5 m at worst as can be shown in table (15). Despite NLOS conditions we still got measurement for up to 22.5 m. The reason for that is that the walls and the structure of the measured area mostly composed of glass or wood walls which are not that dense and signal can somewhat penetrate as can be seen from the result.
The last table (17) gave the worst accuracy and the tag was not visible after 11 meters. The thickness of the wall was more than 60 cm and it was composed of concrete which is very dense. Despite the UWB capabilities for sending signals at a wide range of frequencies whick makes is susceptible against multipath and different NLOS scenarios tp, the signal still could not penetreate the concrete wall.
6.3 LOS localization in 2D
The results from the tests described in section 5.5.3 shows that the system is able to achieve a good accuracy in normal indoor LOS conditions. The achieved accuracy of the system based on the LOS localization test is around 30 cm. This satisfies the accuracy requirements described in section 1.4. The Kalman filter shows only a small improvement over the raw location data provided by the DWM1001s internal location engine.
6.4 NLOS localization in 2D
The results from the tests described in section 5.5.4 shows that the system is able to handle some forms of NLOS, there where however some locations where the system was not able to estimate a position. These where all locations where there was less than two or less anchors in LOS. The accuracy achieved in the locations that the system was able estimate was around 50 cm, which satisfies the accuracy requirement specified in section 1.4.
6.5 Real time tracking
The results from the real time tracking tests described in section 5.5.5 shows that the system is able to maintain an acceptable level of accuracy even when the tag is moving at the speed specified in section 1.4. The accuracy achieved in these tests is around 50 cm. The filter shows a small improvement in accuracy over the raw data. The filtered data also seems to have slightly less spikes, indicating a small improvement in precision as well.
7
Discussion
Looking at the different results in chapter 5 concerning the range and localization measurement one can see that the accuracy in all these conditions and scenarios are rather good when looking and comparing to other works. In LOS conditions the inner structure of the mapped area did not affect the accuracy of the position estimation which is in alignment with the theory that UWB is not affected by multipath propagation thanks to it is effectiveness in using an ultra wide band spectrum. In NLOS condition the system did give bad result as it could not detect the tag i certain areas. This is due to tag not begin obstructed and not detected by a third anchor. This is due to two possibilities. The area the tag was in consisted for microwaves devices and we believe that the magnetic field from them can disturb the signal if they are on power. The second possibility is due to the being in NLOS to all the ranging anchors and the walls were made from hard dense material.
8
Conclusions and future work
8.1 Answering the research questions
In this section the research questions defined in section 1.3 are answered and discussed. 8.1.1 RQ1.1
What available technologies an be used to track and locate a moving object in an indoor environ-ment?
There are multiple technologies available that are able to be used for indoor location estimation as discussed in section 5.1.2. These technologies include UWB, Bluetooth, Wi-fi, Zig-bee and RFID. The technologies all have different advantages and disadvantages, and which is most suitable must be determined on a case-by-case basis depending on the requirements of the project. For the aim of this thesis, it was concluded that UWB would be the most suitable, mainly because of its high accuracy and resistance to multipath effects.
8.1.2 RQ1.2
What available techniques can be used to estimate the location of an object in 2D cartesian space? There are many different algorithms available for 2D location estimation. Because different al-gorithm requires different parameters to be measured, such as angle and range, the choice of al-gorithm is highly dependant on which technology and ranging techniques are used. If only range measurements are available, trilateration is a suitable method for location estimation, otherwise, other options such as triangulation should be considered.
8.1.3 RQ1.3
What available techniques can be used to measure the distance between an object and a reference point?
Our literature study shows that there are two main ways to calculate the distance between two nodes, ToF-based methods and RSSI-based methods. Raw RSSI values often yield unreliable range measurements and to achieve high accuracy requires complex algorithms, increasing the complexity of the system. ToF-based methods like ToA can produce highly accurate distance me-asurements, but has high demands on the time resolution of the system and requires that the clocks of the beacons are synchronized. The problem of synchronization can be solved by using TWR or TDoA or other means.
8.1.4 RQ1
How can a Real Time Location System (RTLS) that fulfills the external requirements be designed and implemented?
In order to answer this question, a system was built and evaluated based on the requirements spe-cified in section 1.4.
ERQ1: The systems needs to have an accuracy of at least 1m radius from the actual positionin LOS conditions
The test results presented in section 5.5 show that the implemented system fulfills the accuracy requirements in LOS conditions.
ERQ2: The systems needs to have a working range of up to 10 meters.
Both the localization test in LOS and NLOS where performed in a 10 x 10 meter area confirming that the range requirements of the thesis is met. The results from the 1D ranging tests shows that a ranges of more than 20 meters may be possible but this was not tested in 2D.
ERQ3: The system needs to have an accuracy of at least 2m in NLOS conditions
The results from the test shows that the system is able to satisfy the accuracy requirement in some NLOS conditions, such as through doors or thin walls.
ERQ4: The system needs to be able to track an object moving at speeds up to 1.5 m/s (wal-kingspeed)
The results from the real time tracking tests shows that the system is able to track a tag moving at 1.5 m/s, while still fulfilling the accuracy requirements.
ERQ5: The system needs to be able to maintain the same accuracy as in ERQ1 in a highlydense area, e.g. an office with different electronic devices and objects of different sizes
people and electronic devices. The results show that system is able to handle such environments well, satisfying this requirement.
ERQ6: The system only needs to be able to handle positioning in 2D
The test results from the various 2D localization tests show that the system satisfies this require-ment.
8.2 Future work
While there are many improvements that can be made on this system like better accuracy in NLOS conditions, the future work on this study can have many useful applications.
The system can be used in a bigger network of anchors and map and monitor a whole building. A future study on this can be how to map a bigger building while having a gateway with a raspbian module. It would be interesting to be able to connect to the network from either an android device or a computer and see their exact location.
Studies on human or animal behaviors are another area that this system can be used in. One needs to take in consideration the range of the system and the monitored area is limited. Still this system offer good solutions. Like monitoring the movement of patient, criminals in prison, child-ren with disabilities or animals in zoos.
Another useful application for this system is to monitor the movement of a robot or a drone to manage and guide them via either external AI or input from user.
Referenser
[1] url: https : / / www . scienceabc . com / innovation / what is the range of -bluetooth-and-how-can-it-be-extended.html. accessed at 2019-03-28.
[2] url: https://drive.google.com/file/d/17CNMHjoa3YCSEsza2MyCpOhnPx0XG2LQ/ view?usp=sharing. accessed at 2019-03-28.
[3] url: https://web.archive.org/web/20130627172453/http://www.zigbee.org/ Specifications/ZigBee/FAQ.aspx. accessed at 2019-03-28.
[4] url: https://www.ncbi.nlm.nih.gov/pmc/articles/PMC4801579/. accessed at 2019-03-28.
[5] url: https : / / www . atlasrfidstore . com / rfid - beginners - guide/. accessed at 2019-03-28.
[6] url: https://www.sewio.net/uwb-technology/time-difference-of-arrival/. accessed at 2019-03-28.
[7] url: https://www.sewio.net/uwb- technology/two- way- ranging/. accessed at 2019-03-28.
[8] url: https://www.sciencedirect.com/topics/engineering/angle-of-arrival. accessed at 2019-03-28.
[9] url: https://www.britannica.com/science/trilateration. accessed at 2019-03-28.
[10] url: https://gisgeography.com/trilateration-triangulation-gps/.
[11] url: http://bilgin.esme.org/BitsAndBytes/KalmanFilterforDummies. accessed at 2019-03-28.
[12] url: https://www.sourceallies.com/2009/11/monte-carlo-localization-in-a-nutshell/. accessed at 2019-03-28.
[13] url: http : / / www . cs . cmu . edu / ~16831 - f14 / notes / F14 / 16831 _ lecture05 _ gseyfarth_zbatts.pdf. accessed at 2019-03-28.
[14] What is the difference between piconet and scatternet. url: http://rkspidey.blogspot. com / 2016 / 10 / what - is - difference - between - piconet - and . html. (accessed at 2019-03-03).
[15] whats the difference between bluetooth low energy and ant. url: https://www.electronicdesign. com/mobile/what- s- difference- between- bluetooth- low- energy- and- ant.
(2019-03-28).
[16] N. Wirström m. fl. ”Localization Using Anonymous Measurements”. I: 2015 International Conference on Distributed Computing in Sensor Systems. Juni 2015, s. 137–146. doi: 10. 1109/DCOSS.2015.23.
![Table showing the range and transmit power of the di fferent device classes [1]](https://thumb-eu.123doks.com/thumbv2/5dokorg/3987950.79039/13.892.228.572.189.324/table-showing-range-transmit-power-fferent-device-classes.webp)