DOI:10.1051/0004-6361/201424762
c
ESO 2014
Astrophysics
&
The FERRUM project: Experimental transition probabilities
from highly excited even 5s levels in Cr
L. Engström
1, H. Lundberg
1, H. Nilsson
2, H. Hartman
2,3, and E. Bäckström
41 Department of Physics, Lund University, Box 118, 22100 Lund, Sweden
e-mail: lars.engstrom@fysik.lth.se
2 Lund Observatory, Lund University, Box 43, 22100 Lund, Sweden
3 Applied Mathematics and Material Science, Malmö University, 20506 Malmö, Sweden
4 Department of Physics, Stockholm University, AlbaNova University Center, 106 91 Stockholm, Sweden
Received 6 August 2014/ Accepted 1 September 2014
ABSTRACT
We report lifetime measurements of the five levels in the 3d4(a5D)5s e6D term in Cr
at an energy around 83 000 cm−1, andlog(g f ) values for 38 transitions from the investigated levels. The lifetimes are obtained using time-resolved, laser-induced fluo-rescence on ions from a laser-produced plasma. Since the levels have the same parity as the low-lying states directly populated in the plasma, we used a two-photon excitation scheme. This process is greatly facilitated by the presence of the 3d4(a5D)4p z6F levels
at roughly half the energy difference. The f -values are obtained by combining the experimental lifetimes with branching fractions derived using relative intensities from a hollow cathode lamp recorded with a Fourier transform spectrometer.
Key words.atomic data – methods: laboratory: atomic – techniques: spectroscopic
1. Introduction
This paper reports the first measurements of lifetimes for highly excited levels of even parity in Cr
. The data is obtained us-ing time-resolved, laser-induced fluorescence (TR-LIF) on ions created in a laser-produced plasma. The lowest configurations in this ion are the even parity 3d5 and 3d44s, extending up to an energy of about 50 000 cm−1 (Sansonetti et al. 2012). Toreach the new levels in the 3d4(a5D)5s e6D term at an energy around 83 000 cm−1, we have used two-photon excitation from
the low-lying even 3d4(a5D)4s a6D levels. The probability for this absorption process is greatly enhanced by the presence of 3d4(a5D)4p z6F levels at roughly half the energy difference
be-tween a6D and e6D.
All previous lifetime measurements in Cr
have focused on levels in the first excited odd configuration 3d44p, beginning at an energy of 48 000 cm−1. Measurements using the beam-foiltechnique have been reported by Pinnington et al. (1973) and Engman et al.(1975). The TR-LIF method has also been used in a number of previous studies (Schade et al. 1990; Bergeson & Lawler 1993; Pinnington et al. 1993; Nilsson et al. 2006; and Gurell et al. 2010), where the Cr+ ions were produced in a fast ion beam, in a hollow cathode, and in laser-produced plas-mas. By combining the measured lifetimes with branching frac-tions (BFs), usually obtained from intensity calibrated Fourier transform spectra, transition probabilities have been derived. For example, the most recent studies by Nilsson et al. (2006) and Gurell et al.(2010) report 119 and 145 transition probabilities, respectively, for lines from the 3d44p configuration. SeeGurell
et al. (2010) for additional references to investigations of the 4p states.
Studies of lifetimes and f -values for the transition metals are important in astrophysics, and radiative data in Cr
are of particularly interest since these lines are observed in a broadrange of stellar and nebular spectra (Andrievsky et al. 1994; and Shevchenko 1994). For example, several chemically pe-culiar stars show unexpectedly high abundances of chromium (Rice & Wehlau 1994; and López-García et al. 2001). The FERRUM project is an ongoing international collaboration to address the need for data on singly ionized iron group elements (Johansson et al. 2002).
To determine accurate abundances for high metallicity stars, lines with high excitation potential are desirable to avoid satu-ration effects. This is especially important for stars where the use of different lines yield significantly different abundances. In addition, highly excited lines such as the ones reported in this paper, can be used as probes of deviations from local thermo-dynamic equilibrium (LTE) in stellar atmospheres. With known f-values, the highly excited lines benchmark the stellar at-mospheres and aid in the determination of excitation distribu-tions (Wood et al. 2014). A search was made for the lines in HD 84937, the solar type star α Cen A and the sun (Hinkle et al. 2005; Moore et al. 1982), but the temperature and the Boltzmann factor were too small to determine an abundance us-ing these lines.
2. Laboratory measurements
2.1. Lifetimes
The TR-LIF setup at Lund High Power Laser Facility contains two Nd:YAG lasers operating at 10 Hz. The frequency dou-bled output from one of them (Continuum Surelite) is focused onto a rotating chromium target placed inside a vacuum cham-ber (residual pressure about 10−5mbar) to generate the ablation
plasma. The second laser is an injection seeded and Q-switched Continuum NY-82. The 532 nm output was temporally com-pressed using stimulated Brillouin scattering in water before
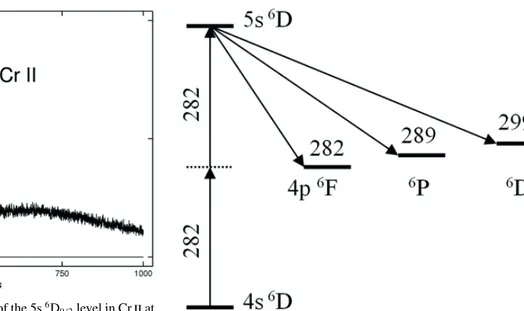
Fig. 1.TR-LIF measurement of the decay of the 5s6D
9/2level in Cr
at83 241 cm−1in a laser-produced plasma. The intense peak is the 532 nm
Nd-YAG laser used to produce the plasma. The bottom peak is the de-layed excitation laser pulse resulting in the observed fluorescence signal on top of the plasma background.
pumping a dye laser (Continuum Nd-60) using Rh 590, to op-timize the laser intensity around 565 nm. This output was then frequency doubled in a KDP crystal to obtain about 1 mJ of the 283 nm radiation needed for the two-photon excitation. Since two-photon absorption is a nonlinear process the probability is strongly dependent on the laser intensity. Thus, in addition to optimizing the laser power we carefully adjusted a quartz lens ( f = 150 mm) placed just outside the vacuum chamber to ob-tain a sharp focus in the middle of the ablation plasma a few mm above the chromium target. Since different ionization stages produced in the plasma have different velocities, they can be sep-arated by selecting an appropriate delay time between the abla-tion and the excitaabla-tion pulses. The delay time turned out to be very critical in this experiment and virtually all measurements were made with a delay of 160 ns. The laser-induced fluores-cence was detected by a 1/8 m monochromator with a 280 µm wide entrance slit oriented parallel to the excitation laser beam and perpendicular to the ablation laser. The fluorescence signal was recorded with a microchannel plate photomultiplier tube (Hamamatsu R3809U) with a rise time of 0.2 ns and digitized by a Tektronix oscilloscope with 2.5 GHz analog bandwidth. A second channel on the oscilloscope sampled the excitation laser pulse shape measured by a fast photodiode. Figure1illustrates the timing of the lasers and the fluorescence signal.
Figure2gives a schematic overview of the energy terms and transitions involved in this study and Table 1 presents the ex-perimental settings. The 3d45s e6D levels were excited by
two-photon absorption from the low-lying, metastable 3d44s a6D lev-els around 12 000 cm−1. The energy difference is thus about 70 700 cm−1, corresponding to two 282 nm photons, and the
presence of the 3d44p z6F levels close to halfway in-between (within a few 100 cm−1) greatly enhanced the two-photon
ab-sorption probability. Only∆J = 0 excitations could be observed. Since the fine structure separations in the 4s and 5s e6D terms are
essentially determined by the common 3d4 5D parent, the exci-tation wavelengths are very close (see Table1) and it was not possible to resolve the e6D
1/2and e6D3/2levels.
The most intense fluorescence channels from the 5s e6D lev-els are to 4p z6F followed by those to 4p z6P and z6D. The
transitions occur at 282, 289, and 299 nm (see Fig. 2 and
Fig. 2.Schematic term system of the 3d4(a5D)n`6L terms in Cr
in-volved in this investigation. Wavelengths for the transitions are indi-cated in nm.Table1), and were always measured in the second spectral or-der of the monochromator. In the case of the e6D
9/2 level, we
could observe the decay in all three channels, whereas for the other fine structure levels only the first two were intense enough to allow reliable measurements. In the z6F−e6D channel a minor
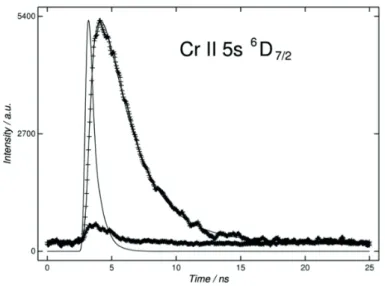
problem occurred because of the proximity of the excitation and detection wavelengths. Thus, it was not possible to completely isolate the fluorescence from the very intense excitation laser light. To compensate for this, we also measured the scattered laser light with the ablation laser turned off and subtracted this signal from the observed decay curve before the lifetime analy-sis. This is illustrated for the e6D7/2level in Fig.3. In this case,
the excitation wavelength was 282.65 nm and the detection was at 281 nm with a instrumental line width of 0.5 nm in the second spectral order.
Each decay curve as well as the temporal shape of the exci-tation pulse was averaged over 1000 laser shots. The measured excitation pulse width (FWHM) was about 3 ns, but since the e6D levels were excited in a two-photon process the final
anal-yses of the decay curves utilized the square of the measured pulse, which then had a temporal width of 2 ns. The lifetimes were extracted using a slightly modified version of the program DECFIT (Palmeri et al. 2008) by fitting the fluorescence data with a single exponential convoluted with the square of the mea-sured laser pulse and a constant background. A typical example is shown in Fig.3, where we have also included a measurement of the scattered laser light that was subtracted before the decay analysis. The final lifetimes given in Table1are the averages of between 16 and 22 measurements, performed at several different occasions. No systematic differences were found between the different detection channels. In addition, we note that the decay curves for the two unresolved levels, e6D1/2and e6D3/2, showed
no trace of a multiexponential behavior, indicating that the two lifetimes cannot be too different. The quoted uncertainties in the lifetimes include the statistical uncertainties as well as the vari-ation of the results between the repeated measurements.
Table 1 also includes theoretical lifetimes obtained by Kurucz(1995) and by Raasen & Uylings(1997). Both inves-tigations are semiempirical in the sense that the radial integrals are treated as adjustable parameters that are optimized by fitting
Table 1. Experimental details and the measured lifetimes of the 5s6D levels in Cr
.Upper levela J Lower levela J Excitationb Detectionc τ
exp/ns τth/ns 5s6D J 4s6DJ E/cm−1 E/cm−1 λ air/nm λair/nm 82 692 1/2 11 962 1/2 282.680 279 2.5 ± 0.2 2.95d, 2.83e 82 763 3/2f 12 032 3/2 2.95d, 2.85e 82 881 5/2 12 148 5/2 282.669 280 2.5 ± 0.2 2.94d, 2.84e 290 83 041 7/2 12 303 7/2 282.653 281 2.6 ± 0.2 2.94d, 2.84e 290 83 240 9/2 12 496 9/2 282.629 282 2.6 ± 0.2 2.93d, 2.86e 289 299
Notes. (a) Sansonetti et al.(2012);(b) Two-photon excitation using this wavelength;(c) Transitions at 280 nm connect to 4p z6F, those around
290 nm to 4p z6P and 299 nm to 4p z6D (see Fig.2). All measurements were made in the second spectral order;(d)Semiempirical
superposition-of-configurations calculation byKurucz(1995);(e)Semiempirical calculation using orthogonal operators byRaasen & Uylings(1997);( f )The
J= 1/2 and 3/2 fine structure levels in e6D could neither be separated in the excitation nor in the detection channels.
Fig. 3.Decay of the 5s6D
7/2level in Cr
at 83 041 cm−1followingtwo-photon excitation from the low-lying metastable 4s6D
7/2level. The
de-cay and the scattered excitation laser contribution at 281 nm are plotted with+ signs. The square of the recorded laser pulse and the fitted decay curve are shown as solid lines.
to the experimental energies. This should improve the transition energies as well as the eigenvector representations. Kurucz used a modified version of the Cowan codes (Cowan 1981), whereas Raasen & Uylings (1997) applied the orthogonal operator for-malism. There is fairly good agreement between both calcula-tions and the experimental data (13−18%), although the results byRaasen & Uylings(1997) are consistently closer to our mea-surements. Furthermore, neither the experimental nor the the-oretical lifetimes indicate any significant J-dependence of the values. We also note that while the experimental lifetimes in the 3d44p configuration are consistently longer than those calculated
byKurucz(1995) by, on the average, 37% (Nilsson et al. 2006) and 22% (Gurell et al. 2010) in the present case the situation is reversed and the experimental values are consistently shorter, by about 15%. A similar comparison between the 3d44p lifetimes
inGurell et al.(2010) and the theoretical results byRaasen & Uylings(1997) shows a perfect agreement within the error bars in all cases. 33320 33340 33360 33380 33400 0.0 0.2 0.4 0.6 0.8 1.0 Wavenumber (cm-1)
Intensity (arb. units)
z 6D 3/2 - e 6D 5/2 z 6D 7/2 - e 6D 7/2 z 4P5/2 - e 6D 7/2
Fig. 4.Part of a recorded FTS-spectrum between 33 300−33 400 cm−1,
including the Cr
lines z6D3/2− e6D5/2, z6D7/2− e6D7/2, and z4P5/2−
e6D
7/2at λλ 3000.63, 2993.54, and 2998.97 Å respectively.
2.2. Branching fractions (BFs)
The BFs were measured from spectra recorded with the Chelsea Instrument FT500 UV FT spectrometer at Lund Observatory. The light source was a Hollow Cathode (HC) discharge lamp. The HC was loaded with a pure chromium cathode and operated with neon as carrier gas at pressures between 0.5 and 2 Torr. The applied currents varied in the range 0.1−0.7 A. The best signal-to-noise (S/N) for the 4p–5s transitions was obtained at 0.7 A and 2 Torr.
The HC lamp provides an intensity stable emission spec-trum over several hours, which enabled us to perform up to 20 scans, that were co-added to give a higher S/N ratio. Figure4 shows a small part of the observed spectrum, including three Cr
lines from the investigated upper levels. All spectra were recorded between 20 000 and 40 000 cm−1, however, since the noise level in the spectrum depends on the total intensity, we limited the wavenumber coverage as much as possible. By us-ing a standard colored glass filter (UG5) and the sensitivity of the detector, a Hamamatsu PMT 1P28, the wavelength regionTable 2. Experimental and theoretical branching fractions in Cr
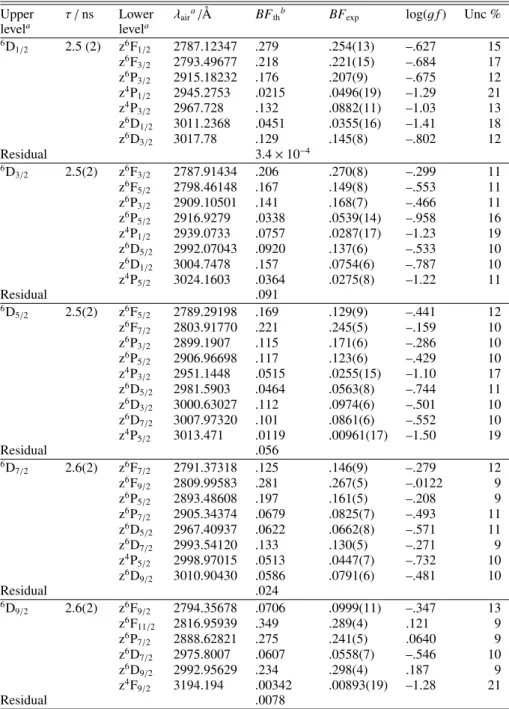
.Upper τ / ns Lower λaira/Å BFthb BFexp log(g f ) Unc %
levela levela 6D 1/2 2.5 (2) z6F1/2 2787.12347 .279 .254(13) –.627 15 z6F 3/2 2793.49677 .218 .221(15) –.684 17 z6P 3/2 2915.18232 .176 .207(9) –.675 12 z4P 1/2 2945.2753 .0215 .0496(19) –1.29 21 z4P 3/2 2967.728 .132 .0882(11) –1.03 13 z6D 1/2 3011.2368 .0451 .0355(16) –1.41 18 z6D 3/2 3017.78 .129 .145(8) –.802 12 Residual 3.4 × 10⁻⁴ 6D 3/2 2.5(2) z6F3/2 2787.91434 .206 .270(8) –.299 11 z6F 5/2 2798.46148 .167 .149(8) –.553 11 z6P 3/2 2909.10501 .141 .168(7) –.466 11 z6P 5/2 2916.9279 .0338 .0539(14) –.958 16 z4P 1/2 2939.0733 .0757 .0287(17) –1.23 19 z6D 5/2 2992.07043 .0920 .137(6) –.533 10 z6D 1/2 3004.7478 .157 .0754(6) –.787 10 z4P 5/2 3024.1603 .0364 .0275(8) –1.22 11 Residual .091 6D 5/2 2.5(2) z6F5/2 2789.29198 .169 .129(9) –.441 12 z6F 7/2 2803.91770 .221 .245(5) –.159 10 z6P 3/2 2899.1907 .115 .171(6) –.286 10 z6P 5/2 2906.96698 .117 .123(6) –.429 10 z4P 3/2 2951.1448 .0515 .0255(15) –1.10 17 z6D 5/2 2981.5903 .0464 .0563(8) –.744 11 z6D 3/2 3000.63027 .112 .0974(6) –.501 10 z6D 7/2 3007.97320 .101 .0861(6) –.552 10 z4P 5/2 3013.471 .0119 .00961(17) –1.50 19 Residual .056 6D 7/2 2.6(2) z6F7/2 2791.37318 .125 .146(9) –.279 12 z6F 9/2 2809.99583 .281 .267(5) –.0122 9 z6P 5/2 2893.48608 .197 .161(5) –.208 9 z6P 7/2 2905.34374 .0679 .0825(7) –.493 11 z6D 5/2 2967.40937 .0622 .0662(8) –.571 11 z6D 7/2 2993.54120 .133 .130(5) –.271 9 z4P 5/2 2998.97015 .0513 .0447(7) –.732 10 z6D 9/2 3010.90430 .0586 .0791(6) –.481 10 Residual .024 6D 9/2 2.6(2) z6F9/2 2794.35678 .0706 .0999(11) –.347 13 z6F 11/2 2816.95939 .349 .289(4) .121 9 z6P 7/2 2888.62821 .275 .241(5) .0640 9 z6D 7/2 2975.8007 .0607 .0558(7) –.546 10 z6D 9/2 2992.95629 .234 .298(4) .187 9 z4F 9/2 3194.194 .00342 .00893(19) –1.28 21 Residual .0078
References.(a)Sansonetti et al.(2012);(b)Raasen & Uylings(1997).
was thus restricted to 26 000−36 000 cm−1(277−375 nm). The spectra were intensity calibrated using a Deuterium lamp with known relative spectral radiance measured at the Physicalisch-Technische Bundesanstalt, Berlin, Germany. The spectral lines were fitted with Gaussian profiles to determine the integrated intensity and its uncertainty using the free and available soft-ware GFit (Engström 1998).
The measured intensities were converted to BFs through:
BFik= Iik/ΣnIin, (1)
where Iikis the calibrated intensity of a transition from the upper
level i to a lower level k, and the sum is the total intensity for all lines coming from level i. Lines too weak to be measured in the spectra were included in the sum using the theoretical
branching fractions from Raasen & Uylings (1997). Table 2 presents experimental and theoretical BFs together with log(g f ) values obtained by combining the measured BFs with the exper-imental lifetimes in Table1. The quantity denoted “residual” in Table2 is the sum of the BFs taken from the theoretical cal-culations by Raasen & Uylings (1997) for lines too weak to be observed. In general, the weak missing branches fall in the visible part of the spectrum, with a maximum residual of 9.1% for the6D
3/2 level. The uncertainty in the BFs includes
contri-butions from the intensity measurements and calibration, and a 50% estimated uncertainty in the residual. The uncertainty in the log(g f )-values is derived by adding the uncertainty of the mea-sured lifetimes. Further discussion concerning error analyses can be found inSikström et al.(2002).
3. Summary
In this paper, we report an experimental study of the decay of the most highly excited levels in Cr
investigated so far. These levels, at about 60% of the ionization energy, should be possible to use as probes of deviations from local thermodynamic equi-librium (LTE) in stellar atmospheres and aid in the determina-tion of excitadetermina-tion distribudetermina-tions. The data consists of the lifetimes of the five levels in the 3d4(a5D)5s e6D term and log(g f )val-ues for 38 transitions from the investigated levels. The results are obtained by combining lifetime measurements, using the TR-LIF technique with two photon excitation, and branching fractions derived using relative intensities from a hollow cath-ode lamp recorded with a Fourier transform spectrometer.
Acknowledgements. We acknowledge Chris Sneden and Matthew Alvarez, (University of Texas) and their effort to model the present lines in the metal-poor star HD 84937. This work was supported by the Swedish Research Council through the Linnaeus grant to the Lund Laser Centre and the Knut and Alice Wallenberg Foundation. H.H. gratefully acknowledges the grant no 621-2011-4206 from the Swedish Research Council.
References
Andrievsky, S. M., Kovtyukh, V. V., & Usenko, A. 1994, A&A, 281, 465 Bergeson, S. D., & Lawler, J. E. 1993, ApJ, 408, 382
Cowan, R. D. 1981, The Theory of Atomic Structure and Spectra (Berkeley Univ. of California Press)
Engman, B., Gaupp, A., Curtis, L. J., & Martinsson, I. 1975, Phys. Scripta, 12, 220
Engström, L. 1998, Lund Reports in Atomic Physics (LRAP-232), Atomic Physics, Lund University,http://kurslab-atom.fysik.lth.se/Lars/ GFit/Html/index.html
Gurell, J., Nilsson, H., Engström, L., et al. 2010, A&A, 511, A68
Hinkle, K., Wallace, L., Valenti, J., & Ayres, T. 2005, Ultraviolet Atlas of the Arcturus Spectrum, 1150-3800 A (San Francisco: ASP)
Kurucz, R. L. 1995, Atomic spectral line data from CD-ROM No. 23, http://www.cfa.harvard.edu/amp/ampdata/kurucz23/sekur.html Johansson, S., Derkatch, A., Donnelly, M., et al. 2002, Phys. Scripta, T100, 71 López-García, Z., Adelman, S. J., & Pintado, O. I. 2001, A&A, 367, 859 Moore, C. E., Tousey, R., & Brown, C. M. 2005, The solar spectrum 3069-2095
angstroms from the echelle spectrograph flown in 1961 and 1964 (Interim Report Naval Research Lab., Washington, DC. Center for Space Research) Nilsson, H., Ljung, G., Lundberg, H., & Nielsen, K. E. 2006, A&A, 445,
1165
Palmeri, P., Quinet, P., Fivet, V., et al. 2008, Phys. Scripta, 78, 015304 Pinnington, E. H., Lutz, H. O., & Carriaveao, G. W. 1973, Nucl. instrum.
Methods, 110, 55
Pinnington, E. H., Ji, Q., Guo, B., et al. 1993, Can. J. Phys., 71, 470 Raasen, A. J. J., & Uylings, P. H. M. 1997, unpublished data available at:
ftp://ftp.wins.uva.nl/pub/orth/chromium Rice, J. B., & Wehlau, W. H. 1994, A&A, 291, 825
Sansonetti, C. J., Nave, G., Reader, J., & Kerber, F. 2012, ApJSS, 202, 15 Schade, W., Mundt, B., & Helbig, V. 1990, Phys. Rev. A, 42, 3
Shevchenko, V. S. 1994, Astron. Zh., 71, 572
Sikström, C. M., Nilsson, H., Litzén, U., Blom, A., & Lundberg, H. 2002, J. Quant. Spectr. Rad. Transf., 74, 355