Full Terms & Conditions of access and use can be found at
http://www.tandfonline.com/action/journalInformation?journalCode=zjom20
ISSN: (Print) 2000-2297 (Online) Journal homepage: http://www.tandfonline.com/loi/zjom20
Changes in oral microbiota due to orthodontic
appliances: a systematic review
Alessandra Lucchese, Lars Bondemark, Marta Marcolina & Maurizio
Manuelli
To cite this article:
Alessandra Lucchese, Lars Bondemark, Marta Marcolina & Maurizio Manuelli
(2018) Changes in oral microbiota due to orthodontic appliances: a systematic review, Journal of
Oral Microbiology, 10:1, 1476645, DOI: 10.1080/20002297.2018.1476645
To link to this article: https://doi.org/10.1080/20002297.2018.1476645
© 2018 The Author(s). Published by Informa
UK Limited, trading as Taylor & Francis
Group.
Published online: 03 Jul 2018.
Submit your article to this journal
Article views: 281
REVIEW ARTICLE
Changes in oral microbiota due to orthodontic appliances: a systematic
review
Alessandra Lucchese
a,b, Lars Bondemark
c, Marta Marcolina
a,band Maurizio Manuelli
a,ba
Department of Orthodontics, Vita Salute San Raffaele University, Milan, Italy;
bUnit of Dentistry, Division of Orthodontics, Research area
in Dentofacial Orthopedics and Orthodontics, IRCCS San Raffaele Scientific Institute, Milan, Italy;
cDepartment of Orthodontics, Faculty
of Odontology, Malm
ő University, Malmő, Sweden
ABSTRACT
Background: Oral microbiota has been at the center of cultural attention in recent years. In
daily clinical practice, orthodontic appliances may be associated with an increased cariogenic
risk and a worsening of preexisting periodontal diseases.
Objective: The purpose of this review is to investigate the available evidence regarding the
association between orthodontic appliances and changes in the quality and quantity of the
oral microbiota.
Design: The research included every article published up to October 2017 featuring the
keywords
‘Orthodontic appliance* AND (microbiological colonization OR periodontal
patho-gen* OR Streptococcus mutans OR Lactobacillus spp. OR Candida OR Tannerella forsythia OR
Treponema denticola OR Fusobacterium nucleatum OR Aggregatibacter actinomycetemcomitans
OR Prevotella intermedia OR Prevotella nigrescens OR Porphyromonas gingivalis)
’ and was
conducted in the major medical databases. The methodological quality of selected papers
was scored using the
‘Swedish Council on Technology Assessment in Health Care Criteria for
Grading Assessed Studies
’ (SBU) method.
Results: Orthodontic appliances influence the oral microbiota with an increase in the counts
of S. mutans and Lactobacillus spp. and in the percentage of potentially pathogenic
gram-negative bacteria.
Conclusions: There is moderate/high evidence regarding the association between
orthodon-tic appliances and changes in the oral microbiota.
PROSPERO registration number CRD42018091589.
ARTICLE HISTORY Received 27 February 2018 Accepted 11 May 2018 KEYWORDS
Oral microbiota; biomaterial science; orthodontic appliances;
periodontopathic bacteria; caries bacteria
Introduction
Periodontal health is crucial and requires special
attention when performing an orthodontic
treat-ment plan, both in adult and pediatric patients
[
1
]. Preserving the integrity of periodontal tissues
is one of the main concerns of orthodontics
spe-cialists, which has led to the definition of specific
hygiene protocols for orthodontic patients [
2
].
Since 1985, the scientific community has been
very concerned about the interaction between
orthodontic devices and oral bacteria [
3
,
4
]; in fact,
the first studies to analyze the oral microbiota and
conventional braces (CB) took place in this period.
In 2012, Freitas et al. published a systematic review
regarding the alteration of the oral microbiota
caused by fixed appliances [
5
]. The authors
con-cluded that
‘The literature revealed moderate
evi-dence that the presence of fixed appliances
influences the quantity and quality of oral
micro-biota’. However, the authors included papers that
analyzed bacteria from appliance surfaces and from
oral mucosa, without distinction.
Furthermore, a significant number of studies have
been published since 2012. Our review aims to update
the research of Freitas et al., focusing on studies that
have analyzed the microbiota collected from oral sites
and not directly from appliances, and including all
appliance
types
(self-ligating
braces,
invisalign
aligners, sports-mouthguards, and other removable
appliances) and not only fixed appliances.
Thus, the clinical research questions were as follows:
●
Do orthodontic appliances influence the quality
and quantity of the oral microbiota?
●
What are the effects of orthodontic devices on
the different bacterial species in the oral cavity?
Materials and methods
A search of the keywords Orthodontic appliance*
AND (microbiological colonization OR periodontal
pathogen* OR Streptococcus mutans OR Lactobacillus
spp. OR Candida OR Tannerella forsythia OR
Treponema denticola OR Fusobacterium nucleatum
OR
Aggregatibacter
actinomycetemcomitans
OR
CONTACT Alessandra Lucchese lucchese.alessandra@hsr.it Alessandra Lucchese Associate Professor in Orthodontics, Department of Orthodontics, Unit of Dentistry, IRCCS San Raffaele Scientific Institute, Vita Salute, San Raffaele University, Via Olgettina 48, 20132 Milano, Italy© 2018 The Author(s). Published by Informa UK Limited, trading as Taylor & Francis Group.
This is an Open Access article distributed under the terms of the Creative Commons Attribution License (http://creativecommons.org/licenses/by/4.0/), which permits unrestricted use, distribution, and reproduction in any medium, provided the original work is properly cited.
Prevotella intermedia OR Prevotella nigrescens OR
Porphyromonas gingivalis) was conducted in PubMed,
PMC, Scopus, Lilacs, Scielo, Cochrane Trial Library,
Web of Science. All articles published up to October
2017 were included. The Preferred Reporting Items for
Reporting Systematic reviews and the Meta Analyses
protocol were adopted for this systematic review [
6
].
During the first phase, all the articles were
selected by title and abstract by two of the
authors and duplicate exclusion was performed.
In the next phase, the full texts of potentially
relevant papers were evaluated to determine if
they met the eligibility criteria. Articles were
selected on the basis of the criteria listed in
Table 1
. The article selection process is illustrated
in
Figure 1
. Discussions were held to resolve any
disagreements; when a resolution could not be
found, a third review was consulted. Data
extrac-tion from the selected papers was performed
independently
by
two
review
authors
who
adopted a template similar to that of Freitas
et al. [
5
]. The template was adapted to the
neces-sities of our study and is shown in
Table 2
[
5
].
Extracted data included first author, year of
publication, study design, sample size, age of the
patients, type of appliance analyzed, collection
time of the study, collection methods, microbial
analysis methods, and quality of the study.
Quality analysis
The methodological quality is
‘the extent to which the
design and conduct of a study are likely to have
prevented systematic errors (bias)’. Variation in
qual-ity can explain variation in the results of studies
included in a systematic review. More rigorously
designed (better
‘quality’) trials are more likely to
yield results that are closer to the
‘truth’ [
7
].
The methodological quality of selected papers
was
scored
using
the
‘Swedish Council on
Technology Assessment in Health Care Criteria
for Grading Assessed Studies
’ (SBU) method,
which was also used to assess the level of
evi-dence for the conclusions of this review. The
SBU method divided the methodological quality
of the articles into three grades: grade A
– high
value of evidence, grade B
– moderate value of
evidence, and grade C
– low value of evidence;
once a score had been assigned to each study, the
review
’s level of evidence was stated in four
grades: grade 1
– strong scientific evidence (at
least two studies assessed at level A), grade 2
–
moderate scientific evidence (one level A study
and at least two studies at level B), grade 3
–
limited scientific evidence (at least two studies at
level B), and grade 4
– insufficient scientific
evi-dence (fewer than two studies at level B)
(
Table 3
–
4
) [
8
].
Results
From the initial 588 articles, 51 were selected [
3
,
4
,
9
–
57
].
Quality of evidence
In 37 of the 52 articles presented with moderate
methodological
quality
[
9
–
21
,
24
–
26
,
28
,
29
,
31
–
33
,
35
–
39
,
41
–
46
,
51
–
53
,
56
,
57
], the major concern
was the absence of repeatability tests. One article
had a high quality [
40
] and the remaining 13
papers were classified as having a low quality
[
3
,
4
,
22
,
23
,
27
,
30
,
34
,
47
–
50
,
54
,
55
]. Due to the lack
of homogeneity in the study settings, a
meta-ana-lysis could not be applied and a systematic review
realized.
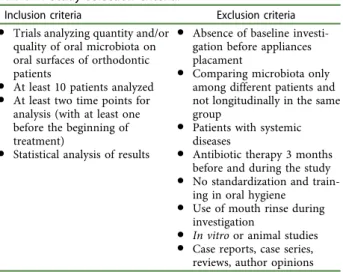
Table 1.
Study selection criteria.
Inclusion criteria Exclusion criteria
● Trials analyzing quantity and/or quality of oral microbiota on oral surfaces of orthodontic patients
● At least 10 patients analyzed
● At least two time points for analysis (with at least one before the beginning of treatment)
● Statistical analysis of results
● Absence of baseline investi-gation before appliances placament
● Comparing microbiota only among different patients and not longitudinally in the same group
● Patients with systemic diseases
● Antibiotic therapy 3 months before and during the study
● No standardization and train-ing in oral hygiene
● Use of mouth rinse during investigation
● In vitro or animal studies
● Case reports, case series, reviews, author opinions
Records identified through database searching (n =588) Screening Included Eligibility Identification
Additional records identified through other sources
(n =0)
Records after duplicates removed (n =514)
Records screened (n =514)
Records excludedbecause not relevant to the subject
(n = 441)
Full-text articles assessed for eligibility
(n =73)
Full-text articles excluded, case reports, case series, reviews, Authors’debates, abstract (n = 8) Studies included in qualitative synthesis (n =51)
Full-text articles excluded, non-human studies, in
vitro studies (n = 14) Full-text articles assessed
for eligibility (n =65)
Table
2.
Characteristics
of
studies
included
in
the
review.
Participants Collection time Reference Study design Sample size (male/female) Groups Age Appliance T0 T1 T2 T3 T4 Collection methods Microbial analysis methods Quality of the study Al-Anezi [9] RCT (cross- arch) 24 1 Mean: 12.6 years ± 1.01 month SL braces + elastomeric modules Before bonding 3 months Sterile paper points from the lateral incisors ligated with and without elastomeric modules PCR + DGGE B Alves et al. [10] RCT (split mouth) 14 (6 M/8 F) 1 Mean: 17 years ± 2.6 months CB/Steel ligatures vs. CB/ elastomeric rings Before bonding 6 months Sterilized periodontal curette 2 mm supragingival and 2 mm subgingival PCR B Arab et al. [12] Prospective study 30 (6 M/24 F) 1 12 –18 years CB Before bonding 6 weeks 12 weeks 18 weeks Saliva collected by spitting into a sterile test tube for 10 min Number CFU/ml was quantified B Arikan et al. [11] RCT 38 (20 M/18 F) 2 G1 (fixed): 9 M/ 10 F G2 (removable): 11 M/8 F 4– 10 years Fixed and removable space maintainers Before appliance of maintainers 1 month 3 months 6 months Sterile foam pads soaked in Sabouraud ’s broth on six mucosal surfaces Candida : colonies were counted separately for each site by visual examination and expressed as CFU/ mm 2 E. faecalis : counted macroscopically based on characteristic gram-stain morphology and recorded as CFU/ml of the original saliva sample B Arslan et al. [13] Prospective study 42 (23 F/19 M) 1 Mean: 19.8 years CB 1 month before bonding 1 month 6 months 12 months Samples taken from saliva, enamel surfaces of U5 and L5, and U1, and L1 adjacent to the braces with sterile wooden toothpicks (at T0 samples only from saliva and not from the teeth) Candida identi fied by gram-staining, a germ-tube test, chlamydospore, and an API 20C AUX system (Bio-Mérieux, Marcyl ’Etoile, France). Candida colonies on the plates were counted B Baka et al. [14] RCT (split mouth) 20 (20 M) 2 G1: SL braces G2: CB Mean: 14.2 years ± 1.5 months SL braces vs. CB/steel ligature Before bonding 1 week 3 months Sterilized curettes from the labial surfaces of U2 and L2 left and right DNA extracted from supragingival plaque samples (Dneasy blood and tissue kit) + real-time PCR B(Continued
Table
2.
(Continued).
Participants Collection time Reference Study design Sample size (male/female) Groups Age Appliance T0 T1 T2 T3 T4 Collection methods Microbial analysis methods Quality of the study Demling et al. [15] Prospective study 10 (8 F/2 M) 1 Mean: 29.0 years ± 4.7 months Lingual braces Before bonding 3 months Samples of gingival crevicular fluid taken using sterile paper points. Buccal and lingual sites of U6 and L6, U4 and L4, U1 and L1. In extraction cases, the U5 and L5 instead of the U4 and L4 PCR B Demling et al. [16] Prospective study 20 (6 M/14 F) 1 Mean: 22.3 years ± 8.6 months Lingual braces Before bonding 4 weeks Gingival crevicular fluid taken with sterile paper points at labial and lingual sites of U6 and L6, U4 and L4, and U1 and L1. In extraction cases, U5 and L5 instead of U4 and L4 DNA extracted with a QIAmp DNA Mini Kit + PCR B D’ Ercole et al. [17] Prospective study 60 (27 M/33 F) 1 Mean: 9.9 years ± 1.2 months Sport mouthguards Before mouthguard 6 months 1 year 6 months without Stimulate saliva with paraffin wax to chew and saliva collected for 5 min in a measuring cup CFUs of SM counts per milliliter of saliva (CFU/ml) GC saliva-check mutans (GC Corp., Belgium) B Farhadian et al. [18] RCT 66 2 G1:Conventional removable retainers
G2:
Removable retainers containing silver nanoparticles
Age ≤ 25 years Conventional removable retainers vs. removable retainers containing silver nanoparticles 1 week after debonding 7 weeks after retainer delivery Swab samples were taken from the maxillary palatal side Number of SM CFU was counted with a digital colony counter B Forsberg et al. [19] RCT (splith mouth) 12 (6 M/6 F) 1 12 –14 years Ligature wires vs. elastomeric rings (CB) 1 week before bonding Before bonding 4 weeks 10 weeks T4: 19 weeks T5: 34 weeks T6: 61 weeks T7: 6 weeks after removal Stimulated saliva samples, plaque samples collected with charcoaled points from U2 CFU count of SM and LB B
(Continued
Table
2.
(Continued).
Participants Collection time Reference Study design Sample size (male/female) Groups Age Appliance T0 T1 T2 T3 T4 Collection methods Microbial analysis methods Quality of the study Ghijselings et al. [21] Prospective study 24 (10 M/14 F) 2 G1: 10 (4 M/6 F) braces only G2: 14 additionally treated with a headgear Mean: 14.6 years ± 1.1 months CB vs. CB + headgear Tb G1: Bonding time G2: 18 weeks before G1 Braces removal 3 months follow-up 2 years follow-up Supragingival plaque: removed by means of sterile curettes. Subgingival plaque: six sterile medium paper points inserted per site (three mesially and three distally) and kept in place for 10 s Total number of, respectively, anaerobic and aerobic CFU was counted. Speci fic black-pigmented colonies on a nonselective anaerobic plate were counted B Hägg et al. [22] Prospective study 27 (13 M/14 F) 1 Mean: 15.5 years ± 2.3 months CB Before bonding Examined 3 times during a 3-month follow-up Examined 3 times during a 3-month follow-up Examined 3 times during a 3-month follow-up Imprint culture: sterile plastic foam pads dipped in Sabouraud ’s broth and placed on the dorsum of the tongue. Oral rinse. Pooled plaque Imprint culture Candidal: visual counting CFU Yeats: gram-stain, germ tube test, and the API 20C AUX assimilation test Oral rinse: Candida and Enterobacteriaceae : CFU Pooled plaque: Candida and Enterobacteriaceae : CFU C Hernández-Solis et al. [23] Prospective study 60 1 4– 10 years Orthodontic appliance Before appliance 6 months Samples taken with a sterile swab rubbed over: oral mucosa and the back of the tongue PCR C Ireland et al. [24] RCT (split mouth) 24 1 11 –14 years SL braces + bands + bonded molar tubes to contralateral quadrants of the mouth + elastomeric ligature on one U2 bracket Pre-bond-up at the molar separator appointment 3 months Just prior of debonding 3 months post-debond 1 y post-debond Supragingival plaque samples: on molars (bands and bonds) using sterile curettes and subgingivally using sterile paper points U2 (with or without elastomeric ligation): supragingival plaque collected adjacent to the bracket margins PCR + microarray hybridization B Jurela et al. [25] Prospective study 32 2 G1: 16 CB G2: 16 esthetic braces 13 –30 years CB vs. esthetic plastic braces Before bonding 12 weeks Saliva samples PCR + cultivation method B(Continued
Table
2.
(Continued).
Participants Collection time Reference Study design Sample size (male/female) Groups Age Appliance T0 T1 T2 T3 T4 Collection methods Microbial analysis methods Quality of the study Kim et al. [26] Prospective study 30 1 Mean: 16.7 years ± 6.5 months CB Before bonding 1 week 3 months 6 months Sterile paper points from the distobuccal gingival crevice of the left U1, the left L1, the mesiobuccal gingival crevice of the left U6, and the left L6 PCR B Kupietzky et al. [27] Prospectivestudy (case control)
64 2 G1: 32 braces G2: 32 control 12 –15 years CB G1: Before bonding G2: 2 months before G1 2 months Salivary collection and bacterial culture followed manufacturer ’s instructions LB and SM CFU were compared with standard densities C Lara-Carrillo et al. [28] Prospective study 30 (11 M/19 F) 1 M mean: 16.5 years ± 3.7 months F mean: 16.5 years ± 5.5 months CB Before bonding 1 months Canine retraction (placement of elastic chain in mouth) Anterior segment retraction (placement of closing loops in mouth) Buccal surface of U6, collected with a Q-tip Dentocult-SM + Dentocult-LB B Lara-Carrillo et al. [29] Prospective study 34 (14 M/20 F) 1 Mean: 16.7 years ± 5.2 months CB Before bonding 1 month Unstimulated saliva from inner mucosa Stimulated saliva by chewing Sterilized cotton swab on U6 SM: Dentocult® SM LB: Dentocult® LB B Leung et al. [30] Prospective study 27 (14 M/13 F) 1 Mean: 14.9 years CB Before bonding At least 4 weeks after (mean 7 weeks) BEC: sterile cytologic brushes on both cheeks. Plaque samples were obtained on the buccal surfaces of the 4-s premolars. Supragingival and subgingival plaque: removed with a sterile periodontal curette PCR + FISH C Levrini et al. [31] RCT 77 (52 F/25 M) 3 G1: Invisalign G2: CB G3: Control Mean: 24.3 years Invisalign CB Begin of the teatment 1 month 3 months Sterile paper point into the deepest part of the gingival sulcus for 30 s. Sites: U6 right (Site 0) and U1 left (Site 1) Real-time PCR B Liu et al. [32] Prospective study 17 1 Mean: 12.6 years CB Before bonding 1 month 3 months 6 months Sterile probe passed along the supragingival smooth surface of the upper right teeth Levels of total viable count, total Streptococci and SM in dental plaque + AP-PCR B
(Continued
Table
2.
(Continued).
Participants Collection time Reference Study design Sample size (male/female) Groups Age Appliance T0 T1 T2 T3 T4 Collection methods Microbial analysis methods Quality of the study Lombardo et al. [33] RCT 20 (15 F/5 M) 2 G1: 10 (8 F/2 M) CB G2: 10 (7 F/3 M) lingual braces G1: Mean: 19.3 years ± 3.6 months G2: Mean: 22.3 years ± 3.2 months CB vs. lingual braces Before bonding 4 weeks 8 weeks Stimulated saliva collected by chewing paraffin gum for 5 min and expectorating into a sterile cup Colonies were counted B Maret et al. [34] Prospectivestudy (case control)
95 (56 F/39 M) 2 G1 (32 F/16 M): 48 CB G2 (24 F/23 M): 47 control 12 –16 years CB vs. control Before bonding 6 months Stimulated saliva samples: chewing paraffin wax until 2 ml of saliva had been collected Salivary SM and LB: Dentocult® SM strips and Dentocult® LB method C Mattingly et al. [3] Prospective study 10 (6 M/4 F) 1 12 –25 years CB T0 –T1 –T2: Three visits before bonding (distance of 10 days) T3 –T4 –T5: Three visits after bonding (distance of 10 days) Plaque samples collected with a sterile dental explorer between bracket base and the gingival margin SM CFU count C Miura et al. [35] RCT 40 2 G1: 20
Fluoride-releasing elastomeric ligature
ties
G2:
20 Conventional elastomeric ligature
ties 12 –20 years Fluoride-releasing elastomeric ligature ties vs. conventional elastomeric ligature ties Before ligature Ligature 7 days 14 days 28 days Saliva and plaque samples. A sterilized curette was used to collect plaque samples from the area surrounding the ligature ties of the right U2, left U5, left L3, and right L5 Number of SM CFU B Nalçac ı et al. [36] Prospective study 46 (14 F/22 M) 2 G1: 23 (11 F/12 M) SL braces G2: 23 (13 F/10 M) CB 11 –16 years SL braces vs. CB Before bonding 1 week 5 weeks Microbial samples taken from the buccal surfaces of all bonded teeth Number of colonies determined under a stereomicroscope B Ortu et al. [56] Prospective study 30 (15 M/15 F) 3 G1: 10 RPE G2: 10 McNamara expander G3: 10 Controls 6– 9 years RPE vs. McNamara expander vs. controls Before initiation of expansion therapy 3 months 6 months Whole stimulated saliva, stimulated with paraffin-based sticks CFU of SM and LB B Pandis et al. [38] RCT 32 2 G1: CB G2: SL braces Mean: 13.6 years CB ligated with conventional elastomeric modules vs. SL braces Before bonding 2– 3 months Collect saliva in the mouth and to expectorate into a chilled empty petri dish approximately 3 ml of saliva Salivary SM and total bacteria were enumerated and analyzed after growth in culture B
(Continued
Table
2.
(Continued).
Participants Collection time Reference Study design Sample size (male/female) Groups Age Appliance T0 T1 T2 T3 T4 Collection methods Microbial analysis methods Quality of the study Paolantonio et al. [39] Prospectivestudy (splith mouth)
24 (11 M/13 F) 1 18 –22 years CB in one dental arch vs. control sites Before bonding 4 weeks 8 weeks 12 weeks (removal) 4 weeks after removal Supragingival plaque: sterile curette subgingival plaque: insertion of three sterile paper points at the deepest part of each gingival sulcus. Sites: mesiobuccal sites of U6 –L6 and distobuccal sites of U2 –L2 in both dental arches Agar plates examined for presence of Aa. Definitive identification made on the basis of the methods: Gram-stain, nitrate reduction, production of catalase, urease and indole, growth on MacConkey agar, and fermentation reactions to carbohydrates B Pejda et al. [40] RCT 38 (13 M/25 F) 2 G1: 19 (7 M/12 F) SL braces G2: 19 (6 M/13 F) CB Mean: 14.6 years ± 2.0 months SL braces vs. CB Before bonding 6 weeks 12 weeks 18 weeks Subgingival plaque samples were obtained at 18 weeks (T3). Supragingival plaque: removed with a probe. Subgingival plaque: collected with a sterile paper point from the periodontal sulcus. Sites: U6 right, U1, U4 left, L6 left, L1 right, L4 left Micro-Dent test+ PCR B Pellegrini et al. [41] RCT (split mouth) 14 (12: full appliances, 2: on maxillary arch only) 1 11.7 –17.2 years SL braces vs. CB with elastomeric ligatures Before bonding 1 week 5 weeks Plaque specimens collected from labial surfaces surrounding the brackets of U2 and L2 with a sterilized dental scaler. Saliva collection: chewing gum-shaped paraffin wax tablet chewed for 1– 5 min Total oral Streptococci: mitis salivarius agar Bacterial count Determination of ATP-driven bioluminescence with the Bac-Titer Glo Microbial Cell Viability Assay Kit A
(Continued
Table
2.
(Continued).
Participants Collection time Reference Study design Sample size (male/female) Groups Age Appliance T0 T1 T2 T3 T4 Collection methods Microbial analysis methods Quality of the study Perinetti et al. [42] Prospective study 21 (11 F/10 M) 1 Mean: 17.1 years ± 3.3 months CB Before bonding 28 days Subgingival plaque and GCF: three 30 standardized sterile paper strips inserted 1 mm into the gingival crevice. Mesial and distal tooth sites: U3 test (DC), its contralateral (CC), and antagonist (AC) used as controls. CC included in the orthodontic appliance, but not subjected to the orthodontic force; AC free from any appliance. Aa colonization was determined by culture methods, while ALP and AST activities were evaluated spectrophotometrically B Peros et al. [43] Prospective study 23 1 12 –17 years CB + bands + wire ligatures Before bonding 6 weeks 12 weeks 18 weeks Chewed bilaterally a piece of paraffin wax Salivary analysis: Cultura incubator and a CRT bacteria test kit for SM and LB B Ristic et al. [44] Prospective study 32 (13 M/19 F) 1 12 –18 years CB + bands TX: First appointment T0: 3 weeks before bonding 1 month 3 months 6 months Two sterile paper points in to the deepest part of gingival sulcus. Sites: mesio-vestibular points of subgingival sulcus of: U6 right, U1 left, and U4 left. If one was missing, adjacent tooth from the same group was used Semiquantative determination of anaerobe colonies using direct counting and density comparison. Subculturing, gram-stain, and identification tests of biochemical reactions: for identification of bacteria species B Ristic et al. [45] Prospective study 32 (13 M/19 F) 1 12 –18 years CB + bands Before bonding 1 month 3 months 6 months Two sterile paper points in to the deepest part of gingival sulcus. Sites: mesio-vestibular points of subgingival sulcus of: U6 right, U1 left, and U4 left. If one was missing, adjacent tooth from the same group was used Colonies of bacteria were counted. Subculturing, gram-stain, and identi fication tests of biochemical reactions: used for identi fication of bacterial species B(Continued
Table
2.
(Continued).
Participants Collection time Reference Study design Sample size (male/female) Groups Age Appliance T0 T1 T2 T3 T4 Collection methods Microbial analysis methods Quality of the study Sfondrini et al. [46] RCT (split mouth) 20 (6 M/14 F) 1 Mean: 23.8 years Buccal and lingual braces (same braces) vs. control Before bonding 1 day 7 days 30 days Microbiological samples from the brackets and the teeth. Supragingival dental plaque: sterile curettes Total CFU, SM CFU, and anaerobe CFU were measured B Shukla et al. [47] RCT 60 1 15 –25 years CB Before bonding 2 months 3 months Plaque samples collected with sterile cotton swab sites: buccal and labial aspects of the anterior teeth and four first molars Counts of SM were determined by using Dentocult SM kit B Shukla et al. [58] RCT 60 1 13 –18 years CB Before bonding 2 months 3 months Plaque samples collected with sterile cotton swab sites: buccal and labial aspects of the anterior teeth and four first molars Counts of SM were determined by using Dentocult SM kit Candida cultured on Sabouraud ’s dextrose agar B Sinclair et al. [4] RCT 13 (5 M/8 F) 1 Mean: 14 years ± 1 month CB + bands Before bonding 1 year Subgingival plaque samples collected with a stainless steel orthodontic wire sites: U1 –L1 and U6 –L6 right Mean counts for the triplicate plates of the five types of medium used C Sudarevi ć et al. [48] Prospective study 22 (12 F/10 M) 1 Mean: 25.09 years ± 4.36 months CB + elastomeric ligatures Before bonding 12 weeks Chewing paraffin wax followed by saliva collection PCR for SM and S. sobrinus C Thornberg et al. [49] Prospective study 190 (47% M/ 53% F) 1 13.6 years CB Before bonding 6 months 12 months >12 months ≈ 3 months after removal Subgingival plaque samples: sterile paper points. Sites: Mesial U6 right, distal U1 right, mesial L6 left, distal l1 left, mesial L4 right (if extracted mesial L5) DNA probe tecnique C Topaloglu et al. [50] Prospective study 69 (31 F/38 M) 2 G1: 34 Removable G2: 35 CB 6– 17 years CB vs. removable appliance Before appliance 1 month 3 months 6 months Samples of unstimulated saliva Numbers of CFU per plate were counted. C Torlakovic et al. [51] Prospective study 20 (8 M/12 F) 1 Mean: 12 years ± 1 month CB Before bonding 4 weeks 3 months 5 months Supragingival plaque samples collected using a sterile Gracey curette Sites: Labial surface of U1 right and left PCR + HOMIM C Turkkahraman et al. [52] RCT (split mouth) 21 (12 F/9 M) 1 (Two subgroups: G1: Elastomeric G2: Ligature wires) Mean: 15.37 years ± 3.76 months CB + elastomeric rings vs. ligature wires Before bonding 1 week 5 weeks Microbial samples from labial surfaces of U5 Colonies were counted under a stereomicroscope B(Continued
Table
2.
(Continued).
Participants Collection time Reference Study design Sample size (male/female) Groups Age Appliance T0 T1 T2 T3 T4 Collection methods Microbial analysis methods Quality of the study Türköz et al. [53] Prospective study 24 1 14 –20 years CB and thermoplastic retainers in the retention period After debonding 15 days 30 days 60 days Spit about 5 ml of saliva into 50-ml sterile tubes. Plaque samples collected with sterile swabs from gingival margin and enamel surface of each tooth at vestibule and palatal-lingual sides Total viable SM and LB colonies were counted – means of CFUs per milliliter of volume (CFU/ml) B Uzuner et al. [54] RCT 40 (29 F/11 M) 2 G1: 20 CB G2: 20 SL braces 14 –16 years CB + steel wire ligature vs. SL braces Before bonding 1 month Microbial samples were collected from the stimulated saliva and the plaque from the labial surfaces of the U2 –L2, immediately surrounding the orthodontic brackets with a dental scaler To estimate the number of CFUs of SM and LB, Dentocult SM and LB kits were used B Van Gastel etal. [20] Prospective study 24 (10 M/14 F) 2 G1 (headgear): 14 (6 M/8 F) G2 (braces only): 10 (4 M/6 F) Mean: 14.6 years ± 1.1 month Headgear + bands + CB vs. CB Tb G1: 18 weeks before G2 G2: Bonding time T52 1 years Periopaper absorbent strips into the sulcus for 30 s. The mesiobuccal and distobuccal sites of the U4 and U6 right were sampled. In the headgear group, U6 was banded, and U4 was bonded; the samples were analyzed separately Total numbers of anaerobic and aerobic colony CFUs were counted. Pure cultures were identi fied by biochemical tests (including N -acetylb-D -glucosaminidase, α-glucosidase, α -galactosidase, α-fucosidase, esculine, indole, and trypsin activity) B Wichelhaus et al. [55] Prospective study 11 1 Mean: 12.7 years CB Before bonding 4 weeks 12 weeks Plaque removed from dental surfaces using a sterile curette. Sites: incisors, premolars and molars PCR – 13C urea breath tests for HP – Dentocult® SM – Dentocult® LB C Zheng et al. [56] RCT 50 (23 M/27 F) 1 Mean = 13.6 years CB Before bonding 1 month 2 months 3 months 6 months Gargle method Samples cultured in CHROMagar Candida identi fication. Different Candida strains identi fied based on the color of the colonies + PCR C RCT: Randomized clinical trial; NS: non significant; SLB: self-ligating braces; PCR: polymerase chain reaction; DGEE: denaturing gradient gel ele ctrophoresis; FISH: fluorescent in situ hybridization; AP-PCR: PCR with arbitrary primers; CFU/ml: colony-forming units per milliliter; Aa: Aggregatibacter actinomycetemcomitans ; Tf: Tannerella forsythia ; Pg: Porphyromonas gingivalis ; Pi: Prevotella intermedia ; Pn: Prevotella nigrescens ; SM: Streptococcus mutans ; LB: Lactobacillus spp.; HP: Helicobacter pylori ; FOA: fixed oral appliance; U1: upper central incisor; L1: lower central incisor; U2: upper lateral incisor; L2: lower lateral incisor; U3: upper can ine; L3: lower canine; U4: upper first premolar; L4: lower first premolar; U5: upper second premolar; L5: lower second premolar; U6: upper first molar; L6: lower first molar ; FMPS: full-mouth plaque score; FMBS: full-mouth bleeding score; V: vestibular; L: lingual; HOMIM: Human Oral Microbe Identi fication Microarray; RPE: rapid palatal expander.CB
Of the 29 articles that studied CB [
3
,
4
,
10
,
12
,
13
,
19
–
23
,
26
–
30
,
32
,
34
,
35
,
38
,
41
,
44
,
46
–
48
,
50
,
51
,
54
,
44
,
57
], the
majority showed a significant increase in BOP and
PI. Two studies [
10
,
52
] investigated the differences
between the use of elastomeric or steel ligatures,
revealing contradictory results on BOP and PI at
different times. Ristic
’s studies [
44
,
45
] highlighted
that maximum values of PI and BOP were reached
3 months after appliance placement, followed by a
decrease in these parameters 6 months after
treat-ment began. Six studies assessed the increase of
Candida at different times [
12
,
13
,
22
,
23
,
56
,
57
].
Twenty studies highlighted the increase of
gram-positive bacteria, in particular S. mutans and
Lactobacillus spp. [
3
,
4
,
12
,
19
–
21
,
27
–
30
,
32
,
34
,
35
,
42
,
46
,
47
,
50
,
51
,
54
,
57
]. Three studies [
43
,
44
,
48
] detected
significant
increases
of
gram-negative
bacteria,
respectively, at 3 and 6 months, followed by a
decrease
at
6
and
12
months.
Ten
studies
[
10
,
20
,
21
,
26
,
30
,
37
,
41
,
43
,
44
,
48
] detected an increase
in the percentage of gram-bacteria and A.
actinomy-cetemcomitans. The study conducted by Alves de
Souza et al. [
10
] revealed a significant increase in
gram-species with the use of elasticomeric rings
(
Table 5
).
Self-ligating braces
Eigh studies analyzed self-ligating braces (SLB)
[
9
,
14
,
24
,
37
–
40
,
54
]. Two studies [
14
,
40
] revealed no
differences for BOP and PI between SLB and CB,
while Nalçac et al. and Uzuner et al. [
54
]
demon-strated a worsening in SLB. Two studies considered
the use of SLB with or without elastomeric rings,
observing
an
increase
in
gram-concentration
[
24
,
38
]. One other study [
14
] showed an increase of
S. mutans and Lactobacillus spp. at 3 months with the
use of SLB compared to controls. One study [
41
]
showed less S. mutans with SLB compared to CB
(
Table 6
).
Lingual braces
Four
studies
analyzed
lingual
braces
(LB)
[
15
,
16
,
33
,
45
] and three of these highlighted a
worsen-ing of PI and BOP [
15
,
16
,
33
]. Two studies [
16
,
33
]
revealed an increase of S. mutans and A.
actinomyce-temcomitans after 4 weeks (
Table 7
).
Removable appliances
Six studies analyzed removable devices [
11
,
17
,
18
,
31
,
49
,
52
]. One study analyzed different interceptive
removable appliances [
49
], demonstrating an increase
in both S. mutans and Lactobacillus spp.
The invisalign study, conducted by Levrini et al.
[
31
], revealed lower values of PI, BOP, and bacterial
component at 3 months for the invisalign group.
In the two studies with thermoplastic retainers,
Türköz et al. [
52
] showed an increase of S. mutans
and Lactobacillus spp. while Farhadian et al. [
18
]
observed that the addition of silver nanoparticles
reduced the levels of S. mutans after 7 weeks.
In one study [
11
], the use of space maintainers
defined an increase in BOP in the number of
bac-teria and in Candida. Furthermore, D’Ercole et al.
[
17
] pointed out that the use of sports
mouth-guards produced an increase in BOP and PI
(
Table 8
).
Other appliances
Two studies investigated other kinds of orthodontic
appliances [
25
,
56
]: one fixed interceptive orthodontic
appliance and one esthetic brace. In a study that
analyzed fixed interceptive appliances, Ortu et al.
[
56
] demonstrated an increase in S. mutans and
Lactobacillus spp. (
Table 9
).
Discussion
The present systematic review agreed with the
con-clusions arrived at by Freitas et al. [
5
], which could be
extended to any type of orthodontic appliance. The
evidence of the selected sample was of medium-high
level due to the lack of error of measurements
analy-sis for the collection of material from oral sites.
Though this lack of standardization may influence
the outcomes, due to the difficulty in obtaining a
high repeatability in this procedure, it would not
Swedish council on technology assessment in
health-care (SBU) criteria for grading assessed studies.
SBU criteria for grading assessed studies Grade A
High value of evidence. All criteria should be met: randomized clinical study or a prospective study with a well-defined control group, defined diagnosis and end points, diagnostic reliability tests and reproducibility tests described, blinded outcome assessment Grade B
Moderate value of evidence. All criteria should be met: cohort study or retrospective case series with defined control or reference group, defined diagnosis and end points, diagnostic reliability tests, and reproducibility tests described
Grade C
Low value of evidence. One or more of the conditions below: large attrition, unclear diagnosis, and end points, poorly defined patient material
Table 4.
Definitions of evidence level.
Level Evidence Definition
1 Strong At least two studies assessed with level‘A’ 2 Moderate One study with level‘A’ and at least two studies
with level‘B’
3 Limited At least two studies with level‘B’ 4 Inconclusive Fewer than two studies with level‘B’
Conventional braces results.
Reference PI BOP Microbiological analysis
Alves et al. [10] Elastomeric rings: Value (T0) = 37.72%; value (T1) = 63.72% Steel ligatures: Value (T0) = 37.72%; value (T1) = 51.09% Elastomeric rings: Value (T0) = 4.28%; value (T1) = 12.28% Steel ligatures: Value (T0) = 3.86%; value (T1) = 6.71%
T0 steel ligatures-elastomeric rings:
P(Aa) = 0.3173; P(Tf) = 0.1797; P(Pg) = /; P(Pi) = /; P (Pn) = 1.000
T1 steel ligatures-elastomeric rings:
P(Aa) = 0.3173; P(Tf) = 0.0039; P(Pg) = /; P(Pi) = 0.5637; P(Pn) = 0.0339 T0–T1 elastomeric rings: P(Aa) = 0.5637; P(Tf)<0.0001; P(Pg) = /; P(Pi) = 1,000; P (Pn)<0.0001 T0–T1 steel ligatures: P(Aa) = 0.5637; P(Tf) = 0.0003; P(Pg) = /; P(Pi) = /; P (Pn) = 0.0003
Arab et al. [12] Salivary SM:
P(T0) = /; P(T1) < 0.001; P(T2) < 0.001; P(T3) < 0.001 Lactobacillus acidophilus: P(T0) = /; P(T1) < 0.001; P(T2) < 0.001; P(T3) < 0.001 Candida albicans: P(T0) = /; P(T1) < 0.001; P(T2) < 0.001; P(T3) < 0.001 Arslan et al. [13] Saliva: (T0–T1–T2–T3); P value <0.001 U arch: (T1–T2–T3); P value <0.001 L arch: (T1–T2–T3); P value <0.001 Forsberg et al. [19] No. of bacteria: Elastomeric vs. steel: T2: 0.21; T3: 0.21; T4: 0.22; T5: 0.10; T6: 0.21 SM: T2: <0.01; T3: <0.01; T5: <0.001; T6: <0.01 Aerobic lactobacilli: T2: <0.05; T4: <0.001; T5: <0.05; T6: <0.01 Anaerobic lactobacili: T2: <0.01; T3: <0.01; T4: <0.01; T5: <0.001; T6: <0.001 Hägg et al. [22]
T0–T1–T2: P < 0.05 Candida: P < 0.001 after FOA with imprinted technique but not with oral rinse of pooled plaque techniques Predominant Candida species isolated was C. albicans.
Number of coliform carriers after FOA–in oral rinse: P < 0.05, in pooled plaque: P < 0.05
Eight Coliform species after FOA instead of three species before FOA
Hernández-Solis et al. [23]
T0–T1: P < 0.001
T0: Most frequently found species C. albicans (8.3%); T1: C. tropicalis (20.0%)
Kim et al. [26] Only significant values:
T. forsythia: T2 vs. T3: U6: 0.013*; L6: 0.039* T2 vs. T4: U6: 0.002**; L1: 0.003**; L6: 0.012* T3 vs. T4: L1: 0.021* C. rectus: T1 vs. T2: U6: 0.007** P. nigrescens: T1 vs. T2: U6: 0.013*; L6: 0.022* Kupietzky et al. [27] G2 (control): mean− (SD)+ T0: 39–16; T1: 34–11 G1: mean− (SD)+ T0: 28–6; T1: 30–11 Pretest differences: P: 0.001 SM CFU: G2 (control): mean− (SD)+ T0: 2.5–1.2; T1: 2.8–0.9 G1: mean− (SD)+ T0: 2.9–0.9; T1: 3.3–0.8 Pretest differences: P: 0.09 LB CFU: G2 (control): mean− (SD)+ T0: 1.8–1.1; T1: 2.3–1.1 G1: mean− (SD)+ T0: 2.9–1.2; T1: 3.5–0.7 Pretest differences: P: 0.0003 Lara-Carrillo et al. [28]
O’Leary’s plaque index: P = 0.061 SM:
T0 (M/F): P = 0.852; T1 (M/F): P = 0.575; T2 (M/F): P = 0.743; T3 (M/F): P = 0.867 LB: T0 (M/F): P = 0.412; T1 (M/F): P = 0.702; T2 (M/F): P = 0.428;T3 (M/F): P = 0.420
(Continued )
represent a major concern for the studies’ quality. In
our sample, the use of orthodontic devices resulted in
an increase in oral bacterial counts in patients, with
significant
differences
between
appliance
type,
depending on whether they were removable or not.
(Continued).
Reference PI BOP Microbiological analysis
Lara-Carrillo et al. [29]
44.6%, M slightly greater plaque percentage (50.84%) than F (40.15%) (P = 0.1809)
SM:
T0: 14/34 subjects had high values (>105); T1: 16/34 had high values
LB: T0: 7/34 subjects had high levels (>105); T1: 20/34 subjects same level, although statistically significant differences were not observed in this distribution (P = 0.6905)
Distribution of bacterial markers, plaque pH, and occult blood in saliva by gender in the study:
Salivary markers: Unstimulated saliva:
P(M/F): 0.3903/0.0026*; P(T0–T1): 0.4073 Stimulated saliva (ml/min):
P(M/F): 0.0019*/0.0835; P(T0–T1): 0.0001* Buffer capacity: P(M/F): 0.0381*/0.1247; P(T0–T1): 0.0359* Salivary pH: P(M/F): 0.1672/0.7039; P(T0–T1): 0.0246* Leung et al. [30]
Supragingival and subgingival plaque total DNA after appliance placement: P = 0.005
Supragingival streptococci: P = 0.0002 Buccal cells:
A. actinomycetemcomitans: P = 0.0058
Liu et al. [32] Total viable microflora:
T0: log10 CFU ± SD: 6.94 ± 0.51; T1: log10 CFU ± SD: 7.54 ± 0.46**; T2: log10 CFU ± SD: 7.72 ± 0.36**; T3: log10 CFU ± SD: 8.07 ± 0.44**
Significance: 0.0001 S:
T0: log10 CFU ± SD: 5.61 ± 0.54; T1: log10 CFU ± SD: 6.34 ± 0.65**; T2: log10 CFU ± SD: 6.66 ± 0.57**; T3: log10 CFU ± SD: 6.61 ± 0.55**
Significance: 0.0001 SM:
T0: log10 CFU ± SD: 4.42 ± 0.62; T1: log10 CFU ± SD: 5.42 ± 0.68**; T2: log10 CFU ± SD: 5.42 ± 0.57**; T3: log10 CFU ± SD: 5.68 ± 0.65**
Significance: 0.0001 Maret et al.
[34]
CB was an independent risk factor for high levels of SM and LB spp. (adjusted OR: 6.65, 95% CI [1.9822.37]; 9.49, 95% CI [2.57–35.07], respectively) Mattingly et al. [3] T0/T1/T2 vs. T3/T4/T5: P < 0.01 T3 vs. T5: P < 0.01 Paolantonio et al. [39] T0–T1: test: P < 0.001; control: P < 0.05 T1–T2: test: P < 0.05; control: P > 0.1 T2–T3: test: P > 0.1; control: P > 0.1 T3–T4: test: P < 0.001; control: P > 0.1 Overall T0–T4: test: P < 0.05; control: P < 0.05 T0–T1: test: P < 0.001; control: P < 0.05 T1–T2: test: P < 0.05; control: P > 0.1 T2–T3: test: P > 0.1; control: P > 0.1 T3–T4: test: P < 0.001; control: P > 0.1 Overall T0–T4: test: P < 0.05; control: P < 0.05
Mean percent of Aa+ sites: T0–T1: test: P < 0.001; control: – T1–T2: test: P > 0.1; control: P > 0.1 T2–T3: test: P > 0.1; control: – T3–T4: test: P < 0.001; control: –
Overall T0–T4: test: P < 0.001; control: P > 0.05 Mean Aa proportion:
T0–T1: test: P < 0.001; control: P > 0.05 T1–T2: test: P > 0.05; control: – T2–T3: test: P > 0.05; control: – T3–T4: test: P < 0.01; control: P > 0.1 Overall T0–T4: test: P < 0.001; control: P > 0.05 Perinetti et al.
[42]
DCs:
Baseline-28 days: mesial: P < 0.05; distal: P < 0.05
CCs:
Baseline-28 days: mesial: P < 0.05; distal: P < 0.05
ACs:
Baseline-28 days: mesial: NS; distal: NS
Among groups differences: Baseline-28 days: mesial: P < 0.05;
distal: P < 0.05; total: P < 0.01 DCs:
Baseline-28 days: mesial: P < 0.05; distal: P < 0.05
CCs:
Baseline-28 days: mesial: P < 0.05; distal: P < 0.05
ACs:
Baseline-28 days: mesial: NS; distal: NS
Among groups differences: Baseline-28 days: mesial: P < 0.05;
distal: P < 0.01; total: P < 0.01
Aa subgingival colonization DCs:
Baseline-28 days: mesial: P < 0.01; distal: P < 0.01 CCs:
Baseline-28 days: mesial: P < 0.01; distal: P < 0.01 ACs:
Baseline-28 days: mesial: NS; distal: NS Among groups differences:
Baseline-28 days: mesial: P < 0.01; distal: P < 0.01; total: P < 0.01 Peros et al. [43] SM: T0:/; T1: P < 0.05; T2: P < 0.05; T3: P < 0.05 LB: T0:/; T1: P < 0.05; T2: P < 0.05; T3: P < 0.05
(Continued )
Previous studies have assessed the role of
bioma-terials in the regulation of the oral microbiota [
58
].
As stated by Antonelli et al. [
59
], the simplest surfaces
for bacteria to colonize are hard ones as mucous
membranes tend to scale off and, therefore, do not
guarantee a stable adhesion. The only exception to
this is the tongue, which is highly colonized even if it
is a mucosal surface because of the irregular surfaces
of papillae [
60
]. Consequently, the introduction of a
biomaterial into this open system creates a further
retentive surface on which bacterial species are able
to reproduce and where there is an increased
diffi-culty in maintaining oral hygiene [
58
]. As revealed by
the Øilo and Bakken [
58
] literature review, the
pre-sence of biomaterials results in an increase in plaque
and alterations in the oral microbiota.
Thus, on the basis of these assessments, it seems
reasonable to state that the grade of bacterial
(Continued).
Reference PI BOP Microbiological analysis
Ristic et al. [44] (mean ± SD) Incisors: Tx: 1.281 ± 0.310; T0: 0.898 ± 0.329; T1: 1.211 ± 0.278; T2: 1.250 ± 0.336; T3: 1.219 ± 0.275 Premolars: Tx: 0.883 ± 0.298; T0: 0.547 ± 0.314; T1: 0.984 ± 0.126; T2: 1.055 ± 0.198; T3: 1.031 ± 0.123 Molars: Tx: 0.930 ± 0.366; T0: 0.625 ± 0.354; T1: 1.117 ± 0.277; T2: 1.109 ± 0.219; T3: 1.070 ± 0.264 (mean ± SD) Incisors: Tx: 0.516 ± 0.416; T0: 0.266 ± 0.269; T1: 1.320 ± 0.586; T2: 1.336 ± 0.677; T3: 1.383 ± 0.453 Premolars: Tx: 0.320 ± 0.366; T0: 0.148 ± 0.236; T1: 0.664 ± 0.379; T2: 0.672 ± 0.394; T3: 0.594 ± 0.415 Molars: Tx: 0.234 ± 0.304; T0: 0.227 ± 0.249; T1: 0.594 ± 0.358; T2: 0.602 ± 0.347; T3: 0.547 ± 0.367
Difference between frequency of bacteria types Number determined in different periods of control: Incisors: T0–T1: P > 0.05; T0–T2: P < 0.01; T0–T3: P > 0.05; T1–T2: P < 0.05; T1–T3: P > 0.05; T2–T3: P > 0.05 Premolars: T0–T1: P > 0.05; T0–T2: P < 0.01; T0–T3: P > 0.05; T1–T2: P > 0.05; T1–T3: P > 0.05; T2–T3: P < 0.01 Molars: T0–T1: P < 0.05; T0–T2: P < 0.01; T0–T3: P > 0.05; T1–T2: P < 0.05; T1–T3: P > 0.05; T2–T3: P > 0.05 Difference between frequency findings of P. intermedia
isolated in different periods of control: Incisors: T0–T1: P > 0.05; T0–T2: P < 0.01; T0–T3: P > 0.05; T1–T2: P < 0.05; T1–T3: P > 0.05; T2–T3: P < 0.05 Premolars: T0–T1: P > 0.05; T0–T2: P > 0.05; T0–T3: P > 0.05; T1–T2: P > 0.05; T1–T3: P > 0.05; T2–T3: P > 0.05 Molars: T0–T1: P > 0.05; T0–T2: P > 0.05; T0–T3: P > 0.05; T1–T2: P > 0.05; T1–T3: P > 0.05; T2–T3: P < 0.05 Ristic et al. [45]
Total bacterial count compared between different recording periods on incisors, premolars, and molars: Incisors: T0–T1: P < 0.01; T0–T2: P < 0.01; T1–T2: P < 0.01; T2–T3: P < 0.05 Premolars: T0–T1: P < 0.01; T0–T2: P < 0.01; T1–T2: P < 0.05; T2–T3: P > 0.05 Molars: T0–T1: P < 0.01; T0–T2: P < 0.01; T1–T2: P < 0.05; T2–T3: P > 0.05
The significance of difference between positive findings of Prevotella intermedia:
Incisors: P = 0.003; Premolars: P = 0.037; Molars: P = 0.022 Shukla et al. [47] P = 0.000 (<0.05) Shukla et al. [58] Candida: P = 0 SM: P = 0 Sinclair et al. [4] Plaque index: NS Gingival index: U1: T2–T1: <0.05; L1: T2–T1: <0.05; U6: T2–T1: NS; L6: T2–T1: NS Mean: T2–T1: <0.05 S: mean: P < 0.01 Aa: mean: P < 0.05 Fusobacteria: NS Bacteroides: NS Spirochetes: NS Sudarević et al. [48] SM: T1–T2: NS S. sobrinus: T2: 2 pt Thornberg et al. [49]
Comparison of high pathogen counts at T0 to T1, T2, T3, and T4 (significant values)
Prevotella intermedia: T0 vs. T1: 0.0001* Tannerella forsythia: T0 vs. T1: 0.0258* Eikenella corrodens: T0 vs. T1: 0.0001*; T0 vs. T3: 0.0051*; T0 vs. T4: 0.0349* Fusobacterium nucleatum: T0 vs. T1: 0.0004*; T0 vs. T3: 0.0206*; T0 vs. T4: 0.0335* Treponema denticola: T0 vs. T1: 0.0002*; T0 vs. T3: 0.0441* Campylobacter rectus: T0 vs. T1: 0.0225*; T0 vs. T4: 0.0349*
(Continued )
colonization related to orthodontic appliances is
affected by the energy and roughness of the appliance
surfaces, as well as their design and dimensions. This
may be a key factor in efficiently performing hygiene
procedures [
58
].
Another significant variable for microbiota
altera-tions is the amount of time the appliance is worn in
the oral cavity, with removable appliances having
significantly less impact on oral bacteria than fixed
appliances [
61
].
(Continued).
Reference PI BOP Microbiological analysis
Topaloglu et al. [50]
Means and standard deviations of SM Expressed as log10 CFU
a,cP < 0.05, b,dP > 0.05 G1: SM (T0): 4.4 ± 1.1a,b; SM (T1): 4.0 ± 1.4°; SM (T2): 4.4 ± 1.1°; SM (T3): 5.2 ± 0.6b G2: SM (T0): 4.1 ± 1.0c,d; SM (T1): 4.2 ± 1.3c; SM (T2): 4.4 ± 1.0c; SM (T3): 5.5 ± 1.0d
Means and standard deviations of LB spp. expressed as log10 CFU a,cP < 0.05, b,dP > 0.05: G1: LB (T0): 5.6 ± 1.2a,b; LB(T1): 5.4 ± 1.4°; LB (T2): 5.8 ± 1.3°; LB(T3): 6.6 ± 0.7b G2: LB (T0): 5.7 ± 1.0c,d; LB (T1): 5.9 ± 1.4c; LB (T2): 6.0 ± 1.1c; LB (T3): 6.3 ± 0.6d Torlakovic et al. [51]
Plaque levels increase: NS Prevalence of gingivitis at U1 increased from T0: 25% to T3: 74%
NS
Turkkahraman et al. [52]
Bonded bracket plaque index: G1–G2: NS
T0–T1: P < 0.001; T0–T2: P < 0.001
T0 and T1: G1≈ G2
T2: Significantly more bleeding in G2
Statistical comparison of bacterial counts of the groups: Total bacteria: NS
Anaerobe lactobacilli: NS
Longitudinal changes in bacterial counts of bonded: Total bacteria: T0–T1: P < 0.001; T0–T2: P < 0.001; T1–T2: P < 0.001 Anaerobe lactobacilli: T0–T1: P < 0.001; T0–T2: P < 0.001; T1–T2: P < 0.001 Aerobe lactobacilli: T0–T1: P < 0.001; T0–T2: P < 0.001; T1–T2: P < 0.001 SM: T0–T1: P < 0.001; T0–T2: P < 0.001; T1–T2: P < 0.001 Van Gastel et al. [20] Banded: T1/T0 = 6.29*; bonded: T1/ T0 = 3.95*
CFU ratio aerobe: anaerobe supragingival Banded: T1/T0 = 0.49*; bonded: T1/T0 = 0.51* CFU ratio aerobe: anaerobe subgingival Banded: T1/T0 = 0.25*; bonded: T1/T0 = 0.27* Wichelhaus et al. [55] API: Intensity 0–25: T0 (n = 11): number: 3 HP+: 2; T1 (n = 9): number: 0 HP+: 0; T2 (n = 11): number: 0 HP+: 0 26–35: T0 (n = 11): number: 0 HP+: 0; T1 (n = 9): number: 2 HP+: 2;T2 (n = 11): number: 0 HP+: 0 36–70: T0 (n = 11): number: 6 HP+: 6; T1 (n = 9): number: 5 HP+: 3; T2 (n = 11): number: 9 HP+: 6 71–100: T0 (n = 11): number: 2 HP+: 1; T1 (n = 9): number: 2 HP+: 0; T2 (n = 11): number: 2 HP+: 0 SBI: API: Intensity 0–10: T0 (n = 11): number: 4 HP+: 3; T1 (n = 9): number: 2 HP+: 2; T2 (n = 11): number: 2 HP+: 1 11–20: T0 (n = 11): number: 1 HP+: 1; T1 (n = 9): number: 0 HP+: 0; T2 (n = 11): number: 1 HP+: 1 21–50: T0 (n = 11): number: 5 HP+: 4; T1 (n = 9): number: 6 HP+: 3; T2 (n = 11): number: 6 HP+: 3 51–100: T0 (n = 11): number: 1 HP+: 1; T1 (n = 9): number: 1 HP+: 0; T2 (n = 11): number: 2 HP+: 1 LB spp.: Prevalence <103: TO (n = 10): number: 7 HP+: 7; T1 (n = 9): number: 3 HP +: 2; T2 (n = 11): number: 2 HP+: 2 103–104: T0 (n = 10): number: 3 HP+: 2; T1 (n = 9): number: 5 HP +: 2; T2 (n = 11): number: 4 HP+: 1 >104: T0 (n = 10): number: 0 HP+: 0; T1 (n = 9): number: 1 HP +: 1;T2 (n = 11): number: 5 HP+: 3 Streptococci: <105 T0 (n = 10): number: 5 HP+: 4; T1 (n = 9): number: 6 HP +: 2; T2 (n = 11): number: 9 HP+: 5 105–106: T0 (n = 10): number: 3 HP+: 3; T1 (n = 9): number: 3 HP +: 3; T2 (n = 11): number: 2 HP+: 1 >106: T0 (n = 10): number: 2 HP+: 2; T1 (n = 9): number: 0 HP +: 0; T2 (n = 11): number: 0 HP+: 0 Zheng et al. [56] Prior to treatment: (1) P = 0.58143; (2) P = 0.000785*; (3) P = 0.046811*; (6) P = 0.318954 After 1 months:
After 2 months P = 0.002619*; after 3 months P = 0.129414; after 6 months P = 0.64157 After 2 months:
After 3 months P = 0.099146; after 6 months P = 0.009289*
After 3 months:
After 6 months P = 0.289807 / : dental site negative; *P<0.05.
The quantitative alteration of the oral microbiota
is related to an increase in clinical parameters, PI and
BOP, which are risk indicators for oral
patholo-gies [
62
].
Together with the quantitative change, there is
also a qualitative variation; indeed, there is an
increase
in
gram-positive
and
gram-negative
more aggressive bacteria, such as: S. mutans and
Self-ligating braces results.
Reference PI BOP Microbiological analysis
Al-Anezi [9] P(T0) = 0.001–P(T1) = 0.002 P(T0) = 0.125–P(T1) = 0.508 NS Baka et al. [14]
Significance between T0–T1, T1–T2, T0– T1: SL: P(T0–T2) = 0.000; P(T1–T2) = 0.000; P (T0–T2) = 0.000 Steel ligature: P(T0–T2) = 0.000; P(T1–T2) = 0.000; P (T0–T2) = 0.000
Statistical comparison of the difference in the clinical periodontal
measurements between groups: Intergroup comparison:
P value (T0–T2) = 0.091
Significance between T0–T1, T1–T2, T0– T1: SL: P(T0–T2) = 0.000; P(T1–T2) = 0.000; P (T0–T2) = 0.000 Steel ligature: P(T0–T2) = 0.000; P(T1–T2) = 0.000; P (T0–T2) = 0.000
Statistical comparison of the difference in the clinical periodontal measurements between groups:
Intergroup comparison: P value (T0–T2) = 0.871
Significance between T0–T2 of the bacterial counts: SM: SL: P(T0–T2) = 0.000; steel ligature: P(T0– T2) = 0.000 S. sobrinus: SL: P(T0–T2) = 0.000; steel ligature: P(T0– T2) = 0.000 L. casei: SL: P(T0–T2) = 0.000; steel ligature: P(T0– T2) = 0.000 L. acidophilus: SL: P(T0–T2) = 0.000; steel ligature: P(T0– T2) = 0.000
Statistical comparisons of the differences in the bacterial counts between groups:
Intergroup comparison: SM: P = 0.787; S. sobrinus: P = 0.104; L. casei: P = 0.978;l L acidophilus: P = 0.386 Ireland et al. [24]
T0 vs. T1; T0 vs. T2: P < 0.001 Treponema Denticola % over total bacteria Molar band:
T0 vs. T1: P < 0.01; T0 vs. T2: P < 0.05 Molar bonded tube:
T0 vs. T1: P < 0.05; T1 vs. T3: P < 0.05 Nalçacı et al. [36] G1: T0: 0.46 ± 0.06; T1: 0.60 ± 0.07; T2: 0.66 ± 0.08 T0–T1: *; T0–T2: *; L T1–T2: * G2: T0: 0.41 ± 0.05; T1: 0.60 ± 0.06; T2: 0.94 ± 0.09 T0–T1: *; T0–T2: *; T1–T2:* P value: T0: 0.511 NS; T1: 0.967 NS; T2: 0.030* G1: T0: 0.08 ± 0.07; T1: 0.11 ± 0.11; T2: 0.13 ± 0.02 T0–T1: *; T0–T2: *; T1–T2: NS G2: T0: 0.06 ± 0.006; T1: 0.11 ± 0.008; T2: 0.21 ± 0.04 T0–T1: *; T0–T2: *; T1–T2: * P value: T0: 0.068 NS; T1: 0.092 NS; T2: 0.039* Total bacteria: P value: T0: 0.877 NS; T1: 0.983 NS; T2: 0.525 NS Anaerobe lactobacilli: P value: T0: 0.472 NS; T1: 0.568 NS; T2: 0.738 NS Aerobe lactobacilli: P value: T0: 0.471 NS; T1: 0.671 NS; T2: 0.738 NS SM: P value: T0: 0.115 NS; T1: 0.070 NS; T2: 0.068 NS Pandis et al. [37] G1–G2 (T0): P level: NS G1–G2 (T1): P level: NS
Analysis of covariance for the salivary SM counts per milliliter saliva of the subjects included in the study:
Log-SM: P = 0.033* (only significant value) Pejda
et al. [39]
FMPS:
T0–T1–T2–T3: NS; G1 vs. G2: NS
FMBS during time: (P < 0.031) with 7.9% variability
Statistically significant difference between T0 and T3 (P = 0.05) not influenced by type of brackets
Prevalence of AA in G2 vs. G1: P < 0.001. Average number of detected units of AA:
G2: 104–105 G1 < 103
Red-complex bacteria (PG, PI, TF, and TD) prevalence: NS in G1 and G2 Total count of tested species: lower in G1
(2.1 ± 1.2) than G2 Pellegrini et al. [40] SL braces– elastomeric: Total bacteria: P = 0.032* Oral streptococci: P = 0.030*
Number of arches exhibiting grater levels of bacteria and ATP bioluminescence in elastomeric vs. SL braces: total bacteria: T1: P = 0.028; T2: P = 0.074 Oral S: T1: P = 0.007; T2: P = 0.025 ATP bioluminescence: T1: P = 0.028; T2: P = 0.074 Uzuner et al. [53]
In SLB group PI values increased significantly (P < 0.05)
In SLB group GI values increased significantly (P < 0.05)
Comparisons of bacterial colonizations T0–T1: LB saliva:
Group: 0.488; time: 0.577; group × time: 0.457 SM saliva:
Group: 0.749; time: 0.341; group × time: 0.923 SM or LB colonization between the groups: NS PI: Plaque index; BOP: bleeding on probing; SBI: sulcus bleeding index; API: interproximal plaque index. **P<0.01; *P<0.05.
Lactobacillus spp. (gram-positive) and P.
gingiva-lis, Tforsythia, and T. denticola (gram-negative);
and these bacteria are closely associated with,
respectively, enamel and dentin pathologies (e.g.
demineralizations or caries) and with periodontal
disease [
63
]. Recent papers have highlighted the
complexity of periodontal disease etiology, with a
special focus on the identity of bacteria which are
responsible for this pathology [
64
–
66
]. Thus,
authors have stated that the presence alone of
specific micriobial species seems insufficient in
causing gingivitis and periodontal disease, and
that the change in biofilm equilibrium is another
key factor in the development of these diseases
[
64
–
66
]. Oral microbiota alterations registered in
orthodontic patients appear to be consistent with
the modifications occurring in patients with poor
oral hygiene presenting gingivitis and/or
period-ontal diseases. In addition, orthodontic devices
could represent a direct risk factor for periodontal
diseases as they are often related to an increase in
periodontopathogenic
species
[
24
,
34
,
43
,
44
,
48
].
However, it seems reasonable to state that the
susceptibility of each subject, as well as other
factors that may alter the biofilm balance, may
play a key role in determining the entity of
peri-odontal sequelae.
Even though changes in the microbial system
involve all types of orthodontic appliance, more
rapid modifications occur during fixed orthodontic
treatment. These alterations may be recorded even
1 month after the beginning of treatment and may
lead to a decrease in patients’ periodontal health
perception [
41
]. Even so, as stated by Perinetti et al.
[
41
], the role of subgingival bacteria in periodontal
modifications needs to be evaluated together with the
action of enzymes activated in response to the stimuli
of orthodontic forces.
If it is true that all appliances increase the bacterial
component, it is also the case that mobile devices
make minor changes as they are removable and can
be completely cleaned, resulting in better oral hygiene
minimizing retentive artifacts. It should also be
emphasized that, of these appliances, the use of
mouthguards is limited to a small population and
they are carried only for limited periods of time,
involving a less pathogenic effect.
Less devastating results from changes in the
oral microbiota emerged from studies on
func-tional appliances and on aligners, which are used
up to 22 h a day [
61
]. So, it seems more
Lingual braces results.
Reference PI BOP Microbiological analysis
Demling et al. [15] Buccal sites: T0: 0.1 ± 0.2; T1: 0.1 ± 0.2 Lingual sites: T0: 0.1 ± 0.2; T1: 1.2 ± 1.1 Buccal sites: T0: 12.4 ± 8.2; T1: 14.3 ± 8.1 Lingual sites: T0: 22.2 ± 19.0; T1: 56.2 ± 31.6 AA: T0: 5 pt; T1: 4 pt PG: T0: 1 pt; T1: 2 pt Demling et al. [16] Maxilla: Labial: T0: 0.2 ± 0.5; T1: 0.0 ± 0.1; P: 0.223 Palatal: T0: 0.1 ± 0.1; T1: 0.1 ± 0.2; P: 0.587 Mandible: Labial: T0: 0.2 ± 0.3; T1: 0.1 ± 0.2; P: 0.329 Lingual: T0: 0.3 ± 0.3; T1: 1.0 ± 0.7; P: 0.001 Maxilla: Labial: T0: 19.9 ± 20.1; T1: 13.5 ± 13.6; P: 0.184 Palatal: T0: 25.2 ± 19.2; T1: 22.2 ± 18.9; P: 0.608 Mandible: Labial: T0: 18.1 ± 17.5; T1: 12.9 ± 16.7; P: 0.101 Lingual: T0: 23.4 ± 22.5; T1: 46.2 ± 23.5; P: 0.001 AA T0: 25% pt; T1: 35% pt PG T0, T1: 5% pt Lombardo et al. [33] G2: T0: 0.47 ± 0.18; T1: 0.56 ± 0.15; T2: 0.59 ± 0.16 T0–T1: P < 0.05; T1–T2: NS; T0– T2: P < 0.5 G1: T0: 0.42 ± 0.17; T1: 0.52 ± 0.25; T2: 0.43 ± 0.20 T0–T1: NS; T1–T2: NS; T0–T2: NS G2: T0: 0.18 ± 0.13; T1: 0.22 ± 0.07; T2: 0.29 ± 0.19 T0–T1: NS; T1–T2: NS; T0: T2: P < 0.05 G1: T0: 0.31 ± 0.21; T1: 0.45 ± 0.17; T2: 0.33 ± 0.13 T0–T1: P < 0.05; T1–T2: P < 0.01; T0–T2: NS SM G2: T0–T1: NS; T1–T2: NS; T0–T2: P < 0.05 G1: T0–T1: NS; T1–T2: NS; T0–T2: NS LB spp. : G2: T0–T1: NS; T1–T2: NS; T0–T2: NS G1: T0–T1: NS; T1–T2: NS; T0–T2: NS Sfondrini et al. [46]
NS differences (P > 0.05) in the different groups at different times
Total CFU/P value:
V–L: 4.65E + 6/0.68; V-control: 5.11E + 7/0.2; L-control: 4.64E + 7/0.41
S CFU/P value:
V–L: 1.69E + 5/0.43; V-control: 1.11E + 6/0.96; L-control: 9.45E + 5/0.38
Anaerobe CFU/P value:
V–L: −1.49E + 6/0.3; V-control: 3.00E + 5/0.07; L-control: 1.79E + 6/0.51
important to be able to remove the appliance and
wash both it and the teeth rather than the length
of time the device is worn.
In view of the changes in microbiota that
occurred with the introduction of biomaterials
into the oral cavity, and more specifically of the
orthodontic devices, it would be appropriate for
patients undergoing dedicated hygiene protocols
to keep the oral bacterial charge under control
and then to reduce the risk of the carious process
and periodontal disease, as evidenced by various
authors [
2
,
67
,
68
].
Conclusions
●
The overall evidence quality level was
moderate-to-high, thus significant conclusions could be
drawn.
●
Orthodontic appliances significantly influence
the oral microbiota, independent of appliance
type.
●
Significant alterations of the microbiota were
registered
1
month
after
the
start
of
treatment.
●
Removable appliances had less impact on oral
bacteria than fixed ones.
●
Personalized professional and daily hygiene
pro-tocols
are
recommended
for
orthodontic
patients from the beginning of treatment.
Table 9.
Other appliances results.
Reference PI BOP Microbiological analysis Jurela et al.
[25]
SM and S. sobrinus: NS Total bacteria counts: NS Ortu et al. [57] G3: T0–T1–T2: NS Group 1: T1–T2: NS; LB (T1–T2): NS; SM (T1–T2): NS Statistically significant: LB (T1–T0): P = 0.011; SM (T1–T0): P = 0.005; LB (T2–T0): P = 0.007; SM (T2–T0): P = 0.006. G2: LB (T1–T2): NS Statistically significant: LB (T2–T0): P = 0.006; SM (T2–T0): P = 0.004; LB (T1–T0): P = 0.01; SM (T1–T0): P = 0.006; SM (T1–T2): P = 0.03 PI: Plaque index; BOP: bleeding on probing.
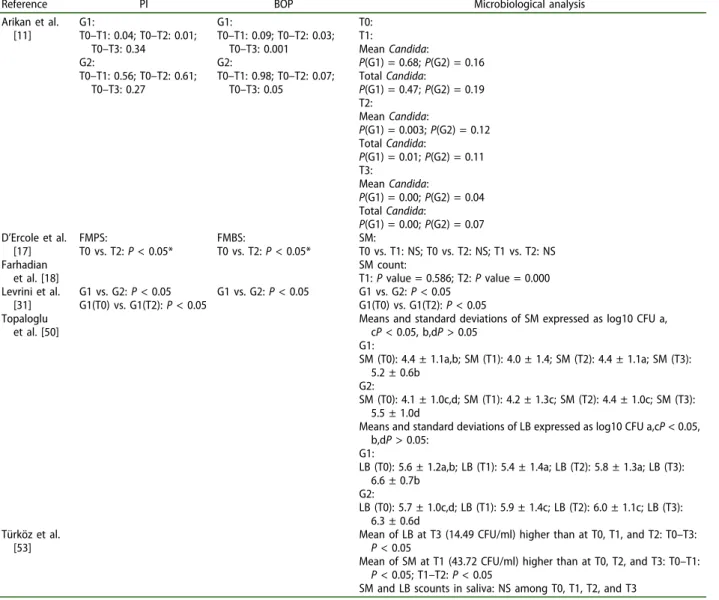
Removable appliances results.
Reference PI BOP Microbiological analysis
Arikan et al. [11] G1: T0–T1: 0.04; T0–T2: 0.01; T0–T3: 0.34 G2: T0–T1: 0.56; T0–T2: 0.61; T0–T3: 0.27 G1: T0–T1: 0.09; T0–T2: 0.03; T0–T3: 0.001 G2: T0–T1: 0.98; T0–T2: 0.07; T0–T3: 0.05 T0: T1: Mean Candida: P(G1) = 0.68; P(G2) = 0.16 Total Candida: P(G1) = 0.47; P(G2) = 0.19 T2: Mean Candida: P(G1) = 0.003; P(G2) = 0.12 Total Candida: P(G1) = 0.01; P(G2) = 0.11 T3: Mean Candida: P(G1) = 0.00; P(G2) = 0.04 Total Candida: P(G1) = 0.00; P(G2) = 0.07 D’Ercole et al. [17] FMPS: T0 vs. T2: P < 0.05* FMBS: T0 vs. T2: P < 0.05* SM: T0 vs. T1: NS; T0 vs. T2: NS; T1 vs. T2: NS Farhadian et al. [18] SM count: T1: P value = 0.586; T2: P value = 0.000 Levrini et al. [31] G1 vs. G2: P < 0.05 G1(T0) vs. G1(T2): P < 0.05 G1 vs. G2: P < 0.05 G1 vs. G2: P < 0.05 G1(T0) vs. G1(T2): P < 0.05 Topaloglu et al. [50]
Means and standard deviations of SM expressed as log10 CFU a, cP < 0.05, b,dP > 0.05 G1: SM (T0): 4.4 ± 1.1a,b; SM (T1): 4.0 ± 1.4; SM (T2): 4.4 ± 1.1a; SM (T3): 5.2 ± 0.6b G2: SM (T0): 4.1 ± 1.0c,d; SM (T1): 4.2 ± 1.3c; SM (T2): 4.4 ± 1.0c; SM (T3): 5.5 ± 1.0d
Means and standard deviations of LB expressed as log10 CFU a,cP < 0.05, b,dP > 0.05:
G1:
LB (T0): 5.6 ± 1.2a,b; LB (T1): 5.4 ± 1.4a; LB (T2): 5.8 ± 1.3a; LB (T3): 6.6 ± 0.7b G2: LB (T0): 5.7 ± 1.0c,d; LB (T1): 5.9 ± 1.4c; LB (T2): 6.0 ± 1.1c; LB (T3): 6.3 ± 0.6d Türköz et al. [53]
Mean of LB at T3 (14.49 CFU/ml) higher than at T0, T1, and T2: T0–T3: P < 0.05
Mean of SM at T1 (43.72 CFU/ml) higher than at T0, T2, and T3: T0–T1: P < 0.05; T1–T2: P < 0.05
SM and LB scounts in saliva: NS among T0, T1, T2, and T3 PI: Plaque index; BOP: bleeding on probing.