16 Mapping Open Drug
Scenes (ODS)
Mia-Maria Magnusson
16.1 Introduction
Drug use and distribution in public places, areas known as Open Drug Scenes (ODS), is a common problem in societies around the globe (UNODC, 2009). Despite differences in legislation, culture and societal organization, the problems connected to ODS are the same or at least very similar across cities in Europe, Canada, and the United States. In these areas, ODS create problems for both the community and the police (EMCDDA, 2015). ODS revolve around complex patterns of drug use involving multiple substances, often including heroin, amphetamine, cocaine, cannabis, buprenorphine, new psychoactive drugs such as mephedrone, prescribed medications such as benzodiazepines, zopiclone and diazepam, methadone, and crystal meth (Connolly, 2012). Open drug markets have been found in suburbs outside of bigger cities (Harocopos & Hough, 2005). But, typical ODS are located close to transportation hubs and in central business districts (Ceccato, Haining & Kahn, 2007; Ceccato, 2013). Some notorious open drug scenes include Hastings Street in Vancouver (McNeil et al., 2014), Vesterbro in Copenhagen (Frank & Bjerge, 2014), the 18th arrondisse-ment in Paris (EMCDDA, 2015), and the old central bus-station in Tel Aviv (Bonny-Noach & Ronel, 2018).
In Sweden, a well-known open drug scene, Plattan, has been located around Stockholm’s central rail station area and has had drug-related problems since 1965 when it was built (Ceccato, Haining & Signoretta, 2002, p. 35). Com-pared with other European countries, drug use is low in Sweden (EMCDDA, 2017). But open use and distribution of drugs has been increasing according to police reports and the media. Public drug use and distribution in the suburbs has gained attention in the last decades in some places in combination with gun violence (Police Authority, 2017). The open distribution and use of drugs have effects on living environments, safety issues and other crimes and create prob-lems for neighborhoods and communities (Sturup, Rostami, Mondani, Gerell, Sarnecki & Edling, 2019). In tackling these problems, the police and other authorities around the globe have adopted both punitive and harm reduction strategies, sometimes in combination (Olsen, 2017). Swedish police use, for example, motivational interviews in which police officers try to motivate addicts
and link abusers to health care. This tactic has not proven to be effective on ODS (Magnusson, in press). Alongside the approach of Problem Oriented Policing, POP (Goldstein, 1990) there is a need to obtain a better under-standing of ODS in Sweden, and in particular in Stockholm, to suggest inter-ventions to tackle them and their impact.
The term ODS is found in the European literature but with no particular local reference. Falk (1981), for example, referred to ODS when drug users get together to sell and use drugs in public spaces as an open drug scene. Later, Bless et al. (1995) defined an ODS as all situations where individuals are caught using or selling drugs. Given vague definitions, this study defined an ODS as: “a geographic area, sustained in space and time, where use and dealing of drugs takes place in the public and is perceived as problematic by authorities and/or the public”.
The aim of this study is to investigate the spatial nature of ODS in Stockholm, Sweden and explore how ODS might influence surroundings and communities. This is achieved by mapping and presenting descriptive statistics of ODS and their surroundings. Further, the possibilities of generating a typology for ODS in Stockholm County, Sweden is explored.
Previous international research on ODS is presented followed by the Swedish research evidence on ODS. Data and methods are presented, followed by the results from the analysis. The chapter concludes with a discussion of the results and implications for future research.
16.2 Theoretical background Current research
Urban ODS vary greatly in size, visibility, and location (Bless et al., 1995). Yet, they do share some common features including polydrug use, health issues, public nuisance complaints, public consumption of alcohol, loud behavior, begging, intoxication, and other crimes (EMCDDA, 2015). The distribution of crime is uneven and follows Weisburd and Amram’s (2014) law of crime con-centration, where crime often concentrates at drug hot spots (Weisburd & Green, 1995; Weisburd & Mazerolle, 2000). There is also evidence of a spatial overlap of drug crimes and violence (Lum, 2008; Weisburd & Mazerolle, 2000; Gerell, Sturup, Magnusson, Rostami, Nilvall, & Khoshnood, unpublished). ODS also seem to intensify other social harms, such as competition between dealers that ends up in violence (Poret & Téjédo, 2006). Youths and vulnerable groups may be more likely to use drugs if they are in close proximity to ODS (Werb, Kerr, Fast, Qi, Montaner, & Wood, 2010).
Since the 1980s, a wide range of criminal justice interventions have been introduced to combat ODS (Mazerolle, Soule, & Rombouts, 2005, 2007). Reductions in crime and problematic behaviors have been found in studies exploring POP approach (see Weisburd & Green, 1995; Mazerolle et al., 2005). ‘Pulling levers’ interventions (Kennedy, 1996), in which multiple agencies use
deterrence strategies to act together, have also seen some positive effects on containing drug markets (Corsaro & Brunson, 2013).
Research on police responses to ODS shows that strictly repressive efforts can temporarily disrupt the open drug scene (Connoly, 2006; Frank & Bjerge, 2014), but can also prevent abusers from getting drug treatment (McNeil et al., 2014). Interventions that adopt a strict healthcare approach, without police enforcement, have been shown to increase the growth of ODS and drug use (Klingemann, 1996; Waal, Clausen, Gjersing, & Gossop, 2014). There is also research suggesting that gun violence and high homicide rates may be a con-sequence of drug prohibition. Disrupting ODS may paradoxically increase violence without additional regulatory actions (Werb, Rowell, Guyatt, Kerr, Montaner, & Wood, 2011). Overall, there has been a struggle to offer solutions to the complex problems of drug markets faced by communities and local police departments (Mazerolle et al., 2005; Olsen, 2017). However, research generally shows that cooperation among multiple agencies offers the most long-term solution to the many problems of ODS (Connoly, 2006, 2012).
Swedish research on ODS is limited. Evaluations of police efforts at combat-ting ODS show weak results (Goldberg, 1993; Magnusson, in press). Adding to the problems is the changed tendency of the violence in Sweden. In Sweden, high levels of shootings, especially in vulnerable neighborhoods has gained a lot of attention in the media, in government reports (National Council for Crime Prevention 2015, 2018) and recently also in research (Sturup et al., 2018, Sturup et al., 2019). There has been a steep increase in gun violence in Sweden over the last 20 years, with an especially high rate among males aged 15–29 years compared with other West European countries (Sturup et al., 2019). Swedish ODS have recently been associated with gun violence (Gerell et al., unpublished). There are also near repeat patterns of the shootings at the open drug markets in Stockholm, which are chronic in the vulnerable neighborhoods (Gerell et al., unpublished). These locations seem to be in need of effective interventions.
Research questions
How many ODS are there in Stockholm County and where? What characterizes these ODS? Which are the criminal activities associated with ODS and how do they influence their surroundings? Is it possible to find different types of ODS? Hypotheses
ODS can be detected in many places in the Stockholm County and some of them share similar characteristics. Due to the recent media attention and police focus these locations might be new and unestablished. Drug customers on the ODS might affect violence and therefore also safety. The ODS might be differ-entiated in means of violence, where shootings represent the worst violence, having a negative impact on safety perceptions of these neighborhoods. These
areas might be the same as the vulnerable areas appointed by the Swedish national police.
16.3 The case study The study area
Stockholm is the largest county in Sweden with 2.3 million inhabitants and it comprises 26 municipalities, the largest one being the Swedish capital, with 972,647 people in 2019 (SCB, 2019). The county is divided into three police districts, the north, the city and the south. The police have 19 local police departments in total within the Stockholm region (eight in the north, two in the city, eight in the south and one at Gotland).
Data
Data for this study come from the police records, the survey on police employees and crime statistics from the police. Data from outside the police are necessary to provide a more accurate inventory of ODS. The citizen survey is added to the analysis to expand the perspective on the ODS.
Open drug scene survey
The mapping of ODS was conducted with the assistance of police employees’ knowledge on the ODS locations. In 2017, a web-survey was sent to all 19 Stockholm police departments from the regional strategic department to the chiefs of the local departments seeking participation from the personnel. All 19 local departments participated with 18 departments providing completed surveys. Some departments reported one ODS in their area while others with as many as six. One department, which was responsible for Sweden’s biggest airport, Arlanda, reported the absence of any ODS in their area. Thus, Arlanda was excluded from the study. Together, the 18 departments identified 48 ODS for which they completed surveys (N = 48). All responses were coded in IBM SPSS version 23 for analysis.
The surveys comprised close-ended questions for the following: geographical spatial characteristics, information of the drug scene: clientele, dealers and users, distributed drugs, symptoms, age and size. Police responses, organizational strategies and collaborations at the scene were surveyed with open-ended ques-tions and then thematized. A total of 97 variables on each ODS were collected and analyzed.
In addition to responding to the surveys, all departments were also asked to precisely indicate the open drug scene on a map that was provided along with the questionnaire. These responses were returned via electronic drawing on the com-puter, or by printing the map, drawing on the paper, and scanning the image.
All mapped and drawn ODS (N = 48) were plotted in geographical maps for visual presentation and mapped by coordinates. They were converted into
shapefiles in the software ARCGIS. An index of severity comprised by the char-acteristics on the ODSs was created to separate severe ODSs from milder ones. Crime data
Crime statistics from all outdoor violent crimes occurring in Stockholm county and reported to police during 2017 were gathered and added to the maps (N = 2,795). This category of violent crimes (e.g., assaults, threats, molestations, and robberies) was chosen to get a general overview of the situation. These crimes were transformed into regional hotspots. The hotspots were created with Kernel density estimation and with the bandwidth 306 and cell size 36. The used classification was Natural breaks (Jenks).
Buffer zones were created in GIS. Buffer zones were 200 meter radius areas surrounding the ODSs drawn by the police employees. In total the ODSs with buffer zones covers 0.29 percent of the total regional land area.
To get a more nuanced understanding, specific crime types were studied, some of which were included in the general outdoors violence measure above. The five crime types: robbery (N = 615 against persons only), outside violence (N = 2,096 outside assault only), prostitution (N = 28 purchase of sex), murder (N = 75 including attempts), knife and weapon crimes (N = 1,105) are used to explore the crime concentrations on the ODSs with the buffer zones.
All reported shootings, regardless of indoor or outdoor, in the region in 2017 were separately recorded (N = 129). The gun violence data were collected from the Stockholm police and contain confirmed incidents of illegal discharges of firearms. A layer of the shootings was created in GIS as a shapefile through their coordinates.
Community survey
Data from the citizen fear of crime survey were also added to the maps. This survey is conducted every three years and is sent out to random residents, age 16 to 79 years, in the Stockholm municipalities. Data collected by this survey could only be mapped for the 24 ODSs found in the Stockholm municipalities by districts (stadsdelsområde). In 2017, 17,669 individuals surveyed responded to the surveys, which is equivalent to 55 percent of the sample. Two questions were used in study. (i) “Do you feel that there are problems with drug traffick-ing that are open on the streets or squares in your residential area or in connec-tion with this?” Possible responses were: No; Yes, to a small extent; Yes, to a great extent; Yes, it does exist but is not a problem. (ii) “How safe or insecure do you feel in your residential area?” Possible responses were: Very Safe; Safe; Fairly Safe, Unsafe, and Very Insecure.
These data were then transferred to GIS and put out on the maps where the layer of ODSs was mapped. Then the different responses were divided into low, medium and high problems (Question 1) and unsafety (Question 2) and colored in different shades of gray to depict the different responses between the
communities. These levels are created in GIS with natural breaks. Then this was transformed into a layer in GIS.
Vulnerable neighborhoods
In Sweden, the “vulnerable neighborhoods” term has been used in police reports to label neighborhoods where criminal networks have a large impact in the local community (Police Authority, 2015, 2017). In 2017, the Swedish police identified a total of 61 neighborhoods as vulnerable following a large survey of local police department responses to problems and data on working conditions combined with demographic statistics such as unemployment and school grades (Police Authority 2017). Vulnerable neighborhoods have the effects of criminal networks in threats and blackmailing against inhabitants or workers in the community, and the prevalence of crime and disorder such as violence and shootings and open drug markets (Police Authority, 2017). In this study, vulnerable neighborhoods in Stockholm County 2017 (N = 25) were also added to the analysis of ODSs.
Methods
Three sources were used to inventory ODS, as defined above. The first source was a survey on ODS in the Stockholm region conducted by police departments. The survey answers were analyzed descriptively and geographic locations identi-fied in survey responses were mapped in the geographic information system (GIS). The second source for the inventory of ODS was official police crime data. The third source for the inventory of ODS was the citizen fear of crime survey of Stockholm. All sets of data were analyzed and mapped in GIS ArcMap 10.2.
GIS is an information system that is designed to work with data referenced by spatial or geographic coordinates. In the field of policing, the integration of GIS has had a revolution-like impact (Markovic, 2007). Crime mapping has been used widely in tactical and strategic crime analysis (Chainey & Ratcliffe, 2005; Levine, 2006). The information gained from crime mapping analysis is used for applications such as focusing resources on hot spots and crime preven-tion efforts in specific neighborhoods (Levine, 2006). Studying geographic places with spatial analysis has been done increasingly in Sweden. For example, in a study of sexual assault, Ceccato (2014) used a GIS approach to study the physical features, characteristics, and patterns of the places where sexual offenses occur. Ceccato explored the characteristics of the “places of rape”, and dis-cussed connections between the victim and crime place (Ceccato, 2014). Typology
Since there seems to be both inner city and suburban locations where open use and dealing of drugs takes place in Stockholm County, this study used the descrip-tive analysis from the survey, the geographical patterns, crime data intersection
and listed vulnerable areas to create a typology of ODS. Based on descriptive statistics, outdoor violence data, the shootings, vulnerable areas and the citizen survey data, the ODS were divided into separate groups, and by exploring different types of variables to use for division into the groups different types of ODS were identified.
16.4 Results
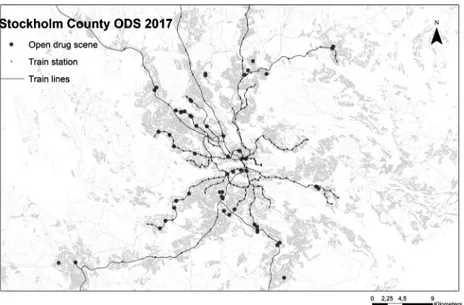
There were 48 ODS mapped by the local police departments which translate to about two ODS per 100,000 residents. They are spread all over the county with 18 in the south area, six in the inner city area and 24 in the north area (Figure 16.1).
One clear pattern found related to the communities and neighborhoods is that 90 percent of the ODSs are perceived to be located in residential areas close to where people live. Most of them are located on the local square (75 percent) where the local city center is placed (86 percent). The ODS loca-tion is also of interest in relaloca-tion to the community organizaloca-tion, on the squares and in the local city centers, the local health care, stores and social services are often placed. Yet another more worrying fact is ODS location in relation to children and youth care: 71 percent of the ODSs are reported to be located close to youth centers, 61 percent near schools and 51 percent near day-care centers. The areas associated with drug use and distribution are viewed as static (74 percent) even though the activities move around at the location.
Figure 16.1 Open drug scenes in Stockholm county, 2017.
Age
ODS have been present in these neighborhoods for a while, others are more recent. ODS can be classified in “four age groups”: 0–2 years of age, 2–5 years, 5–10 years and 10 years or older. Findings show that 48 percent of the ODS (N = 23) were 10 years or older. When including age level 3 (5–10 years old) the study found that 60 percent of the ODS (N = 29) were five years or older. Drug scene members
Interesting to the analysis is the characteristics of the clientele at the ODSs. The users were reported to be of all ages with “age unknown” as a big group (30 percent) and 58 percent of the drug scenes have users from both the age group under the age of 20 and the age group 20 years or older. The age of the dealers dif-fered slightly from the users, reportedly. The dealers were young (15–19 years) at almost a third of the drug scenes (29 percent) and only 8 percent of the drug scenes have older (20 years and older) dealers. In 17 percent of ODS (N = 8) opioid treat-ment patients were regularly found using and distributing drugs.
The participants’ relation to the neighborhood was also analyzed. The ODS users were both locals (44 percent), and those traveling to the ODS (27 percent). The patterns among dealers were perceived to be different. The dealers to a large extent were locally connected to the scenes. Seventy-one percent (N = 34) of the ODSs had local dealers and only 6 percent (N = 3) had outside dealers. The drug scenes were also connected to the criminal networks in the neighborhood at many places in the region. Fifty-six percent of ODSs (N = 27) were reportedly associated with criminal networks known by the local police.
Substances
Substances vary greatly in value and effect and the substances openly used and dis-tributed might also influence the drug scene, its participants, and the surround-ings. At 82 percent of the ODSs (N = 39) there was public smoking of cannabis. The four most common distributed substances were cannabis (100 percent of the ODS), cocaine (60 percent of the ODS), synthetic opioids (49 percent) and amphetamine (42 percent). The main drugs at 69 percent of the ODS (N = 33) were a combination of cannabis, cocaine and tramadol (synthetic opioid).
The perceived impact of ODS
What happens at ODSs is also important for the community. Most ODSs have public disturbances. Some of the disruptive characteristics of the ODSs seemed common while others were unusual. The need to analyze these characteristics became clear and an index was created to indicate the impact of ODS on communities.
The assumption is that the more symptoms of disruption that are perceived in the area, the greater the negative impact of ODS on communities. These
variables of interest were scored and related to each other. Seven symptoms of disruption were analyzed (Table 16.1). On the reliability test of Cronbach’s alpha, the index was tested and gave a value of 0.71. This means that our index is reliable in measuring ODS disruption as an impact on the area. More than half of the ODSs had five or more symptoms of disruption. ODSs with five or more symptoms were thus classified as severely disrupted.
To explore if there was a correlation between age of ODS and disruption, the age variable was combined with the index. Overall, only a weak correlation was found (r = 0.28, p = 0.56) between different disruptive characteristics of the index and age. However, there was a group of 15 old ODSs with many symptoms of disruption. Thus, most of the old ODS had lots of disruptive characteristics on the surrounding areas.
Table 16.1 Disruption in the area associated with ODS
Indexed variables % of the ODS
1 The place generates discomfort/inconvenience to the public 94 2 The place is perceived as unsafe 79 3 The place is a hot spot for crime 69 4 The place attracts new users and other vulnerable groups 67 5 Young persons are advised not to visit the place 50 6 The public avoids the place 44 7 Informal zone of tolerance for deviant behavior 15
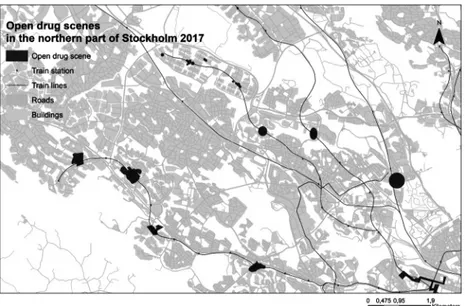
Figure 16.2 ODS and train lines in the northern part of Stockholm, 2017.
The ODSs were distributed with some obvious geographical patterns. First the connection to public transportation was evident (Figure 16.2). Eighty-two percent of the ODSs (N = 39) were located at transportation nodes, mostly on, or in direct proximity to subway or commuter train stations and a few at local bus stations. In Stockholm the public transportation system is spread through-out the region with subway lines, commuter train lines, and bus lines covering all trafficked parts of the county.
Hot spots of violence
The hot spots of violent crime were intersected with the ODS areas. When added to the drug scene layer in GIS a clear pattern was found: 65 percent of the ODSs (N = 31) in Stockholm coincided with the regional hot spots for outdoor violent crime. Many of the ODSs were locations of hotspots of violence. Two of the inner city ODS had the biggest hot spots of violence in the region. These two ODSs were located at two of the busiest areas of the city and one of the ODSs was the oldest and most well-known ODS, Plattan. Plattan was built in 1965, and has since then been troubled with drug sales, drug use, and high crime con-centrations. The police have struggled with containing the spread of narcotics and undermining the unique position Plattan holds in drug circuits.
Shootings
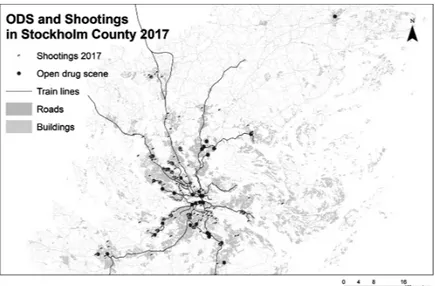
The second data layer put on top of the drug scenes consisted of data of all shootings (N = 129) in the region in 2017 (Figure 16.3). The shootings were intersected with the ODS areas.
Figure 16.3 ODS and shootings in Stockholm county 2017.
Seventy percent of the ODSs (N = 34) in the Stockholm region had at least one shooting in 2017. Twenty-four ODS had a shooting at the location and 12 ODS within two blocks from the ODS. Gun violence and shootings send strong signals of danger and add problems to ODS with existing issues. An analysis of the number of the shootings was also done to see which of the 129 shootings in the County in 2017 were located at ODS or in their proximity (at the most one block away). Fifty shootings were located at ODS, 39 percent of all the shoot-ings in the county in 2017. There are also ODS with no shootshoot-ings and there are shootings at other locations than ODS. The ODS without shootings (N = 14) were qualitative analyzed and 50 percent of them (N = 7) were in the youngest group (0–2 years). Ninety percent of the youngest ODS (N = 7 out of 8) had no shootings.
Crime concentration-buffer zones analysis
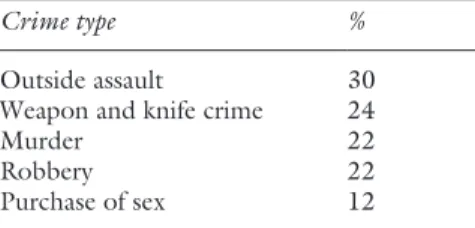
In this step, five types of crimes were analyzed. As seen in the analysis of violent crimes, the ODSs were connected to hot spots of violent crimes in the region. In the analysis of buffer zones, several violent crimes were concentrated at the ODS (Table 16.2). Despite the total area of the buffer zones only accounting for 0.29 percent of the regional land area, a large percentage of crime took place within them. Thirty percent of all outdoor assaults and 22 percent of murders occurred inside the buffer zones.
Citizen safety
The citizen safety survey data were then analyzed to explore if the mapped ODS were locations of citizen unsafety. First, the question in the survey on open drug trade was analyzed to relate to the ODS mapped from the police survey data. In the communities where there were several ODS found by the police departments, survey respondents expressed high levels of problems with open drug trade. Second, survey respondents indicated poor safety perceptions in communities where many ODS were located.
In Figure 16.4, ODS are combined with shootings, unsafety measures and vulnerable areas.
Table 16.2 Crime concentration in ODS
Crime type %
Outside assault 30 Weapon and knife crime 24 Murder 22 Robbery 22 Purchase of sex 12
Figure 16.4 Open drug scenes, shootings and perceived safety measures in the northern
part of Stockholm municipality.
Source: Author.
Vulnerable neighborhoods
The listed areas of vulnerable neighborhoods where criminal networks have a large impact in the local community were then intersected with the ODS. Twenty-one of the ODS in the Stockholm region were located in neighbor-hoods listed as vulnerable or particularly vulnerable. Of the 21 ODS, 18 had criminal networks that sell the drugs.
The ODSs in these neighborhoods had higher prevalence of criminal network distribution of drugs as well as more symptoms of disorder (Table 16.3). The police survey included questions of how the ODS were tackled by the local departments. The ODS in particularly vulnerable neighborhoods had less police resources allocated to the location.
Table 16.3 ODS and vulnerable neighborhoods ODS per neighborhood Severe
ODS (%) Criminal network (%) Old ODS 5 yrs or more (%) Police resource (%)
Particularly vulnerable (8) 75 100 100 13 Vulnerable (13) 54 76 31 53 Unlisted (27) 44 28 50 50
ODS typology
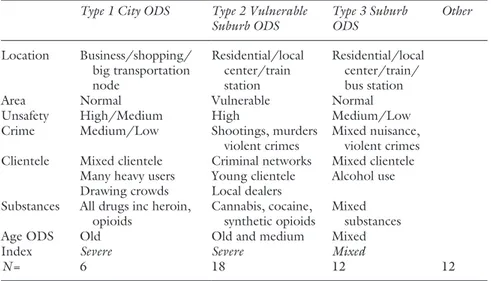
A typology was created where three types of ODS could be clearly grouped. Three types of ODS with characteristics were found:
1. The City ODS type, which has been in place for some time (at least 10 years), has severe disruption and is located in a business area at a big trans-portation hub with medium/high unsafety measures in the citizen survey, with mixed crimes and clientele with heavy abusers, and draws lots of people, and all possible substances are sold.
2. The vulnerable suburb ODS, located in a vulnerable area, at the local center near a train station, with high measures of unsafety in the citizen survey, with shootings, murders and violent crimes and local criminal networks present in the dealing, focused on cannabis, cocaine and synthetic opioids, and severe disruption in the index.
3. The suburb ODS are also located in local centers but not in vulnerable areas and with lower measures of unsafety, with less disruption, and more mixed clientele, substances and crimes. Then there are one third of the ODS that do not fit any of the three types and do not share characteristics enough to be grouped together as a Type 4. These ODS makes up the “Other” category (see Table 16.4).
16.5 Discussion of results
The ODS in Stockholm are overall situated in the inner city and at residential areas in communities close to public transportation nodes, most often metro and train stations, most likely to maximize accessibility to the selling market.
Table 16.4 The typology of ODS in Stockholm, 2017 Type 1 City ODS Type 2 Vulnerable
Suburb ODS Type 3 Suburb ODS Other
Location Business/shopping/ big transportation node Residential/local center/train station Residential/local center/train/ bus station Area Normal Vulnerable Normal Unsafety High/Medium High Medium/Low Crime Medium/Low Shootings, murders
violent crimes Mixed nuisance, violent crimes Clientele Mixed clientele
Many heavy users Drawing crowds Criminal networks Young clientele Local dealers Mixed clientele Alcohol use Substances All drugs inc heroin,
opioids Cannabis, cocaine, synthetic opioids Mixed substances Age ODS Old Old and medium Mixed Index Severe Severe Mixed
They are not a new phenomenon and many have even existed for a decade or longer. Findings do not show clear evidence about their development and whether they might have increased in size or severity. The oldest ODS have more severe characteristics (such as being established crime hotspots and unsafe areas) but shootings occur in all age categories of ODS but less in the youngest ones (0–2 years old).
Principles of routine activity can be helpful to understand the location of ODS, which indicate that crime is likely to occur when motivated offenders, suitable targets and the absence of capable guardians come together in a par-ticular place and time (Cohen & Felson, 1979). Transportation nodes facilitate ODS, since these are locations where large amounts of people are passing every day. Since the drug trade is dependent on users and dealers in the cover of crowds and access to easy getaways, these locations are logical for the activity. In comparison with the United States, where transportation is dependent on cars, which require a drug market to have easy driving routes (Haroscopos & Hough, 2005), the locations described in this study are somewhat different and are dependent on public transportation. A similar pattern was found by Ceccato et al. (2007) in Brazil.
Furthermore, there is crime concentration in and around nodes and paths that are most frequented where a potential offender comes into contact with a suitable target at times when guardianship is lacking (Cohen & Felson, 1979). Since the ODS are located at transportation nodes this might be one of many explanations of the crime concentrations found here. The collections of places that are connected to one another via paths, streets or transportation lines are also the focus of crime patterns theory (see Brantingham & Brantingham, 2013). Transportation offers easy access and escape and lots of people.
Violence
This research suggests that ODS are hotspots for violent crimes outdoor and are places of crime concentration. Even minor violence can be very disturbing and affect the community if done in public spaces (Felson & Eckert, 2018). Drug sales within an apartment might do less harm than public or open air drug markets (Felson & Eckert, 2018). When adding violence to these places the people passing or living at these locations might be strongly harmed. The parti-cipants are exposed to great dangers and need to take major risks. The com-munity members with no part in the drug market, might withdraw from the social spaces due to fear.
There is a known interplay between poverty and structured violence. Factors such as social demography and variables on social disorganization also matter as to where drug markets are located. Some areas have more illegal business-friendly environments, are more tolerant or incapable of disrupting the drug market activity (McCord & Ratcliffe, 2007).
One characteristic that might help to answer the differences of crime distri-bution over neighborhoods could be the concepts of collective efficacy, briefly
explained as the mutual trust and shared expectations to intervene and the agency of social networks in neighborhoods (see Sampson, Raudenbush & Earls, 1997). More recently, Gerell (2018) found a connection between low collective efficacy and high levels of violence in micro places. This tells us that the location of drug markets in neighborhoods has a close connection to social factors but also that the social factors might be connected to the development of ODS. The citizen willingness to report and intervene varies greatly between places due to the closeness to housing and collective efficacy differences (Gerell, 2017; Skogan, 1990). Criminological theories of broken windows (Wilson & Kelling, 1982), collective efficacy (Sampson et al., 1997) and spiral of decay (Skogan, 1990) suggest that areas of low social resources and high levels of crime might make the stronger members in communities move away (Gerell, 2017). In this study, the combination of ODS, shootings and vulnerable neigh-borhoods seems particularly troubling. Further research on this development is needed. For instance, what comes first? The ODS or the negative social devel-opment or some other confounding factor?
When looking at the descriptive statistics from this theoretical perspective, it could be argued that the different variables concerning the surrounding public, geography, police presence and criminal behavior at the ODS could affect the surroundings. Open drug sales can send signals that society has no control over the distribution of sales, which might increase insecurity. Drug sales sites tend to be in areas where insecurity is high which may be further aggravated by open drug sales, especially when combined with lethal gun violence. Insecurity leads to less willingness to help keep order, which results in a lower collective ability. Insecurity can also cause resource-intensive people to move from an area.
Furthermore, in this study, all ODS in the particularly vulnerable neighbor-hoods were old. The numbers of shootings in Sweden have increased in the last 20 years, but with a big peak starting in 2006 (Sturup et al., 2018). The areas in Stockholm with recurrent gun violence have been dealt with and numerous actions are being taken by the police owing to high levels of crime and lethal violence. Could the shootings be connected to the establishment of gangs and criminal networks? Could it be that the shootings are connected to conflicts within and between the criminal networks over turfs and money from drug dis-tribution? If so, is there a time limit to the shootings connected with when the turfs are set? Then the development of the ODS that are newly established and have not had any shootings yet are particularly interesting. In these areas the police and other actors should focus more efforts in order to stop this negative development to more vulnerable areas with high prevalence of gun violence. Some of the newly established ODS are in areas with no social disadvantage and then the collective efficacy might explain the lack of shootings. The collective efficacy in these areas might have contained the violence and made it harder for criminal networks to get established and grow. The newly established ODS might lack shootings until the criminal networks have established their turfs and have areas to protect. Nevertheless there is much to be gained from early inter-vention by the authorities in these emerging and nascent ODS.
In drug crimes, money is an important element. Drug trafficking is based on a market with calculated interactions among market participants, which has similarities with legal markets. As the property rights in this market are not pro-tected by the police and the actors cannot use the court system, often violence is used instead to settle conflicts (Poret & Téjédo, 2006). The substances sold at the drug scenes might be connected to the amount and severity of the viol-ence of the locations. In the ODS in vulnerable neighborhoods, cannabis, cocaine and tramadol are the most common substances. In contrast, in the US, the most violent drug markets are those dealing methamphetamine due to lucrative markets and criminal gangs running the distribution (DEA, 1996). The shootings might be connected to the dealing of cocaine in Sweden, as the drug itself has an influence on aggressive behavior and the drug involves more money than cannabis or tramadol per unit. The more lucrative the business, the more market shares to protect and so the more violence might be needed (Friman, 2009).
Furthermore, this study has shown that ODS can be divided into different types, and that this division can be understood through the lens of criminologi-cal theories. The typology can be used to design specific interventions geared towards the different types of ODS. Research in North America and Australia has shown that drug law enforcement contributes to gun violence (Werb et al., 2011). Understanding what strategies work against the violence might be the first issue to analyze in the more violent drug scenes, whereas other actions might be suggested for the other types of drug scenes. Hot spot policing has been the subject of numerous evaluations, and the evidence suggests that it is effective. Hot spot policing involves identifying these locations and dedicating police resources to them. The underlying logic behind hot spot policing is that if police work in areas where the proportion of crime is highest, they can most efficiently reduce crime at the aggregate level (Mastrofski, Weisburd, & Braga, 2010). ODS Types 1 and 3 might be suitable places for hot spot policing, whereas harm-focused policing strategies (see Ratcliff, 2015) might be better on open drugs scenes Type 2.
16.6 Limitations and conclusion
There are two main limitations of this study, both connected to the collection of the data. This study is based on data from only the year of 2017, this might impose problems to the patterns found. The data are also from only one city, which makes generalizations unreliable. Bigger sets of data from several years would give stronger patterns and more robust results. In addition, the fact that the survey responses are from police employees poses another set of limitations. Other perspectives, for example, from the municipal workers, high school stu-dents, rehabilitation personnel, might show other places of drug use and dealing. On the other hand, the police are important actors at these places and their knowledge and engagement in research is central for implementation of new strategies (Magnusson, 2018). There is also the issue concerning the fact
that crime statistics only show reported crimes. Hibdon and Groff (2014) argue that there are problems with police data on the location of crime because it only captures crimes discovered by (or reported to) police. Police might miss places where undetected or unreported drug problems exist. Population density may also affect police presence, and thereby police statistics. In addition, in Sweden, the National Council of Crime Prevention reported excess police attention to youth drug crime in socially disadvantaged areas compared with “richer” areas. This was despite a high frequency of self-reported use of drugs in the citizen survey (National Council of Crime Prevention, 2018). A study on drug delivery reported similar results (Beckett, Nyrop, & Pfingst, 2006). Furthermore, even within the police, there can be large discrepancies between different police data-sets (Lum, 2008). In this study however, the citizen survey responses on drug trade areas and high measures of unsafety correspond to the location of the ODS found by the police.
This study investigated the spatial nature of ODS in Stockholm, Sweden, showing that there are 48 ODS in the region, and just above 50 percent of them have a clear negative impact on neighborhoods and communities through shootings, crime concentration and poor declared perceived safety of residents. Combining the citizen safety data with the layer of shootings and vulnerable areas produces clear patterns of troublesome overlap. Where residents feel unsafe, there are several ODS, shootings at the drug scenes and the areas are listed as vulnerable areas.
16.7 Research and policy recommendations
While novel in its perspective, this study’s findings are exploratory, drawing on theoretical and empirical evidence found from several patterns of interest con-nected to the ODS in Stockholm County—but there is more to explore. As the drug sales most often include illicit economies, robberies and thefts might be common at and around ODS. This needs further attention. More research is needed on these places and future research could benefit from medical data, such as data on overdoses. The increasing numbers of overdoses in Sweden have been grounds for political debate and could be useful in connection to ODS and enhance the typology.
The knowledge that ODSs are located at transportation stations could be used both by the police and the societal organization for construction and building. The police might prioritize the time and location of patrol to inter-vene but also to prevent drug crimes and the consequences of them. The typology of drug scenes might further give ideas on the kind of intervention that might be appropriate. The old and established ODS in the inner city might lose some of their grip due to police presence and repressive interven-tions, while the same tactic at ODS in the vulnerable areas might result in more violence, turf wars and gang-affiliated shootings due to police seizures of drugs with high street values, due to the connection to established local criminal networks.
The typology in this study can also provide experts with ideas on the cooperation at ODS. Since cooperation with multiagency actors is needed to show long-term results (Connolly, 2006, 2012) the choice of actors is important. Which actors to include in cooperation at the ODS might vary due to type of ODS. If shootings, severe disruption and unsafety as in Type 2 ODS are the main issues in vulnerable areas; then parents, schools and the criminal networks themselves could be part of the solution. Whereas, in the inner city ODS, business owners, Stockholm city building offices, trans-portation companies and health care representatives might be better partners in finding solutions to nuisance, heavy abusers and unsafety at public transportation.
ODS needs attention from both practitioners and research to overcome the impact they have on the community. The interplay between the police prac-tice and research seems central to create evidence-based strategies needed to move away from unsafety and violence surrounding the ODS.
References
Beckett, K., Nyrop, K., & Pfingst, L. (2006). Race, drugs, and policing: understanding disparities in drug delivery arrests. Criminology, 44, 105–137.
Bless, R., Korf, D. J., & Freeman, M. (1995). Open drug scenes: a cross-national com-parison and urban strategies. European Addiction Research, 1, 128–138.
Bonny-Noach, H., & Ronel, N. (2018). Everyday substance insecurity among homeless injection drug users in Israel’s largest open drug scene. Journal of Drug Issues, 48, 645–656.
Brantingham, P., & Brantingham, P. (2013). Crime pattern theory. In R. Wortley & L. Mazerolle (Eds.), Environmental Criminology and Crime Analysis (pp. 78–91). London: Willan Publishers.
Ceccato, V. (2013). Moving Safely: Crime and Perceived Safety in Stockholm’s Subway
Stations. Plymouth: Lexington Books.
Ceccato, V. (2014). The nature of rape places. Journal of Environmental Psychology, 40, 97–107.
Ceccato, V., Haining, R., & Signoretta, P. (2002). Exploring crime statistics in Stockholm using spatial analysis tools. Annals of the Association of American
Geographers, 22, 29–51.
Ceccato, V., Haining, R., & Kahn, T. (2007). The geography of homicide in São Paulo, Brazil. Environment and Planning A, 39, 1632–1653.
Chainey, S., & Ratcliffe, J. (2005). GIS and Crime Mapping. London: Wiley.
Cohen, L. E., & Felson, M. (1979). Social change and crime rate trends: a routine activ-ity approach. American Sociological Review, 44, 588–605.
Connoly, J. (2006). Responding to Open Drug Scenes and Drug-related Crime and Public
Nuisance: Towards a Partnership Approach. Strasbourg: The Pompidou Group’s
Crim-inal Justice Platform.
Connoly, J. (2012). A Better City For All: A Partnership Approach to Address Public
Substance Misuse and Perceived Anti-social Behaviour in Dublin City Centre. Dublin:
Strategic Response Group.
Corsaro, N., & Brunson, R. K. (2013). Are suppression and deterrence mechanisms enough? Examining the “pulling levers” drug market intervention strategy in Peoria, Illinois, USA. International Journal of Drug Policy, 24, 115–121.
DEA Publications (1996). Methamphetamine Situation in the Unites States. Springfield, Virginia: US Drug Enforcement Administration.
European Monitoring Centre for Drugs and Drug Addiction [EMCDDA] (2015). Drugs
Policy and the City in Europe. Luxembourg: Publications Office of the European Union.
European Monitoring Centre for Drugs and Drug Addiction [EMCDDA] (2017). European Drug Report; Trends and Development. Luxemburg: Publications Office of European Union.
Falk, P. (1981). Auflösung einer öffenen Drogenszene. Kriminalistik, 5, 256–259. Felson, M., & Eckert, M. A. (2018). Crime and Everyday Life: A Brief Introduction.
Thousand Oaks, CA: SAGE Publications.
Frank, V. A., & Bjerge, B. (2014). From zero tolerance to non-enforcement: creating a new space for drug policing in Copenhagen, Denmark. Contemporary Drug Problems, 41, 261–291.
Friman, H. R. (2009). Drug markets and the selective use of violence. Crime, Law and
Social Change, 52, 285–295.
Gerell, M. (2017). Neighborhoods without community: collective efficacy and crime in Malmö, Sweden (Doctoral dissertation, Malmö University, Faculty of Health and Society). Gerell, M. (2018). Bus stops and violence, are risky places really risky? European Journal
on Criminal Policy and Research, 24, 351–371.
Gerell, M., Sturup, J., Magnusson, M-M., Rostami, A., Nilvall, K., & Khoshnood, A. (Unpublished manuscript). Open drug markets, vulnerable neighborhoods and gun violence in two Swedish cities.
Goldberg, T. (1993). Narkotika Avmystifierad- ett socialt perspektiv. Stockholm: Carlsson bokförlag.
Goldstein, H. (1990). Problem-Oriented Policing. New York: McGraw-Hill.
Haroscopos, A., & Hough, M (2005). Drug Dealing in Open Air Markets. Problem-
Oriented Guides for Police. Problem-Specific Guides Series: No. 31. US Department of
Justice. Office of Community Oriented Policing Services, USA.
Hibdon, J., & Groff, E. (2014). What you find depends on where you look: using emer-gency medical services call data to target illicit drug use hot spots. Journal of
Con-temporary Criminal Justice 2014, 30, 169–185.
Kennedy, D. M. (1996). Pulling levers: chronic offenders, high-crime settings, and a theory of prevention. Valparaiso University Law Review, 31, 449.
Klingemann, H. K. (1996). Drug treatment in Switzerland: harm reduction, decentrali-zation and community response. Addiction, 91, 723–736.
Levine, N. (2006). Crime mapping and the Crimestat program. Geographical Analysis, 38, 41–56.
Lum, C. (2008). The geography of drug activity and violence: analyzing spatial relation-ships of non-homogenous crime event types, Substance Use & Misuse, 43, 179–201. McCord, E. S., & Ratcliffe, J. H. (2007). A micro-spatial analysis of the demographic
and criminogenic environment of drug markets in Philadelphia. Australian & New
Zealand Journal of Criminology, 40, 43–63.
McNeil, R., Shannon, K., Shaver, L., Kerr, T., & Small, W. (2014). Negotiating place and gendered violence in Canada’s largest open drug scene. International Journal of
Drug Policy, 25, 608–615.
Magnusson, M. M. (2018). Bridging the gaps by including the police officer perspective? A study of the design and implementation of an RCT in police practice and the impact of pracademic knowledge. Policing: A Journal of Policy and Practice.
Magnusson, M. M. (In press). Preventing relapse into drug crime through motivational talks at a drug scene in Stockholm: a randomized controlled trial of a law enforcement tactic. Cambridge Journal of Evidence-Based Policing.
Markovic, J. (2007). Book Review: Chainey, S., & Ratcliffe, J. (2005). GIS and Crime Mapping. London: Wiley. (422 pp., $60.00 paperback). Social Science Computer
Review, 25, 279–282.
Mastrofski, S. D., Weisburd, D., & Braga, A. A. (2010). Rethinking policing: the policy implications of hot spots of crime. In N. A. Frost, J. D. Freilich & T. R. Clear (Eds.),
Contemporary Issues in Criminal Justice Policy (pp. 251–264). Belmont, CA:
Wadsworth, Cengage Learning.
Mazerolle, L., Soule, D., & Rombouts, S. (2005). Drug law enforcement: the evidence. Monograph No 05. DPMP Monograph Series. Fitzroy: Turning Point Alcohol and Drug Centre.
Mazerolle, L., Soule, D. W., & Rombouts, S. (2007). Drug law enforcement: a system-atic review. Police Quarterly, 22, 87–94.
National Council for Crime Prevention (2015). Skjutningar 2006 och 2014— Omfattning, spridning och skador. Kortanalys 7/2015.
National Council for Crime Prevention (2018). Konstaterade fall av dödligt våld 2017. En granskning av anmält dödligt våld 2017.
Olsen, H. (2017). Open drug scenes and police strategies in Oslo, Norway. Journal of
Scandinavian Studies in Criminology and Crime Prevention, 18, 1–16.
Police Authority (2015). Vulnerable neighborhoods—social risk, collective ability and unwanted incidents [Utsatta områden—sociala risker, kollektiv förmåga och oönskade händelser]. Nationella Operativa Avdelningen (NOA). Stockholm: Swedish National Police.
Police Authority (2017). Utsatta områden [Disadvantaged areas]. Stockholm: Swedish National Police.
Poret, S., & Téjédo, C. (2006). Law enforcement and concentration in illicit drug markets. European Journal of Political Economy, 22, 99–114.
Ratcliffe, J. H. (2015). Towards an index for harm-focused policing. Policing, 9, 164–182. Sampson, R. J., Raudenbush, S. W., & Earls, F. (1997). Neighborhoods and violent
crime: a multilevel study of collective efficacy. Science, 277, 918–924.
SCB (2019). Folkmängd i riket, län och kommuner 31 mars 2019 och
befolkningsförän-dringar 1 januari–31 mars. www.statistikdatabasen.scb.se.
Skogan, W. G. (1990). Disorder and Decline: Crime and the Spiral of Decay in American
Neighborhoods. New York: Free Press.
Sturup, J., Rostami, A., Gerell, M., & Sandholm, A. (2018). Near-repeat shootings in contemporary Sweden 2011 to 2015. Security Journal, 31, 73–92.
Sturup, J., Rostami, A., Mondani, H., Gerell, M., Sarnecki, J., & Edling, C. (2019). Increased gun violence among young males in Sweden: a descriptive national survey and international comparison. European Journal on Criminal Policy and Research, 25, 365–378.
UNODC (2009). World Drug Report 2009. Vienna: United Nations Office on Drugs and Crime.
Waal, H., Clausen, T., Gjersing, L., & Gossop, M. (2014). Open drug scenes: responses of five European cities. BMC Public Health, 14, 853.
Weisburd, D., & Green, L. (1995). Policing drug hot spots: the Jersey City drug market analysis experiment. Justice Quarterly, 12, 711–736.
Weisburd, D., & Mazerolle, L. G. (2000). Crime and disorder in drug hot spots: implica-tions for theory and practice in policing. Police Quarterly, 3, 331–349.
Weisburd, D & Amram, S. (2014). The law of concentrations of crime at place: the case of Tel Aviv‐Jaffa. Police Practice & Research, 15, 101–114.
Werb, D., Kerr, T., Fast, D., Qi, J., Montaner, J. S., & Wood, E. (2010). Drug-related risks among street youth in two neighborhoods in a Canadian setting. Health & Place, 16, 1061–1067.
Werb, D., Rowell, G., Guyatt, G., Kerr, T., Montaner, J., & Wood, E. (2011). Review: Effect of drug law enforcement on drug market violence: a systematic review.
Inter-national Journal of Drug Policy, 22, 87–94.
Wilson, J. Q., & Kelling, G. L. (1982). Broken windows: the police and neighborhood safety. The Atlantic. www.theatlantic.com/magazine/archive/1982/03/broken- windows/304465/ (accessed 3 September 2007).