Rapport 22 - 2015
Associations between food intake
and biomarkers of contaminants
in adults
by Erika Ax, Eva Warensjö Lemming, Lilianne Abramsson-Zetterberg, Per Ola Darnerud
and Natalia Kotova
Contents
Summary ... 2
Introduction ... 3
Methods ... 4
Study population ... 4
Assessment of diet ... 5
-
Diet registration ... 5
-
Adherence to dietary recommendations ... 5
Analyses of biological samples ... 6
-
Sampling and storage procedure ... 6
-
Analysis of environmental contaminants ... 6
-
Analysis of mycotoxins ... 7
-
Analysis of micronuclei ... 7
Statistical analyses ... 8
-
Data processing ... 8
-
Environmental contaminants ... 8
-
Mycotoxins ... 9
-
Levels of micronuclei ... 9
Results ... 11
Environmental contaminants ... 11
-
Covariation in environmental contaminant exposure levels ... 11
-
Relations to dietary recommendations ... 11
-
Associations with food groups ... 11
Mycotoxins ... 14
-
Relations to dietary recommendations ... 14
-
Associations with food groups ... 14
Levels of micronuclei ... 14
-
Relations to dietary recommendations and food groups ... 15
-
Relations to environmental contaminants and mycotoxins ... 15
Discussion and conclusions ... 16
Annex I ... 18
Figure 1 ... 21
Summary
A major part of our exposure to a range of environmental contaminants is due to the in-take of foods and beverages. An increasing amount of studies suggest that the exposure to contaminants might be involved in the etiology of several health issues such as obesity, diabetes and cardiovascular disease. Still, the impact of simultaneous exposure to combi-nations of environmental and naturally occurring contaminants is to a large part unknown. Moreover, despite the important role of food intake as source of these contaminants, pop-ulation variability in contaminant exposure levels in relation to dietary habits is poorly explored.
Within the Swedish national dietary survey Riksmaten adults 2010-11, individuals between 18 and 80 years old (n=1008), constituting one fifth of the total sample, were ran-domly selected to take part in a biomonitoring project presented in this report. During the period May 2010 - July 2011, out of the 1008 individuals which were invited, 30 percent accepted to participate (n=300) in the biomonitoring study. Apart from blood and urine sampling, the investigation included a web-based four-day food diary and a
self-administered questionnaire about lifestyle and living conditions. In total, about 50 environ-mental contaminants and mycotoxins were analysed. Cluster analyses were performed to explore the associations between all environmental contaminants investigated. In addition, frequency of micronuclei as a biomarker of genotoxic effect was assessed.
The Healthy Diet Indicator (HDI) is a dietary index based on the World Health Or-ganization’s recommendations. In this study a modified version (mHDI) was used to as-sess an approximal adherence to the Nordic dietary recommendations. Our analyses indi-cated that a higher adherence to dietary recommendations, measured by the mHDI, was associated with lower circulating levels of some chlorinated compounds but higher levels of the mycotoxin deoxynivalenol (DON).
Total intake of fish and shellfish per se was found to be associated with higher levels of oxychlordane, trans-nonachlor, mercury and some perfluorinated compounds. Brominated compounds and plastic associated chemicals were not associated to dietary recommendations or intakes from different food groups in this population. Intake of cereals and poultry were directly associated with levels of DON. An association between exposure to persistent contaminants and micronuclei levels was also observed, but this was not con-firmed in age-adjusted analyses.
A limitation of the present study is that other exposure routes than the diet are not in-cluded in the analysis. Still, an important advantage is the attempt to take the combined exposures into account. Altogether, our data indicate that dietary pattern analysis might be used as an important tool aiming to study associations between food intake and
Introduction
We are exposed to a wide range of contaminants, partly due to the intake of foods and beverages (1, 2). At the levels of contaminants normally present in humans, effects of developmental, reproductive or endocrine disruption can often not be ruled out (3-7). It is known that high exposure to contaminants that naturally occur in food, such as mycotox-ins, may affect human health (8). Still, our knowledge about the health consequences of the combined exposure to contaminants from different sources is limited. Although food intake is an important source of several contaminants, population variability in exposure levels in relation to dietary habits is poorly explored. Studies often focus on individual food component known to be high in certain contaminants whereas few studies include our overall dietary habits in relation to levels of total exposure.
Dietary pattern analysis has become a popular approach in nutrition epidemiology. The method is proposed to have several biological, methodological and analytical ad-vantages since individuals do not consume single nutrients or foods but complex combina-tions of multiple food items (9-11). Dietary pattern analyses are an important complement to the traditional single nutrient or food approach. Association between pre-defined dietary patterns, based on current knowledge or hypotheses of associations between diet and health, and multiple health conditions such as coronary heart disease, cardiovascular disease, dia-betes, breast cancer, colorectal cancer and also all-cause mortality has been reported (12). However, dietary patterns and adherence to dietary recommendations in relation to contam-inant exposure are poorly studied.
The aim of this study was therefore to perform an explorative analysis on how differ-ent food groups and overall dietary habits contribute to exposure to a range of environmen-tal contaminants and some naturally occurring mycotoxins. Dietary habits were assessed as adherence to a pre-defined modified Healthy Diet Indicator (mHDI) – an index resembling the Nordic dietary recommendations (13). Moreover, this study tests the hypothesis of an association between dietary habits and induction of micronuclei (MN) as a biomarker which reflects genetic damage. This was done because the knowledge about possible contribution of the dietary pattern and contaminant exposure to DNA damage is limited.
Methods
Study population
During the period of May 2010 - July 2011, a random sample of individuals between 18 and 80 years old (n=1008), participating in the Swedish nationwide diet survey
Riks-maten adults 2010-11 (14), and constituting one fifth of the total sample, was invited to
take part in a biomonitoring project. The population sampling, performed by Statistics
Sweden, was divided into seven regions according to affiliation to Swedish Occupational
and Environmental Medicine Centers (OEMCs). Each region included the regional capital (Linköping, Lund, Stockholm, Umeå, Uppsala, Gothenburg, and Örebro) together with two randomly selected counties in each region. An equal number of individuals were selected in each region independent of population size. Recruitment took place at four different occasions during the year to cover different seasons (i.e. May-June 2010, Au-gust-September 2010, January-February 2011 and April-Maj 2011). Twelve individuals per part of the region and occasion were invited to participate. Out of the 1008 individu-als which were invited (7 regions, 3 sites in each; the capital and two counties, four occa-sions and 12 individuals per round), 30 percent accepted to participate (n=300) in the biomonitoring study.
Apart from blood and urine sampling, the investigation included a web-based four-day food diary and a self-administered questionnaire about lifestyle and living conditions. From this questionnaire, information on covariates was gathered and categorized as follows:
- education (elementary school only, high-school degree, higher education); - smoking (yes/no);
- weight and length for calculation of body mass index (BMI, kg/m2);
- total time fully breastfeeding (male / not breastfeeding/ 1-6 months / 7-12 months / >12 months).
The samples were collected on average 19 ± 34 days after the first day of dietary re-cording. Individuals who lacked (n=14) or had inadequate (n=3) food records were exclud-ed, resulting in total 283 individuals with both biological samples (analyzed for minimum one contaminant) and dietary data. For information on missing data concerning different variables see “Statistical analyses”.
The study was approved by the Regional Ethics Committee of Uppsala (745/2010) and all participants gave informed consent before entering the study.
Table 1. Outline of the modified Healthy Diet Indicator assessing adherence to the dietary recommendations.
Cut-off Scoring
SFA (% of E) < median 1 (else: 0)
PUFA (% of E) approx. 5-10 1 (else: 0)
Protein (% of E) approx. 10-15 1 (else: 0) Carbohydrates (% of E) approx. 50 -70 1 (else: 0) Sucrose (% of E) > median -1 (else: 0)
Fiber (g/MJ) > median 1 (else: 0)
Fruit and vegetables (g/d) > median 1 (else: 0) Cholesterol (mg/d) < median 1 (else: 0)
Fish (g/d) > median 1 (else: 0)
approx., approximate-ly; d, day; E, energy; PUFA, polyunsaturat-ed fatty acids; SFA,
Assessment of diet
- Diet registration
Diet was assessed by a four day web-based food diary. The registration started on a ran-domly selected day (Tuesday, Wednesday, Saturday or Sunday) in four different rounds during the year, to cover all days of the week and potential seasonal variations on a popu-lation level. Participants were given oral and written information regarding the process of completing the food diary. Written information included a portion guide with photo-graphs for estimation of portion size. Participants without possibility to use the web-based record could report by telephone to interviewers who performed the registration.
The web record was connected to the food composition database (Livsmedelsdata-basen, version Riskmaten adults 2010-05-05) at the Swedish National Food Agency (NFA). This enables automatic calculation of energy and nutrient intake. Before dietary pattern assessment, dietary data was energy adjusted either as energy density or by the residual adjustment method (15). In addition, analysis of food groups was also performed. Dietary intakes were categorized and analyzed in the following food groups: “cereals”, “vegetables and potatoes”, “meat and meat products”, “poultry”, “eggs”, “fat spreads”, “beverages”, “discretionary foods”(including buns, cookies, candies and sweets, sugar, honey, jam, des-serts, snacks, sodas, juice and ice cream), “milk and dairy products”, “fruit and berries”, “fish and shellfish”, “coffee, tea and water”.
- Adherence to dietary recommendations
Dietary compliance with a modified Healthy Diet Indicator (mHDI) was used to assess the individual adherence to the dietary recommendations. The HDI is an established die-tary index based on the World Health Organization’s recommendations (16). This previ-ously published modified version was adapted to conform to the Swedish NFA recom-mendations (17). The outline of the mHDI assessing adherence to the dietary recommen-dations is given in Table 1. The dietary index was based on the intake range of prede-fined nutrients and foods in the population. This was done by either using the median intake of nutrients/foods as cut-off or the preferred range of intake. Intakes considered in line with the recommendations were given 1 point, else 0, except for sucrose intake where high intakes (above the median in the population) were given a negative score -1 point, else 0 point (15, 16). Individual scores on the included variables were summed up to a total score which could take a value between -1 (not at all conforming to the score) to 8 (very compliant with the score). Hence, the higher score the more adherent to the recom-mendations. Males and females were scored separately.
Analyses of biological samples
- Sampling and storage procedure
Non-fasting blood samples and single spot urine were sampled at the OEMCs or by local health centers. Blood was drawn from an antecubital vein. Fresh whole blood for the analysis of MN was directly sent to the NFA. For specific analyses in serum or plasma, the fractions were separated before sample storage at -20°C until analysis. Urine samples were stored at -20 °C until analysis.
- Analysis of environmental contaminants
The levels of environmental contaminants were determined at different laboratories as follows:
- Chlorinated compounds were analyzed in serum by gas chromatography high reso-lution mass spectrometry (HRGC/HRMS) at the Institute for Health and Welfare in Helsin-ki, Finland (18). The compounds included were polychlorinated biphenyls (PCBs) 28, 52, 118, 138, 153, 156, 170, 180; hexachlorobenzene (HCB), β-Hexachlorocyclohexane (β-HCH), oxychlordane, trans-nonachlor, diklordifenyltrikloretan (DDT) and p,p-dichlorodiphenyldichloroethylene (p,p-DDE) together with polybrominated diphenyl ether congener BDE-47.
- Heavy metals were analyzed in whole blood at the OEMC in Lund (19). Cadmium and lead were analyzed by inductively coupled plasma mass spectrometry (20) and total mercury by fluorescence spectrometry (21).
- Perfluoroalkyl acids (PFAAs) were analyzed in serum by liquid chromatography tandem mass spectrometry (HPLC-MS/MS) at the OEMC in Lund (22). From this group, the following homologues were analyzed: PFHxS, PFHpA, PFOA, PFNA, PFOS, PFDA, PFUnDA, PFDoA (23).
- Plastic associated compounds (PACs) phthalate metabolites and BPA were analyzed in urine by quadrupole ion trap mass spectrometry at the OEMC in Lund. The phthalate metabolites included MEP, MnBP, MBzP, MEHP, 5-oh-MEHP, 5-oxo-MEHP, 5-cx-MEPP, 7-oh-MMeOP, 7-oxo-MMeOP and 7-cx-MMeHP (Ax et al. 2015, submitted).
- Brominated diphenyl ethers were analyzed in serum by an accredited HRGC/LRMS method at the NFA (24). The selected compounds were PBDEs (BDE-28, 47, 66, 99, 100, 138, 153, 154/BB-153, 183, 209) and hexabromocyclododecane (HBCD).
- Creatinine was measured in urine by an enzymatic method as previously described (25) and urine density was determined by a urine hand refractometer from ATAGO (Tokyo, Japan) at the OEMC in Lund.
- Ferritin and folate concentrations in plasma were assessed by chemiluminescent mi-croparticle immunoassay (ARCHITECT, Abbott, US) at the clinical laboratory (Akad-emiska Sjukhuset, Uppsala, Sweden).
The environmental contaminants measured in the Riksmaten adults 2010-11 biomoni-toring study are listed in Annex 1, together with abbrevations and limits of detection or quantification. For further analytical details see “Environmental pollutants in blood and urine, and associations to reported food intake in Riksmaten 2010-11” (26) (in Swedish). Due to technical problems, some analyses failed. Also, due to limited amount of biological material certain contaminants were excluded from analysis. As a result, chlorinated com-pounds and BDE-47 were analyzed in 267 individuals, heavy metals in 297 individuals, PFAA’s in 292 individuals and PACs in 296 individuals. Additional brominated com-pounds were analyzed in 170 subjects. The following substances were excluded due to high frequency of non-detects (0-values, skewed data not reaching normality by transformation); p, p'-DDT, PCB 52, PFHpA, PFDoDA, PBDE 66, PBDE 138, HBCD. For the remaining substances, all samples with non-zero values were used even if they were below the theoret-ical limit of detection or quantification (LOD/LOQ).
- Analysis of mycotoxins
Urinary biomarkers DON and OTA were analyzed in 146 and 118 individuals, respective-ly, as previously described (27).
- Analysis of micronuclei
MN were detected in young transferrin positive reticulocytes (Trf-Ret) in peripheral blood. The cells were isolated by immunomagnetic isolation and analyzed in a FACStar Plus flow cytometer (Becton Dickinson, Sunnyvale, CA) and the frequency of MN (fMN) was calculated as previously described (28). Analyses were performed by the Swedish NFA. Totally, 241 blood samples were analyzed. However, due to technical problems, only 129 samples remained for data analysis.
Statistical analyses
- Data processing
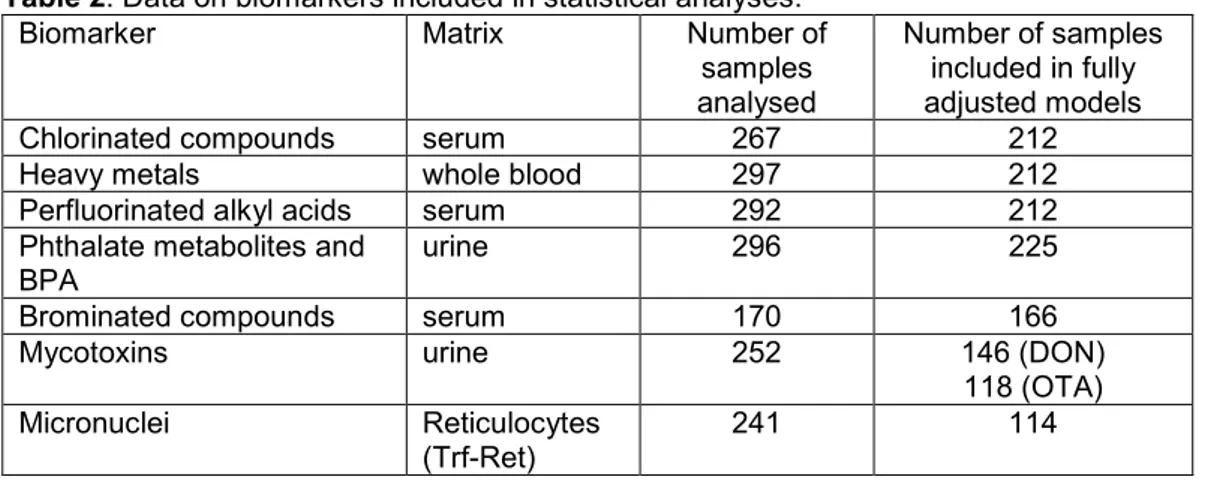
Blood measurements of chlorinated compounds, heavy metals and PFAAs were assessed as raw data, whereas PBDEs were lipid-adjusted before analysis. Urine levels of phthalate metabolites and BPA were assessed as density-adjusted and levels of mycotoxins as cre-atinine-adjusted variables. All statistical analyses were conducted in STATA/IC 12.1 (StataCorp LP, US) with significance level set to ≤ 0.05. An overview of data on bi-omarkers included in statistical analyses is presented in Table 2.
Table 2. Data on biomarkers included in statistical analyses.
Biomarker Matrix Number of
samples analysed
Number of samples included in fully adjusted models
Chlorinated compounds serum 267 212
Heavy metals whole blood 297 212
Perfluorinated alkyl acids serum 292 212
Phthalate metabolites and
BPA urine 296 225
Brominated compounds serum 170 166
Mycotoxins urine 252 146 (DON)
118 (OTA)
Micronuclei Reticulocytes
(Trf-Ret) 241 114
- Environmental contaminants
Hierarchical average linkage cluster analysis on dissimilarity measures based on Spear-man rank correlations was used to visualize possible associations in exposure levels. Cluster analyses were repeated with and without non-persistent contaminants (e.g. PACs) as well as with and without brominated compounds.
Associations between circulating levels of environmental contaminants (chlorinated compounds including one brominated compound BDE-47, heavy metals and PFAAs) and dietary habits were mutually assessed in multivariate regression analyses. This gives the opportunity to test the associations between the dietary pattern and levels of each contami-nant at one time in a global test, thereby avoiding multiple testing. Brominated compounds were assessed separately due to the limited number of observations. Similarly, phthalate metabolites and BPA were analyzed separately due to their non-persistent character. This also enabled substance specific adjustments in the statistical model. Non-normally distrib-uted variables were transformed to reach normality before analyses, either by taking the logarithm or the square root, a decision based on which of the methods that suited the data best. Adherence to the dietary recommendations was assessed as individual mHDI score (continuous). Intakes from different food groups were applied as energy adjusted variables in grams per day.
Associations were first tested in crude analyses and thereafter adjusted for possible confounders such as: a) environmental contaminants chosen based on field specific knowledge and previous analyses in the population; b) energy intake (continuous), age (continuous), gender (female/male), sampling region (categorical), education (categorical;
elementary school / high-school degree / higher education), smoking (yes/no) and BMI (continuous).
In fully adjusted analyses of chlorinated compounds, metals and PFAAs, breastfeeding period (categorical; male / no breastfeeding / 1-6 months / 7-12 months / more than 12 months) and plasma ferritin (continuous) were included. When including breastfeeding in the model, gender was excluded as a covariate, due to high collinearity between the two variables and instead included in the categorization of the breastfeeding-variable. If in-flammation is present, plasma ferritin might be falsely high, hence individuals with CRP > 5ml/L were excluded from the fully adjusted analyses (29).
The fully adjusted model for PACs (phthalate metabolites and BPA) was in addition adjusted for residential factors previously shown to relate to urinary levels of these contam-inants. The factors were as follows: home construction period (before 1900/1900,
1959/1960, 1979/1980, 1999/2000 or later), living area (sparsely built area / small town / medium sized town / large town), PVC-floor (yes/no, newer than 10 years), and consump-tion of foods packed in a tube (five categories from never to every day) (Ax et al. 2015, submitted). Due to failure to complete the questionnaire (n=5) or missing information on specific questions (smoking n=8, BMI n=7), and/or missing data on plasma ferritin (n=32), fully adjusted analysis of chlorinated compounds, metals and PFAAs was applied for 212 individuals. Additional missing data on residential factors (living area n=4, home construc-tion period n=23, PVC flooring n=39) and consumpconstruc-tion of foods packed in a tube (n=12) limited fully adjusted analyses on phthalate compounds (n=225) . In adjusted analyses of brominated compounds, 166 individuals remained. When not limited by population size, models included categorical covariates as factor variables.
- Mycotoxins
Naturally occurring mycotoxins were assessed separately. Statistical analyses included evaluation of demographic variables, assessed either by Kruskal Wallis test or ANOVA. Based on these results and previous knowledge, adjusted regression analyses of mycotox-ins included energy intake (continuous) and gender (female/male). Also, an additional model was tested which included age and BMI (both continuous) for ease of comparison with previous analyses in this population (30). Due to missing data on included covari-ates, as described above, data analyses of DON and OTA included 146 and 118 individu-als, respectively. Sensitivity analyses excluding outliers, identified as individuals with levels above p75+1,5*IQR for DON (n=8) and OTA (n=8), were also modelled.
- Levels of micronuclei
The fMN was assessed in relation to demographic variables either by Kruskal Wallis test or ANOVA. Associations with diet were tested in a crude and an adjusted model, includ-ing energy intake (continuous) and age (continuous). Additionally, in a fully adjusted model, gender (female/male), education (categorical; elementary school / high-school degree / higher education), smoking (yes/no) and BMI (continuous) were also included. Models were also executed including plasma folate (continuous). Sensitivity analyses excluding outliers, identified as individuals with levels above p75+1,5*IQR (n=8) were also modelled. Due to missing data, fully adjusted analyses of fMN levels included 114 individuals.
Possible associations between fMN and levels of contaminants were tested in regres-sion analyses with fMN as the dependent variable. Crude analyses were first adjusted for age only and then in addition for education (categorical; elementary school / high-school degree / higher education), smoking (yes/no) and plasma folate. Moreover, analyses were also stratified on age (18-30, 31-44, 45-64, >65 years).
Results
Environmental contaminants
- Covariation in environmental contaminant exposure levels
A dendogram from cluster analyses is presented in Figure 1. Clustering occurred mainly within certain groups of contaminants. Phthalate metabolites from the same parent com-pounds clustered together and some brominated comcom-pounds were gathered in one cluster. Clustering was however strongest among the chlorinated compounds, above all between PCB 170, PCB 180 and PCB 156, PCB 138 and PCB 153, and between trans-nonachlor and oxychlordane. Including or excluding non-persistent contaminants did not alter clus-tering between the remaining variables.
- Relations to dietary recommendations
The global test showed a significant association between adherence to the mHDI and overall exposure of chlorinated compounds, metals and PFAAs in unadjusted analyses (p = 0.016). The results were consistent in analyses adjusted for energy intake, age, sam-pling region, education, smoking and BMI, as well as when including breast feeding peri-od and plasma ferritin (p = 0.0008). A higher adherence to the score was associated with lower circulating levels of HCB, beta-HCH, trans-nonachlor, PCB 138, PCB 153, PCB 156, PCB 170 and PCB 180. Percentage difference in geometric mean (GM) levels per increase in score (1 point) is presented in Table 3. Neither brominated compounds nor urinary levels of phthalate metabolites and BPA were associated with mHDI adherence in crude (PBDE: p = 0.46; phthalates and BPA: p = 0.59) or in adjusted analyses (PBDE: p = 0.28; phthalates and BPA: p = 0.70) (data not shown).
- Associations with food groups
A global test of multivariate regression analyses between food groups and circulating levels of environmental contaminants implied strong significant associations (p<0.0001) which persisted in adjusted analyses (p = 0.014). Associations seemed to, above all, be driven by intake of “fish and shellfish” (p = 0.002). Significant associations with specific contaminants are presented in Table 4. Including categorical covariates in the adjusted model showed similar results (p = 0.015). This test also indicated an association between intake of “coffee, tea and water” (p = 0.026) and “fruit and berries” (p = 0.029) with overall contaminant exposure. However, due to limited number of observations in relation to degrees of freedom, the latter model should be interpreted with caution. In addition, for “coffee, tea and water”, there was no significant association with any specific contami-nant. The relation to “fruit and berries” was driven by inverse associations with beta-HCH, PCB 156, PCB 170 and PCB 180.
Global analyses proposed an association between certain food groups and levels of PBDEs (p = 0.006), however not persistent in adjusted analyses (p = 0.28). Phthalate me-tabolites and BPA were also associated to some food groups in crude (p = 0.012) but not in adjusted analyses (p = 0.23).
Table 3. Differences in geometric mean level of some circulating environmental con-taminants associated with 1 point higher mHDI scorea HCB -5.1* β-HCH -7.3** oxychlordane -3.2 trans-nonachlor -4.1 p,p'-DDE -41 PCB-28 0.2 PCB-118 -3.1 PCB-138 -4.4* PCB-153 -4.4* PCB-156 -4.9* PCB-170 -4.7*** PCB-180 -4.7*** BDE-47 -1.9 Cadmium 3.4 Lead -0.7 Mercury 0.8 PFHxS 1.6 PFOA 1.0 PFNA -0.2 PFOS -1.3 PFDA -0.9 PFUnDA -1.4
aDifferences in geometric mean level related to 1 point higher mHDI score and
ad-justed for energy intake, age, region, education, smoking, BMI, breastfeeding peri-od and plasma ferritin;
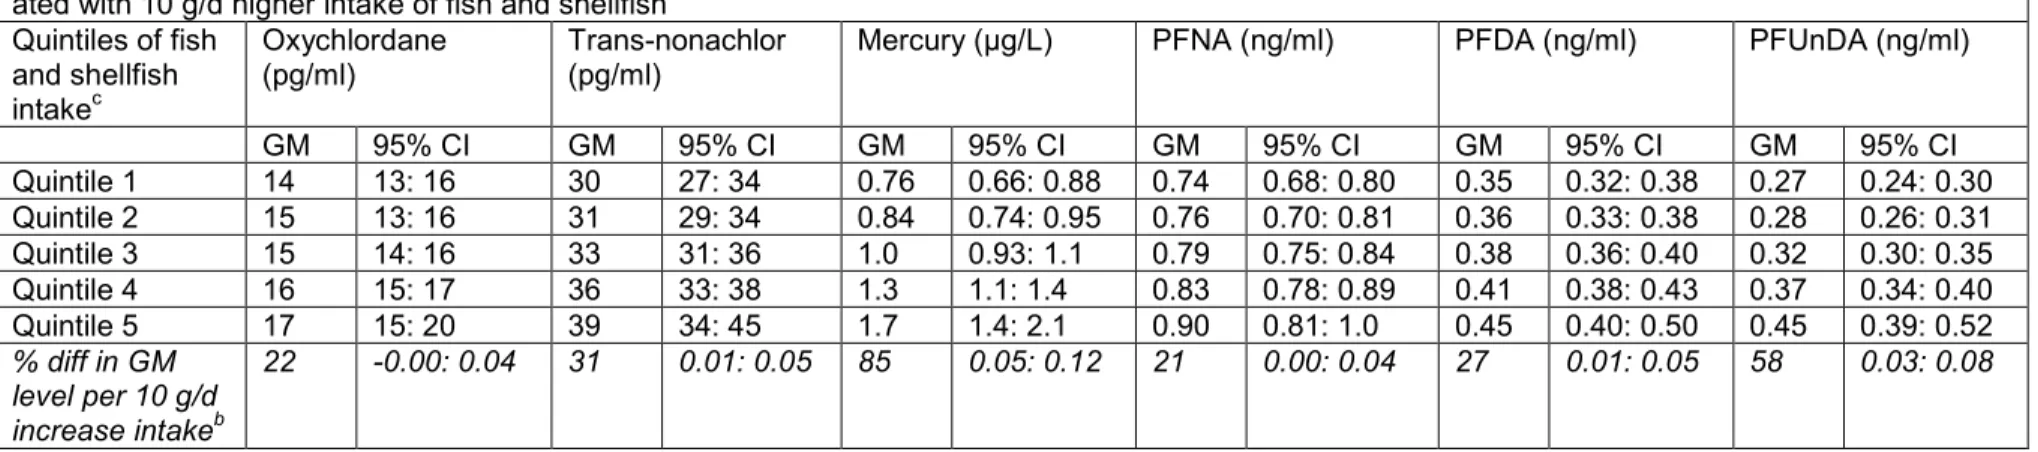
Table 4. Geometric mean (GM) levels of certain contaminants per quintile of fish and shellfish intake a and percentage difference in GM levels associ-ated with 10 g/d higher intake of fish and shellfishb
Quintiles of fish and shellfish intakec
Oxychlordane
(pg/ml) Trans-nonachlor (pg/ml) Mercury (µg/L) PFNA (ng/ml) PFDA (ng/ml) PFUnDA (ng/ml)
GM 95% CI GM 95% CI GM 95% CI GM 95% CI GM 95% CI GM 95% CI Quintile 1 14 13: 16 30 27: 34 0.76 0.66: 0.88 0.74 0.68: 0.80 0.35 0.32: 0.38 0.27 0.24: 0.30 Quintile 2 15 13: 16 31 29: 34 0.84 0.74: 0.95 0.76 0.70: 0.81 0.36 0.33: 0.38 0.28 0.26: 0.31 Quintile 3 15 14: 16 33 31: 36 1.0 0.93: 1.1 0.79 0.75: 0.84 0.38 0.36: 0.40 0.32 0.30: 0.35 Quintile 4 16 15: 17 36 33: 38 1.3 1.1: 1.4 0.83 0.78: 0.89 0.41 0.38: 0.43 0.37 0.34: 0.40 Quintile 5 17 15: 20 39 34: 45 1.7 1.4: 2.1 0.90 0.81: 1.0 0.45 0.40: 0.50 0.45 0.39: 0.52 % diff in GM level per 10 g/d increase intakeb 22 -0.00: 0.04 31 0.01: 0.05 85 0.05: 0.12 21 0.00: 0.04 27 0.01: 0.05 58 0.03: 0.08
D = day; diff = difference;
aEstimated by post estimation tests on multiple regression analyses (adjusted for energy intake, age, sampling region, education, smoking, BMI, breast feeding and plasma
ferritin) of each contaminant on fish and shellfish intake;
bCalculated based on coefficients from multiple regression analysis ((100*(EXP(beta-coeff)-1)) *10) adjusted as above (a); cMedian (p95) fish intake (g/d) per quintile; Q1, 0 (0); Q2, 12 (0.8, 20); Q3, 36 (23, 47), Q4, 61 (49, 70); Q5, 89 (73, 153).
Mycotoxins
Women had non-significantly higher levels of DON and significantly higher levels of OTA (p = 0.0003) compared to men. Urinary levels of mycotoxins were not related to age. Median DON levels were highest in the samples from Umeå region and lowest in Stockholm region. The same pattern was also seen for OTA. However, the differences were not significant for either substance. Levels of DON and OTA were not related to BMI, smoking or education.
- Relations to dietary recommendations
DON was directly associated with adherence to the mHDI (p = 0.008) in crude analyses, and the results persisted when adjusting for energy and gender (p = 0.005). In fully ad-justed analyses (including age and BMI), 1 point increase in score was associated with 16 % higher geometric mean levels of DON (p = 0.011). By observation from the plots, the association seemed to level off with a higher score, however few individuals had extreme mHDI-scores (≥ 7p, n=11). OTA was not associated with the mHDI score. Results did not change, neither when including sampling region in the model, nor when excluding outli-ers (n=8).
- Associations with food groups
There were no associations between food groups and urinary levels of OTA. In crude analysis, DON was directly associated with intakes of cereals (p<0.001) and inversely related to intake of poultry (p<0.05), results which persisted in fully adjusted analyses.
Levels of micronuclei
The fMN differed significantly by age group (18-30; 31-44; 45-64; >65 years), and was higher with higher age, also when adjusting for other demographic factors and excluding outliers (n=8). The fMN was higher among men, however gender was not significantly associated with fMN when taking age into account. There were no significant differences in fMN associated with sampling region or BMI. fMN was lower in individuals with higher education compared to individuals with lower education. However, this difference was not significant when including age. There were also indications for a higher fMN in non-smokers, however, significant only when excluding outliers (in crude and age-adjusted analyses).
An inverse association between plasma folate and fMN was detected in crude regres-sion analyses and consistent when adjusting for age, and also when including gender, edu-cation, BMI and smoking in the model (-0.35, p = 0.011). The association was attenuated and not significant when excluding outliers (-0.22, p = 0.054, n=8). For erythrocyte folate, the results seemed even stronger (-0.83, p = 0.007) and this remained in adjusted analyses (-0.84, p = 0.005). However, the relation to erythrocyte folate was not significant when excluding outliers (-0.37, p = 0.164, n=8). Noteworthy, there were indications for non-linear relationship in scatter plots.
- Relations to dietary recommendations and food groups
There was no association between diet and fMN. Neither the mHDI nor intakes from specific food groups were associated with fMN.
- Relations to environmental contaminants and mycotoxins
Levels of MN were directly associated with levels of oxychlordane, trans-nonachlor, PCB-138, PCB-153, PCB 156, PCB 170, PCB 180, PFOS and inversely related to PBDE 183 in crude analyses. In ageadjusted analyses only relations to PBDE 183 remained (β -0.23, p = 0.043), whilst an inverse association with lead emerged (β -0.37, p= 0.009). Including plasma folate in the models did not change the associations, this persisted when adjusting for age and smoking (β -0.35 and p = 0.013 for lead; β -0.26 and p = 0.021 for PBDE 183) and also when excluding outliers on both fMN and the contaminant. For PBDE 183 there were indications for non-linearity in scatter plots.
Age was related to fMN which might be a result of accumulation of persistent organic pollutants in the body over time. Age is often related to higher levels of contaminants, espe-cially the persistent and bioaccumulative compounds. For this reason, it is difficult to sepa-rate the potential effect of contaminant exposure on fMN, from that of age. As an attempt to handle this, age-stratified analyses were performed (age-groups 18-30, 31-44, 45-64, >65 years), but this was limited by small subgroups (11-39 individuals per group in adjusted analyses, depending on the contaminant studied). No significant associations were found for above mentioned chlorinated compounds in different age-groups; however a pattern could be seen where β-coefficients were substantially higher in the highest age-group. For PFOS, a significant positive association was found in the highest age group when adjusting for education, smoking and plasma folate (β 0.81, p= 0.016). There were no associations be-tween mycotoxins (DON and OTA) and fMN in regression analyses.
Discussion and conclusions
This study was conducted as an attempt to explore the associations between food intake and body burden of contaminants in humans. It underlines the importance of taking com-bined exposures from different sources into account when evaluating diet and its implica-tions on health.
Although fish and shellfish is a considerable dietary source of several environmental contaminants, regular intake is still an important part of the dietary recommendations. It would be logical to assume that individuals who are more adherent to dietary recommenda-tions would have higher circulating levels of the related contaminants. However, a higher adherence to dietary recommendations, measured by a mHDI, was associated with lower circulating levels of chlorinated compounds. Total intake of fish and shellfish per se was still associated with higher levels of oxychlordane, trans-nonachlor, mercury, PFNA, PFDA and PFUnDA. This implies the importance of considering overall dietary habits in relation to contaminant exposure.
A higher adherence to dietary recommendations, measured by a mHDI, was associated with higher levels of DON. Intake of cereals and poultry were directly associated with lev-els of DON. DON is mainly found in cereal products, and the present results from both dietary pattern analyses and food groups are consistent and consort with previous results in this population (30).
Brominated compounds and PACs were not associated to dietary recommendations or total intake from different food groups in this population. It might indicate that other dietary or lifestyle factors, which were not assessed here, contribute to those exposures and also obscure associations. Some examples are cooking procedure and packaging of food, certain occupational exposure or direct contact with technical equipment or plastic products in the home.
Our analysis of relations between diet and induction of MN does not indicate an over-all association between a dietary pattern following the dietary recommendations.
MN formation was associated with age and folate status which has been shown previously (28, 31). The suggested association between exposure to persistent contaminants and fMN disappeared in age adjusted analyses. Since persistent contaminants accumulate in the body with age, aging could be a confounding factor in this setting. It could be hypothesized that persistent contaminants might also be a mediating factor in the association between age and fMN.
Analyses of relations between exposure to specific contaminants, DON, lifestyle fac-tors and diet were previously conducted by the Swedish NFA (18, 19, 23, 30) (Ax et al. 2015, submitted). The present study used a pre-defined diet index to capture how dietary recommendations relate to environmental and naturally occurring contaminants. Since rec-ommendations often are based on food groups, we also explored the impact of overall in-take from food groups on contaminant exposure levels.
The Riksmaten adults 2010-11 study is a valuable population-based nationwide survey which includes both men and women of different age groups from the general population. It
includes both dietary data and assessment of a body burden of contaminants, mycotoxins and MN. As participation rate was low (30%), the participants were compared with register data from non-participants. This comparison did not show any significant differences with regard to geographical region, income, age or gender. The only factor, where a difference was observed was educational level, where higher education was more common among participants. By use of the information from the questionnaires, we were able to adjust for possible confounders; however, residual confounding cannot be excluded.
In this study, non-fasting blood and urine samples were collected during all seasons, however the time period between sampling and diet record varied vastly. Though such fac-tors might obscure some associations, we were able to detect relations between diet and exposure to contaminants in accordance with what could be expected based on previous knowledge and existing literature. However, the interpretation of our results is complicated by the limited population size, especially in stratified or observation-restricted analyses. Some contaminants with restricted observations were analyzed separately and we did not at this point exclude high values (outliers) on individual environmental contaminants, since it would limit our study population even further.
Altogether, our data indicate that dietary pattern analysis could be used as an im-portant tool to explore the associations between food intake and body burden of contami-nants in humans.
Annex I
List of environmental contaminants analyzed in the
Riksmaten adults 2010-11
bio-monitoring study, including limits of detection (LOD) or quantification (LOQ), and number of subjects with levels below this limit.Chlorinated compounds
• Polychlorinated biphenyl (PCB) 28; 2,4,4'- trichlorobiphenyl [LOQ=3 pg/ml, n<LOQ=13]
• Polychlorinated biphenyl (PCB) 52; 2,2',5,5'-tetrachlorobiphenyl [LOQ=3 pg/ml, n<LOQ=237]
• Polychlorinated biphenyl (PCB) 118; 2,3',4,4',5-pentachlorobiphenyl [LOQ=3 pg/ml, n<LOQ=0]
• Polychlorinated biphenyl (PCB) 138; 2,2',3,4,4',5'-hexachlorobiphenyl [LOQ=3 pg/ml, n<LOQ=0]
• Polychlorinated biphenyl (PCB) 153; 2,2',4,4',5,5'-hexachlorobiphenyl [LOQ=3 pg/ml, n<LOQ=0]
• Polychlorinated biphenyl (PCB) 156; 2,3,3',4,4',5- hexachlorobiphenyl [LOQ=3 pg/ml, n<LOQ=7]
• Polychlorinated biphenyl (PCB) 170; 2,2',3,3',4,4',5- hexachlorobiphenyl [LOQ=3 pg/ml, n<LOQ=0]
• Polychlorinated biphenyl (PCB) 180; 2,2',3,4,4',5,5'- hexachlorobiphenyl [LOQ=3 pg/ml, n<LOQ=0]
• hexachlorobenzene (HCB) [LOQ=10 pg/ml, n<LOQ=0]
• beta-hexachlorocyclohexane (β-HCH) [LOQ=10 pg/ml, n<LOQ=40]
• oxychlordane; 1-alpha,2-beta,4-beta,5,6,7-beta,8,8-octachloro-2,3 alpha-epoxy-3a alpha,4,7,7a
[LOQ=10 pg/ml, n<LOQ=87]
• trans-nonachlor; 1,2,3,4,5,6,7,8,8-nonachloro-3a,4,7,7a-tetrahydro-4,7-methanoindan [LOQ=3 pg/ml, n<LOQ=3]
• p,p'- dichlorodiphenyltrichloroethane (DDT); 1,1-bis-(4-chlorophenyl)-2,2,2-trichlorethane
[LOQ=100 pg/ml, n<LOQ=266]
• p,p'- dichlorodiphenyldichloroethylene (DDE); 1,1-dichloro-2,2-bis(p-chlorophenyl)ethylene [LOQ=10 pg/ml, n<LOQ=0] Heavy metals: • Cadmium (Cd) [LOQ=0.04 µg/l, n<LOQ=1] • Lead (Pb) [LOQ=0.11 µg/l, n <LOQ=0] • Mercury (Hg) [LOQ=0.09 µg/l, n<LOQ=4]
Perfluorinated alkyl acids:
[LOD=0.10 ng/ml, n<LOD=280] • PFHxS; Perfluorohexanesulfonic acid
[LOD=0.02 ng/ml, n<LOD=0] • PFOA; Perfluorocaprylic acid [LOD=0.27 ng/ml, n<LOD=2] • PFNA; Perfluorononanoic acid
[LOD=0.08 ng/ml, n<LOD=0] • PFOS; Perfluorooctanesulfonic acid
[LOD=0.05 ng/ml, n<LOD=0] • PFDA; perfluorodecanoic acid [LOD=0.03 ng/ml, n<LOD=0] • PFUnDA; Perfluoroundecanoic acid
[LOD=0.08 ng/ml, n<LOD=6] • PFDoDA; perfluorododecanoic acid
[LOD=0.07 ng/ml, n<LOD=227]
Plastic associated compounds:
• Bisphenol A (BPA)
[LOD=0.1 ng/ml, n<LOD=3] • mono-ethyl phthalate (MEP)
[LOD=0.4 ng/ml, (<LOD=0] • mono-n-butyl phthalate (MnBP)
[LOD=0.6 ng/ml, (<LOD=0] • mono-benzylphthalate (MBzP)
[LOD=0.03 ng/ml, (<LOD=0]
• mono-(2-ethyl-hexyl) phthalate (MEHP) [LOD=0.1 ng/ml, n<LOD=0]
• mono-(2-ethyl-5-hydroxylhexyl) phthalate (5-OH-MEHP) [LOD=0.01 ng/ml, n<LOD=0]
• mono-(2-ethyl-5-oxohexyl) phthalate (5-oxo-MEHP) [LOD=0.06 ng/ml, n<LOD=0]
• mono-(2-ethyl-5-carboxypentyl) phthalate (5-cx-MEPP) [LOD=0.01 ng/ml, n<LOD=0]
• mono-(4-methyl-7-hydroxyloctyl) phthalate (7-OH-MMeOP) [LOD=0.005 ng/ml, n<LO)=0]
• mono-(4-methyl-7-oxo octyl) phthalate (7-oxo-MMeOP) [LOD=0.004 ng/ml, n<LOD=0]
• mono-(4-methyl-7-carboxyheptyl) phthalate (7-cx-MMeHP) [LOD=0.01 ng/ml, n<LOD=0]
Brominated compounds
• Brominated diphenyl ether (BDE)-28 ; 2,4,4’-tri-BDE
[LOQ= 1,25 ng/kg, n<LOQ= 165]
• Brominated diphenyl ether (BDE) 47; 2,2’,4,4’-tetra-BDE
[LOQ= 6,1 ng/kg, n<LOQ= 137]
• Brominated diphenyl ether (BDE) 66; 2,3’4,4’-tetra-BDE
[ LOQ= 1,25 ng/kg, n<LOQ= 169]
• Brominated diphenyl ether (BDE) 99; 2,2’4,4’,5-penta-BDE
[LOQ= 9,7 ng/kg, n<LOQ= 165]
[LOQ= 2,1 ng/kg, n<LOQ= 133]
• Brominated diphenyl ether (BDE) 138; 2,2’,3,4,4’,5-hexa-BDE
[LOQ= 1,25 ng/kg, n<LOQ= 169]
• Brominated diphenyl ether (BDE) 153; 2,2’,4,4’,5,5’-hexa-BDE
[LOQ= 1,25 ng/kg, n<LOQ= 1]
• Brominated diphenyl ether (BDE) 154 (2,2’,4,4’,5,6’-hexa-BDE) and
bromo-biphenyl (BB)-153 (2,2’,4,4’,5,5’-hexa-BB) [LOQ= 1,25 ng/kg, n<LOQ= 74)
• Brominated diphenyl ether (BDE) 183; 2,2’,3,4,4’,5’,6-hepta-BDE
[LOQ= 1,25 ng/kg, n<LOQ= 161]
• Brominated diphenyl ether (BDE) 209; deka-BDE
[LOQ= 3,3 ng/kg, n<LOQ= 47] • Hexabromocyclododecane (HBCD)
Figure 1
HCB ß-HCH Oxychlordane Trans-nonachlorPCB 153 PCB 138 PCB 156 PCB 180 PCB 170 PCB 118 p,p' DDE PBDE 154 and BB 153Hg PFOA PFOSPFNA PFDA PFUnDAPb PCB28HBCD PFHxS p,p' DDTPCB 52 PFDoDABDE 47 PBDE 028 PBDE 047 PBDE 100 PBDE 099 PBDE 183 PBDE 066 PBDE 153MEP PBDE 138MnBP MBzP MEHP ohMEHP oxoMEHPcxMEPP ohMMeOP oxoMMeOPcxMMeHP Bisphenol APBDE 209 Cd PFHpA 0 0.2 0.4 0.6 0.8 1 user matrix spear dissimilarity measureReferences
1. UNEP. Regionally Based Assessment of Persistent Toxic Substances.
Châtelaine, Switzerland: UNEP Technology, Industry and Economics Division,
2003.
2. Liem AK FP, Rappe C. Exposure of populations to dioxins and related
compounds. Food additives and contaminants. 2000;17 (4):241-59.
3. WHO. Health risks of persistent organic pollutants from long-range
transboundary air pollution. Copenhagen, Denmark: World Health Organization,
2003.
4. WHO. Health risks of heavy metals from long-range transboundary air
pollution. Copenhagen, Denmark World Health Organization, 2007.
5. EFSA. Opinion of the Scientific Panel on Contaminants in the Food chain on
Perfluorooctane sulfonate (PFOS), perfluorooctanoic acid (PFOA) and their salts.
European Food Safety Authority, 2008.
6. EFSA. EFSA Panel on Contaminants in the Food Chain (CONTAM);
Scientific Opinion on Polybrominated Diphenyl Ethers (PBDEs) in Food. 2011.
7. Lind L, Lind PM. Can persistent organic pollutants and plastic-associated
chemicals cause cardiovascular disease? J Intern Med. 2012 Jun;271(6):537-53.
8. Pestka JJ. Deoxynivalenol: mechanisms of action, human exposure, and
toxicological relevance. Arch Toxicol. 2010 Sep;84(9):663-79.
9. Jacques PF, Tucker KL. Are dietary patterns useful for understanding the role
of diet in chronic disease? Am J Clin Nutr. 2001 Jan;73(1):1-2.
10. Kant AK. Indexes of overall diet quality: a review. J Am Diet Assoc. 1996
Aug;96(8):785-91.
11. Hu FB. Dietary pattern analysis: a new direction in nutritional epidemiology.
Curr Opin Lipidol. 2002 Feb;13(1):3-9.
12. Wirfalt E, Drake I, Wallstrom P. What do review papers conclude about food
and dietary patterns? Food Nutr Res. 2013;57.
13. Nordic Nutrition Recommendations 2012: Integrating nutrition and physical
activity. Nordiska ministerrådet, Nordisk Ministerråds sekretariat. 2014.
14. Amcoff E, Edberg A, Enghardt Barbieri H, Lindroos AK, Nälsén C, Pearson
M, et al. Riksmaten 2010-11. Livsmedels och näringsintag bland vuxna i Sverige
(Riksmaten 2010-11. Intake of Food and Nutrients among Adults in Sweden) (in
Swedish). Uppsala, Sweden 2012.
15. Willett WC HG, Kushi LH. Adjustment for total energy intake in
epidemio-logic studies. . Am J Clin Nutr. 1997;65(4 Suppl):1220S-8S.
16. Huijbregts P, Feskens E, Rasanen L, Fidanza F, Nissinen A, Menotti A, et al.
Dietary pattern and 20 year mortality in elderly men in Finland, Italy, and The
Netherlands: longitudinal cohort study. BMJ. 1997 Jul 5;315(7099):13-7.
17. Sjogren P, Becker W, Warensjo E, Olsson E, Byberg L, Gustafsson IB, et al.
Mediterranean and carbohydrate-restricted diets and mortality among elderly men:
a cohort study in Sweden. Am J Clin Nutr. 2010 Oct;92(4):967-74.
18. Bjermo H, Darnerud PO, Lignell S, Pearson M, Rantakokko P, Nalsen C, et
al. Fish intake and breastfeeding time are associated with serum concentrations of
organochlorines in a Swedish population. Environ Int. 2013 Jan;51:88-96.
19. Bjermo H, Sand S, Nalsen C, Lundh T, Enghardt Barbieri H, Pearson M, et
al. Lead, mercury, and cadmium in blood and their relation to diet among Swedish
adults. Food Chem Toxicol. 2013 Jul;57:161-9.
20. Barany E, Bergdahl IA, Schutz A, Skerfving S, A. O. Inductively coupled
plasma mass spectrometry for direct multi-element analysis of diluted human
blood and serum. Journal of analytical atomic spectrometry. 1997;12:1005-9.
21. Sandborgh-Englund G, Elinder CG, Langworth S, Schutz A, Ekstrand J.
Mercury in biological fluids after amalgam removal. J Dent Res. 1998
Apr;77(4):615-24.
22. Lindh CH, Rylander L, Toft G, Axmon A, Rignell-Hydbom A, Giwercman
A, et al. Blood serum concentrations of perfluorinated compounds in men from
Greenlandic Inuit and European populations. Chemosphere. 2012
Sep;88(11):1269-75.
23. Bjermo H, Darnerud PO, Pearson M, Barbieri HE, Lindroos AK, Nalsen C, et al.
Serum concentrations of perfluorinated alkyl acids and their associations with diet and
personal characteristics among Swedish adults. Mol Nutr Food Res. 2013 Aug 12.
24. Lignell S, Aune M, Darnerud PO, Hanberg A, Larsson SC, Glynn A. Prenatal
exposure to polychlorinated biphenyls (PCBs) and polybrominated diphenyl
ethers (PBDEs) may influence birth weight among infants in a Swedish cohort
with background exposure: a cross-sectional study. Environ Health. 2013;12:44.
25. Mazzachi BC, Peake MJ, Ehrhardt V. Reference range and method
comparison studies for enzymatic and Jaffe creatinine assays in plasma and serum
and early morning urine. Clin Lab. 2000;46(1-2):53-5.
26. Bjermo H, Ax E, Cantillana T, Glynn G, Darnerud PO, Lindroos AK.
Environmental pollutants in blood and urine, and associations to reported food
intake in Riksmaten 2010-11. Uppsala, Sweden 2013.
27. Solfrizzo M, Gambacorta L, Visconti A. Assessment of multi-mycotoxin
exposure in southern Italy by urinary multi-biomarker determination. Toxins
(Basel). 2014 Feb;6(2):523-38.
28. Abramsson-Zetterberg L, Zetterberg G, Bergqvist M, Grawe J. Human
cytogenetic biomonitoring using flow-cytometric analysis of micronuclei in
transferrin-positive immature peripheral blood reticulocytes. Environ Mol
Mutagen. 2000;36(1):22-31.
29. Ferrari M, Mistura L, Patterson E, Sjostrom M, Diaz LE, Stehle P, et al.
Evaluation of iron status in European adolescents through biochemical iron
indicators: the HELENA Study. Eur J Clin Nutr. 2011 Mar;65(3):340-9.
30. Wallin S, Hardie LJ, Kotova N, Warensjö Lemming E, Nälsén C, Ridefelt P,
et al. Biomonitoring study of deoxynivalenol exposure and association with
typical cereal consumption in Swedish adults. World Mycotoxin Journal.
2013;6(4):439-48.
31. Abramsson-Zetterberg L, Durling LJ, Yang-Wallentin F, Rytter E, Vessby B.
The impact of folate status and folic acid supplementation on the micronucleus
frequency in human erythrocytes. Mutat Res. 2006 Jan 31;603(1):33-40.
Rapporter som utgivits 2014
1. Exponeringsuppskattningar av kemiska ämnen och mikrobiologiska agens - översikt samt rekommendationer om arbetsgång och strategi av S Sand, H Eneroth, B-G Ericsson och M Lindblad.
2. Fusariumsvampar och dess toxiner i svenskodlad vete och havre - rapport från kartläggningsstudie 2009-2011 av E Fredlund och M Lindblad.
3. Colorectal cancer-incidence in relation to consumption of red or precessed meat by PO Darnerud and N-G Ilbäck.
4. Kommunala myndigheters kontroll av dricksvattenanläggningar 2012 av C Svärd, C Forslund och M Eberhardson.
5. Kontroll av bekämpningsmedelsrester i livsmedel 2011 och 2012 av P Fohgelberg, A Jansson och H Omberg.
6. Vad är det som slängs vid utgånget hållbarhetsdatum? - en mikrobiologisk kartläggning av utvalda kylvaror av Å Rosengren.
7. Länsstyrelsernas rapportering av livsmedelskontrollen inom primärproduktionen 2012 av L Eskilson och S Sylvén.
8. Riksmaten - vuxna 2010-2011, Livsmedels- och näringsintag bland vuxna i Sverige av E Amcoff, A Edberg, H Enghart Barbieri, A K Lindroos, C Nälsén, M Pearson och E Warensjö Lemming.
9. Matfett och oljor - analys av fettsyror och vitaminer av V Öhrvik, R Grönholm, A Staffas och S Wretling. 10. Revision av Sveriges livsmedelskontroll 2013 - resultat av länsstyrelsernas och Livsmedelsverkets
revisioner av kontrollmyndighete av A Rydin, G Engström och Å Eneroth.
11. Kontrollprogrammet för tvåskaliga blötdjur − Årsrapport 2011-2013 − av M Persson, B Karlsson, SMHI, M Hellmér, A Johansson, I Nordlander och M Simonsson.
12. Riskkarakterisering av exponering för nitrosodimetylamin (NDMA) från kloramin använt vid dricks- vattenberedning av K Svensson.
13. Risk- och nyttovärdering av sänkt halt av nitrit och koksalt i charkuteriprodukter - i samband med sänkt temperatur i kylkedjan av P O Darnerud, H Eneroth, A Glynn, N-G Ilbäck, M Lindblad och L Merino. 14. Kommuners och Livsmedelsverkets rapportering av livsmedelskontrollen 2013 av L Eskilsson
och M Eberhardson.
15. Rapport från workshop 27-28 november 2013. Risk- och sårbarhetsanalys - från jord till bord. Samman- fattning av presentationer och diskussioner.
16. Risk- och nyttovärdering av nötter - sammanställning av hälsoeffekter av nötkonsumtion av J Bylund, H Eneroth, S Wallin och L Abramsson-Zetterberg.
17. Länsstyrelsernas rapportering av livsmedelskontrollen inom primärproduktionen 2013 av L Eskilson, S Sylvén och M Eberhardson.
18. Bly i viltkött - ammunitionsrester och kemisk analys, del 1 av B Kollander och B Sundström, Livsmedelsverket, F Widemo, Svenska Jägareförbundet och E Ågren, Statens veterinärmedicinska anstalt. Bly i viltkött - halter av bly i blod hos jägarfamiljer, del 2 av K Forsell, I Gyllenhammar, J Nilsson Sommar, N Lundberg-Hallén, T Lundh, N Kotova, I Bergdahl, B Järvholm och P O Darnerud.
Bly i viltkött - riskvärdering, del 3 av S Sand och P O Darnerud.
Bly i viltkött - riskhantering, del 4 av R Bjerselius, E Halldin Ankarberg och A Kautto.
19. Bra livsmedelsval baserat på nordiska näringsrekommendationer 2012 av H Eneroth, L Björck och Å Brugård Konde.
20. Konsumtion av rött kött och charkuteriprodukter och samband med tjock- och ändtarmscancer - risk och nyttohanteringsrapport av R Bjerselius, Å Brugård Konde och J Sanner Färnstrand. 21. Kontroll av restsubstanser i levande djur och animaliska livsmedel. Resultat 2013 av I Nordlander,
B Aspenström-Fagerlund, A Glynn, A Törnkvist, T Cantillana, K Neil Persson, Livsmedelsverket och K Girma, Jordbruksverket.
22. Kartläggning av shigatoxin-producerande E.coli (STEC) på nötkött och bladgrönsaker av M Egervärn och C Flink.
23. The Risk Thermometer - a tool for comparing risks associated with food consumption, draft report by S Sand, R Bjerselius, L Busk, H Eneroth, J Sanner Färnstrand and R Lindqvist.
24. A review of Risk and Benefit Assessment procedures - development of a procedure applicable for practical use at NFS by L Abramsson Zetterberg, C Andersson, W Becker, P O Darnerud, H Eneroth, A Glynn, R Lindqvist, S Sand and N-G Ilbäck.
25. Fisk och skaldjur, metaller i livsmedel - fyra dicenniers analyser av L Jorhem, C Åstrand, B Sundström, J Engman och B Kollander.
26. Bly och kadmium i vetetabilier odlade kring Rönnskärsverken, Skelleftehamn 2012 av J Engman, B Sundström och L Abramsson Zetterberg.
Rapporter som utgivits 2015
1. Spannmål, fröer och nötter -Metaller i livsmedel, fyra decenniers analyser av L Jorhem, C Åstrand, B Sundström, J Engman och B Kollander.
2. Konsumenters förståelse av livsmedelsinformation av J Grausne, C Gössner och H Enghardt Barbieri. 3. Slutrapport för regeringsuppdraget att inrätta ett nationellt kompetenscentrum för måltider i vård, skola
och omsorg av E Sundberg, L Forsman, K Lilja, A-K Quetel och I Stevén.
4. Kontroll av bekämpningsmedelsrester i livsmedel 2013 av A Jansson, P Fohgelberg och A Widenfalk. 5. Råd om bra matvanor - risk- och nyttohanteringsrapport av Å Brugård Konde, R Bjerselius, L Haglund,
A Jansson, M Pearson, J Sanner Färnstrand och A-K Johansson.
6. Närings- och hälsopåståenden i märkning av livsmedel - en undersökning av efterlevnaden av reglern av P Bergkvist, A Laser-Reuterswärd, A Göransdotter Nilsson och L Nyholm.
7. Serveras fet fisk från Östersjön på förskolor och skolor, som omfattas av dioxinundentaget av P Elvingsson.
8. The Risk Thermometer - A tool for risk comparison by S Sand, R Bjerselius, L Busk, H Eneroth, J Sanner Färnstrand and R Lindqvist.
9. Revision av Sveriges livsmedelskontroll 2014 - resultat av länsstyrelsernas och Livsmedelsverkets revisioner av kontrollmyndigheter av A Rydin, G Engström och Å Eneroth.
10. Kommuners och Livsmedelsverkets rapportering av livsmedelskontrollen 2014 av L Eskilsson och M Eberhardson.
11. Bra livsmedelsval för barn 2-17 år - baserat på nordiska näringsrekommendationer av H Eneroth och L Björck.
12. Kontroll av restsubstanser i levande djur och animaliska livsmedel. Resultat 2014 av I Nordlander, B Aspenström-Fagerlund, A Glynn, A Törnkvist, T Cantillana, K Neil Persson, Livsmedelsverket och K Girma, Jordbruksverket.
13. Biocidanvändning och antibiotikaresistens av J Bylund och J Ottosson.
14. Symtomprofiler ‒ ett verktyg för smittspårning vid magsjukeutbrott av J Bylund, J Toljander och M Simonsson.
15. Samordnade kontrollprojekt 2015. Dricksvatten - distributionsanläggningar av A Tollin.
16. Oorganisk arsenik i ris och risprodukter på den svenska marknaden 2015 - kartläggning, riskvärdering och hantering av B Kollander.
17. Undeclared milk, peanut, hazelnut or egg - guide on how to assess the risk of allergic reaction in the populationby Y Sjögren Bolin.
18. Kontroll av främmande ämnen i livsmedel 2012-2013 av P Fohgelberg och S Wretling.
19. Kontroll av bekämpningsmedelsrester i livsmedel 2014 av A Jansson, P Fohgelberg och A Widenfalk. 20. Drycker – analys av näringsämnen av V Öhrvik, J Engman, R Grönholm, A Staffas, H S Strandler
och A von Malmborg.
21. Barnens miljöhälsoenkät. Konsumtion av fisk bland barn i Sverige 2011 och förändringar sedan 2003 av A Glynn, Avdelningen för risk- och nyttovärdering, Livsmedelsverket och T Lind, Miljömedicinsk epidemiologi, Institutet för Miljömedicin, Karolinska institutet, Stockholm.
22. Associations between food intake and biomarkers of contaminants in adults by E Ax, E Warensjö Lemming, L Abramsson-Zetterberg, P O Darnerud and N Kotova.