LIVSMEDELS
Rapport 8 - 2012
by Laurence Nachin, Christina Normark, Irina Boriak and Ingela Tillander
Proficiency testing
Food Microbiology
− April 2012
No
. of r
esults
Proficiency Testing
Microbiology – Food
April 2012
Laurence Nachin, Christina Normark, Irina Boriak and Ingela Tillander
Microbiology Division
National Food Agency
Box 622
SE-751 26 UPPSALA
SWEDEN
Uppsala 2012
Edition
Version 1 (2012-06-18)
Editor in chief
Annika Rimland, Head of Science Department, National Food Agency
Responsible for the scheme
Christina Normark, Microbiologist, Microbiology Division, National Food
Agency
Contents
Abbreviations ... 3
Introduction ... 5
- Benefits of the National Food Agency’s proficiency tests ... 5
Design and analyses ... 5
- Analyses performed ... 5
- Test material ... 6
- Quality control of the mixtures ... 7
Laboratory results ... 8
- General information regarding the results ... 8
- Description of mixture A ... 12
- Description of mixture B ... 15
- Description of mixture C
Outcome of the methods ... 18
- General comments ... 18
- Analysis of aerobic microorganisms ... 18
General outcome of the results – assessment ... 21
- Box plot ... 22
References ... 27
Appendix 1: Results obtained by the participants
Abbreviations
Media
DG 18
Dichloran Glycerol agar
DRBC
Dichloran Rose-Bengal Chloramphenicol agar
MPCA
Milk Plate Count Agar
MRS
de Man-Rogosa-Sharpe agar
MRS-aB
de Man-Rogosa-Sharpe agar with amphotericin
PCA
Plate Count Agar
TSA
Trypticase Soy Agar
TGE
Tryptone Glucose Extract agar
Organisations
IDF
International Dairy Federation
ISO
International Organization for Standardization
NMKL
Nordic Committee for Food Analyses
Introduction
All analytical activities require the execution of work of a high standard that is
accurately documented. For this purpose most laboratories carry out some form of
internal quality assurance, but their analytical work also has to be evaluated by an
independent party. Such external quality control of laboratory competence is
commonly required by accreditation bodies and can be done by taking part in
proficiency testing (PT).
In a proficiency test, identical test material is examined by a number of
laboratories. The laboratories must follow instructions, perform analyses on the
samples provided and report their results to the organiser. They are also expected
to use their routine methods to analyse the samples provided. The organiser
subsequently evaluates the results using statistical tools and finally compiles them
in a report.
Benefits of the National Food Agency’s proficiency tests
1. Laboratories are externally evaluated with respect to their analytical
competence, including usage of methods, documentation and orderliness.
2. Accreditation bodies are provided with a tool for inspections regarding new
accreditation or maintenance of accreditation.
3. Laboratories and the organiser improve their knowledge of the efficiency of
analytical methods used routinely by participating laboratories with respect to
various types of organisms.
Design and analyses
The proficiency testing reported in this document was performed during April
2012 and is registered as no. 867/2012 at the National Food Agency, Uppsala.
Quantitative analyses performed
Aerobic microorganisms, 30 ºC
Enterobacteriaceae
Escherichia coli
Presumptive Bacillus cereus
Coagulase-positive staphylococci
Lactic acid bacteria
Clostridium perfringens
Anaerobic sulphite-reducing bacteria
Aerobic microorganisms in fish products, 20-25 °C
Hydrogen sulphide-producing bacteria in fish products
Yeasts
Test material
Each laboratory received three freeze-dried microbial mixtures designated A-C.
The manufactured test material was freeze-dried in portions of 0.5 ml in
vials, as described by Peterz and Steneryd (1). Each laboratory received one vial
of each mixture. Before analysing the samples, the contents of each vial had to be
dissolved in 254 ml of diluent. The organisms present in the mixtures are listed in
Table 1.
Table 1. Microorganisms present in mixture A-C supplied to test laboratories
Mixture
1
Microorganism
Strain no.
A
Pseudomonas aeruginosa
SLV-395
Escherichia coli
SLV-085
Bacillus weihenstephanensis
SLV-563
Lactobacillus plantarum
SLV- 475
Clostridium perfringens
SLV-442
Candida glabrata
SLV-052
B
Brochotrix thermosphacta
SLV-220
Enterococcus hirae
SLV-536
Shewanella putrefaciens
SLV-520
Hanseniaspora uvarum
SLV-555
C
Escherichia coli
SLV-477
Serratia marcesens
SLV-040
Staphylococcus aureus
SLV-185
Aspergillus flavus
SLV-480
Penicillium roqueforti
SLV-510
1
Quality control of the mixtures
It is essential to have a homogeneous mixture and a uniform volume in all vials in
order to allow comparison of all freeze-dried samples derived from one mixture.
Quality control was performed in conjunction with manufacture of the mixtures
according to Scheme Protocol (2). The results are presented in Table 2.
The standard deviations for the mixtures analysed ranged from 0.03 to 0.13
log
10
units. Homogeneity requires that the standard deviation and the difference
between the highest and lowest value of results from 10 samples analysed do not
exceed 0.15 log
10
units and 0.5 log
10
units, respectively.
Table 2. Concentration mean (m) and standard deviation (s) from analyses of 10
randomly selected vials per mixture, expressed in log
10
cfu (colony forming units)
per ml of sample.
Analysis and method
A
B
C
m
s
m
s
m
s
Aerobic microorganisms, 30 ºC
NMKL method no. 86
4.5
0.05
4.4
0.06
5.2
0.04
Enterobacteriaceae
NMKL method no. 144
3.8
0.03
–
–
4.7
0.05
Escherichia coli
NMKL method no. 125
3.9
0.05
–
–
4.3
0.05
Presumptive Bacillus cereus
NMKL method no. 67
3.3
0.05
–
–
–
–
Coagulase-positive staphylococci
NMKL method no. 66
–
–
–
–
5.0
0.05
Lactic acid bacteria
NMKL method no. 140
3.9
0.04
4.3
0.04
–
–
Clostridium perfringens
NMKL method no. 95
3.1
0.04
–
–
–
–
Anaerobic sulphite-reducing bacteria
NMKL method no. 56
3.5
0.09
–
–
–
–
Aerobic microorganisms in fish products
NMKL method no. 184, JA
4.5
0.10
4.6
0.12
5.3
0.04
H
2S-producing bacteria in fish products
NMKL method no 184, JA
–
–
4.2
0.13
Yeasts
NMKL method no. 98, DRBC
3.6
0.04
3.6
0.06
–
–
Moulds
NMKL method no. 98, DRBC
–
–
–
–
4.1
0.10
– = No target organism
Laboratory results
General information regarding the results
Samples were sent to 187 laboratories, 44 of which were in Sweden, 128 in other
European countries and 15 outside Europe.
For the 184 laboratories that reported results, 97 laboratories (53%) provided
at least one analytical result that received an annotation. In the previous round
(April 2011), which comprised similar analyses, the proportion was 58%. In
general, rounds including analyses of yeasts and moulds cause more results with
annotation than other rounds.
Highly deviating values that did not belong to a strictly normal distribution
were identified as statistical outliers and are illustrated by black bars in the
histograms. They appeared in most analyses. The statistical tool Grubbs’ test as
modified by Kelly (3) was used to identify outliers. The method is objective in
theory, but in order to obtain correct outliers the results have to be normally
distributed. In some cases, subjective adjustments were made to set the right
limits, based on knowledge of the mixture’s contents. The number of false results
and outliers obtained by each laboratory are presented below the box plots (Figure
5). False results and outliers were not included in the calculations of means and
standard deviations. Results reported as “>value” could not be evaluated
statistically and were hence excluded from the evaluation. Results reported as
“<value” were interpreted as being zero (negative result). All reported results are
presented in Appendix 1.
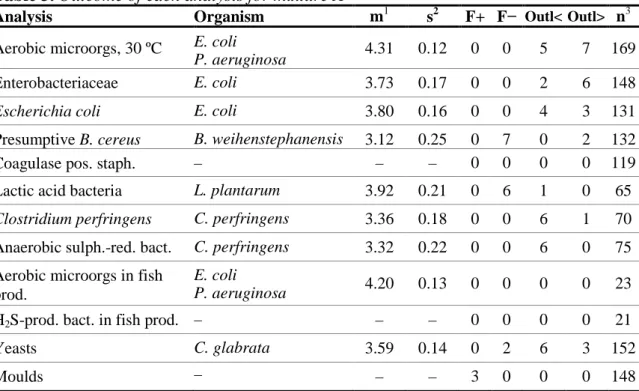
Description of mixture A
Mixture A contained Escherichia coli, Pseudomonas aeruginosa, Bacillus
weihenstephanensis, Lactobacillus plantarum, Clostridium perfringens and
Candida glabrata.
The results obtained did not reveal any major difficulties in the analyses of
this mixture. For each analysis, the results are quite well distributed, with a small
dispersion (Table 3 and Figure 1).
Analysis of Enterobacteriaceae and E. coli
Escherichia coli was the target organism for both the analysis of
Enterobacteriaceae and of E. coli. Hence, the majority of the laboratories reported
similar results for these analyses. However, mixture A also contained
Pseudomonas aeruginosa, which is a gram-negative but oxidase-positive bacteria
and therefore does not belong to the Enterobacteriaceae. Its presence in the
mixture could explain the high outlier results for analysis of Enterobacteriaceae
obtained by some laboratories.
Analysis of presumptive B. cereus
Although mixture A did not contain a strain of B. cereus, a positive result is
correct for the analysis of presumptive B. cereus. The mixture contained B.
weihenstephanensis, which is not distinguished from B. cereus (or B.
thuringensis) by methods ISO 7932 and NMKL 67. All three species give a
haemolytic zone on blood agar and a lecitinase reaction on egg yolk medium.
More, none of these species produces acid from mannitol.
Analysis of C. perfringens and anaerobic sulphite-reducing bacteria
There is a good correlation between the results of these two analyses, as C.
perfringens was the microorganism detected in both cases. Low outlier results
were obtained for both analyses, by the same laboratories (3 cases) or by
laboratories that performed only one analysis. Examination of the method and/or
medium employed for these analyses did not reveal any obvious cause for these
low values.
Table 3. Outcome of each analysis for mixture A
Analysis
Organism
m
1s
2F+ F−
Outl< Outl>
n
3Aerobic microorgs, 30 ºC
E. coli
P. aeruginosa
4.31
0.12
0
0
5
7
169
Enterobacteriaceae
E. coli
3.73
0.17
0
0
2
6
148
Escherichia coli
E. coli
3.80
0.16
0
0
4
3
131
Presumptive B. cereus
B. weihenstephanensis
3.12
0.25
0
7
0
2
132
Coagulase pos. staph.
–
–
–
0
0
0
0
119
Lactic acid bacteria
L. plantarum
3.92
0.21
0
6
1
0
65
Clostridium perfringens
C. perfringens
3.36
0.18
0
0
6
1
70
Anaerobic sulph.-red. bact.
C. perfringens
3.32
0.22
0
0
6
0
75
Aerobic microorgs in fish
prod.
E. coli
P. aeruginosa
4.20
0.13
0
0
0
0
23
H
2S-prod. bact. in fish prod. –
–
–
0
0
0
0
21
Yeasts
C. glabrata
3.59
0.14
0
2
6
3
152
Moulds
–
–
–
3
0
0
0
148
1
Mean value of all laboratory results expressed in log
10cfu/ml (Appendix 1)
2
Standard deviation of all laboratory results (Appendix 1)
F+ and F- = numbers of false positive and false negative results, respectively.
Outl < and Outl> = number of low and high outliers, respectively.
3
Number of analyses performed
– = No target organism
0 20 40 60 80 2 2,5 3 3,5 4 4,5 5 5,5 6 log 10 CFU per ml 4,3 ↓
Aerobic microorganisms 30 °C
N o o f r e s u lt s 0 10 20 30 40 50 1 1,5 2 2,5 3 3,5 4 4,5 5 log 10 CFU per ml 3,1 ↓Presumptive B. cereus
N o o f r e s u lt s 0 5 10 15 20 25 2 2,5 3 3,5 4 4,5 5 log 10 CFU per ml 3,9 ↓Lactic acid bacteria
N o o f r e s u lt s 0 15 30 45 60 2 2,5 3 3,5 4 4,5 5 5,5 6 log 10 CFU per ml 3,7 ↓
Enterobacteriaceae
N o o f r e s u lt s 0 15 30 45 60 2 2,5 3 3,5 4 4,5 5 5,5 6 log 10 CFU per ml 3,8 ↓E. coli
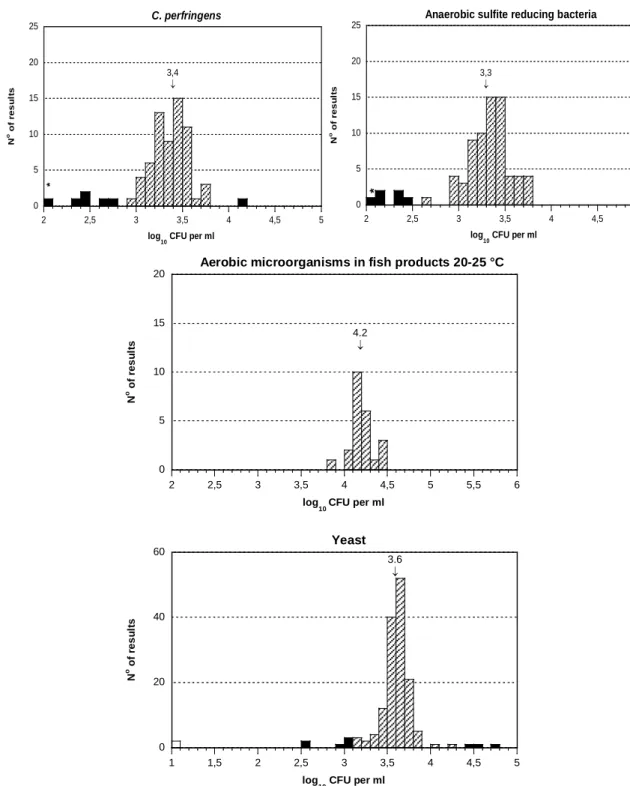
* N o o f r e s u lt sFigure 1. Histograms of all analytical results obtained for the mixture A.
values within the interval of acceptance (Appendix 1), outliers, false negative
results, * outliers outside of the x-axis scale. The mean value of the analysis results is
indicated in the histograms.
0 5 10 15 20 25 2 2,5 3 3,5 4 4,5 5 log 10 CFU per ml 3,3 ↓
Anaerobic sulfite reducing bacteria
*
N o o f r e s u lt s 0 5 10 15 20 25 2 2,5 3 3,5 4 4,5 5 log 10 CFU per ml * 3,4 ↓C. perfringens
N o o f r e s u lt s 0 5 10 15 20 2 2,5 3 3,5 4 4,5 5 5,5 6 N o o f r e s u lt s log 10 CFU per ml 4.2 ↓Aerobic microorganisms in fish products 20-25 °C
0 20 40 60 1 1,5 2 2,5 3 3,5 4 4,5 5 log 10 CFU per ml 3.6 ↓
Yeast
N o o f r e s u lt sDescription of mixture B
Mixture B contained Brochotrix thermosphacta, Shewanella putrefaciens,
Enterococcus hirae and Hanseniaspora uvarum.
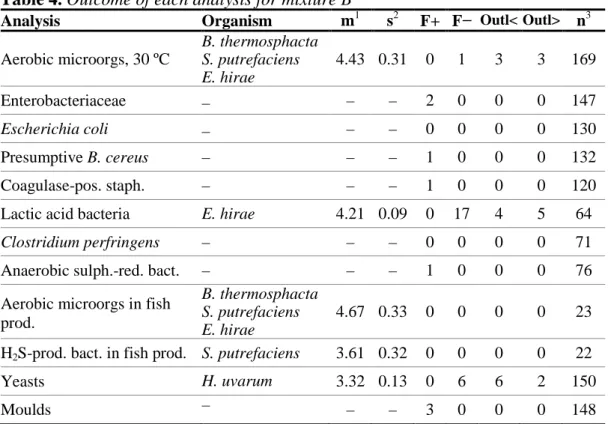
Table 4. Outcome of each analysis for mixture B
Analysis
Organism
m
1s
2F+ F−
Outl< Outl>
n
3Aerobic microorgs, 30 ºC
B. thermosphacta
S. putrefaciens
E. hirae
4.43 0.31 0
1
3
3
169
Enterobacteriaceae
–
–
–
2
0
0
0
147
Escherichia coli
–
–
–
0
0
0
0
130
Presumptive B. cereus
–
–
–
1
0
0
0
132
Coagulase-pos. staph.
–
–
–
1
0
0
0
120
Lactic acid bacteria
E. hirae
4.21 0.09 0
17
4
5
64
Clostridium perfringens
–
–
–
0
0
0
0
71
Anaerobic sulph.-red. bact.
–
–
–
1
0
0
0
76
Aerobic microorgs in fish
prod.
B. thermosphacta
S. putrefaciens
E. hirae
4.67 0.33 0
0
0
0
23
H
2S-prod. bact. in fish prod. S. putrefaciens
3.61 0.32 0
0
0
0
22
Yeasts
H. uvarum
3.32 0.13 0
6
6
2
150
Moulds
–
–
–
3
0
0
0
148
1
Mean value of all laboratory results expressed in log
10cfu/ml (Appendix 1)
2
Standard deviation of all laboratory results (Appendix 1)
F+ and F- = numbers of false positive and false negative results, respectively.
Outl < and Outl> = number of low and high outliers, respectively.
3
Number of analyses performed
– = No target organism
Analysis of aerobic microorganisms
The histogram presenting the results obtained for the analysis of aerobic
microorganisms at 30
º
C revealed a major peak centred around the overall mean
value of 4.4, but also a minor peak around 5.0 (Figure 2). Moreover, the results
obtained for the analysis of aerobic microorganisms in fish products at 20-25
º
C
showed a higher mean value of 4.7, even though theoretically the same
microorganism should be detected in the two analyses. However, mixture B
contained B. thermosphacta, which grows better at 20-25
º
C than at 30
º
C.
Brochotrix thermosphacta was present at the highest concentration in the mixture
and we therefore believe it is this strain that caused the tails of higher values seen
high values and the method used is discussed later in this report, in the section
“Outcome of the method”.
Analysis of lactic acid bacteria
One in four of the laboratories that performed this analysis did not detect any
lactic acid bacteria in mixture B, even though it contained Enterococcus hirae.
According to NMKL method 140, Carnobacterium, Lactobacillus, Lactococcus,
Leuconostoc, Pediococcus and Weisella are the most common lactic acid bacteria
of food spoilage-associated genera, but this group also includes Enterococcus.
The laboratories that reported negative results for the analysis probably did not
interpret Enterococcus as being lactic acid bacteria.
Analysis of H
2
S-producing bacteria in fish products
Only 22 laboratories performed this analysis. The standard deviation of the results
is similar for the analysis of aerobic microorganisms at 30
º
C and aerobic
microorganisms in fish products at 20-25
º
C. In this analysis, the microorganism
detected was S. putrefaciens, which forms black colonies on iron agar. However,
the high concentration of the background flora (10-fold) could impede accurate
reading of the plates. More, colonies can bleach if the plates are not overlaid or
are incubated at too high a temperature. The pH of the medium is also important,
as the iron sulphide produced by S. putrefaciens from cysteine is acid-labile.
Figure 2. Histograms of all analytical results obtained for mixture B.
For details, see legend to Figure 1.
0 20 40 60 80 2 2,5 3 3,5 4 4,5 5 5,5 6 log 10 CFU per ml 4,4 ↓
Aerobic microorganisms 30 °C
*
N o o f res u lt s 0 5 10 15 20 25 2 2,5 3 3,5 4 4,5 5 5,5 6 log 10 CFU per ml 4,2 ↓Lactic acid bacteria
N o o f res u lt s 0 5 10 2 2,5 3 3,5 4 4,5 5 5,5 6 N o o f res u lt s
log10 CFU per ml
4.7 ↓
Aerobic microorganisms in fish products 20-25 °C
0 5 10 2 2,5 3 3,5 4 4,5 5 5,5 6 log 10 CFU per ml 3.6 ↓ H
2S producing bacteria in fish products
N o o f res u lt s 0 20 40 60 1 1,5 2 2,5 3 3,5 4 4,5 5 3.3 ↓
Yeast
log 10 CFU per ml N o o f re s u lt sDescription of mixture C
Mixture C contained Escherichia coli, Serratia marcesens, Staphylococcus
aureus, Aspergillus flavus and Penicillium roqueforti.
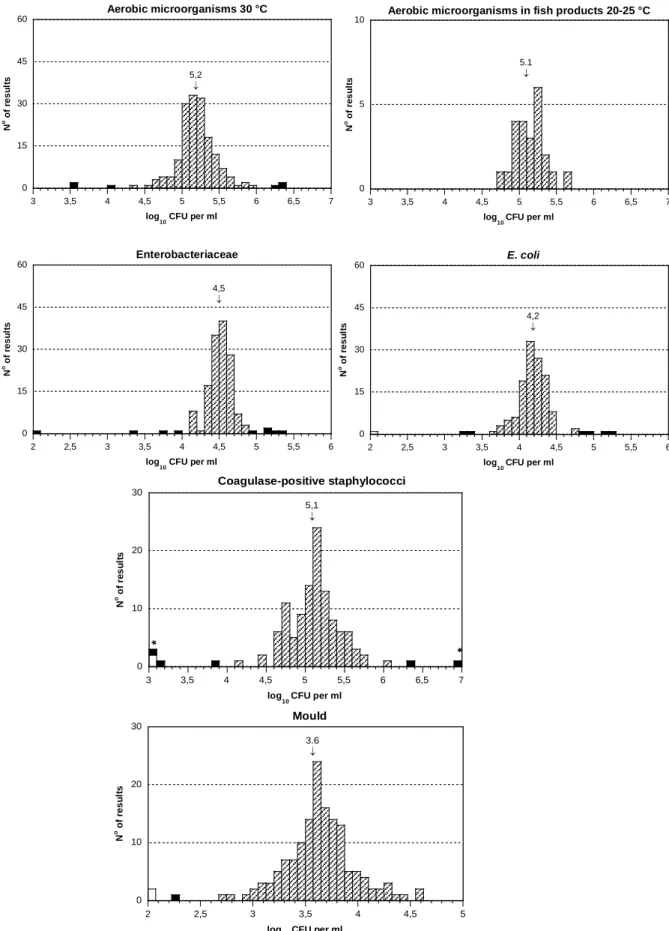
Table 5. Outcome of each analysis for mixture C
Analysis
Organism
m
1s
2F+
F−
Outl< Outl>
n
3Aerobic microorgs, 30 ºC
E. coli
S. marcesens
S. aureus
5.18 0.24
0
0
3
3
169
Enterobacteriaceae
E. coli
S. marcesens
4.50 0.14
0
0
4
5
148
Escherichia coli
E. coli
4.17 0.17
0
1
2
4
132
Presumptive B. cereus
–
–
–
10
0
0
0
131
Coagulase-pos. staph.
S. aureus
5.10 0.31
0
2
3
2
118
Lactic acid bacteria
–
–
–
16
0
0
0
63
Clostridium perfringens
–
–
–
0
0
0
0
71
Anaerobic sulph.-red. bact.
–
–
–
0
0
0
0
76
Aerobic microorgs in fish
prod.
E. coli
S. marcesens
S. aureus
5.14 0.19
0
0
0
0
23
H
2S-prod. bact. in fish prod. –
–
–
0
0
0
0
21
Yeasts
–
–
–
20
0
0
0
150
Moulds
A. flavus
P. roqueforti
3.64 0.32
0
2
1
0
149
1Mean value of all laboratory results expressed in log
10cfu/ml (Appendix 1)
2
Standard deviation of all laboratory results (Appendix 1)
F+ and F- = numbers of false positive and false negative results, respectively.
Outl < and Outl> = number of low and high outliers, respectively.
3
Number of analyses performed
– = No target organism
Analysis of presumptive B. cereus
Ten laboratories reported the presence of presumptive B. cereus in mixture C,
although it did not contain any, but rather a strain of S. marcesens. This bacterium
could be misinterpreted, as it gives a positive lecitinase reaction on egg yolk
medium. However on blood agar, S. marcesens forms atypical colonies without a
haemolytic zone, which rules out the possibility of it being presumptive B. cereus.
Analysis of coagulase-positive staphylococci
The results obtained are widely spread, with log
10
cfu values from 4.1 till 6.1. This
two groups of results, at around 4.7 and 5.1 (Figure 3). However, investigation of
the methods reported did not allow conclusions to be drawn on any correlation
between the results obtained and the method and/or medium employed for this
analysis.
Analysis of lactic acid bacteria
Surprisingly, 25% of the reported results indicated the presence of lactic acid
bacteria. At the National Food Agency, none of the strains included in mixture C
grew on MRS-aB medium, but both strains of E. coli and S. aureus formed
colonies on MRS medium. The reference methods NMKL 140:2007 and ISO
15214:1998 indicate the use of MRS-aB and MRS, respectively.
Analysis of moulds
Mixture C contained A. flavus and P. roqueforti. The A. flavus concentration was
10-fold higher than the P. roqueforti concentration. On DG 18 and DRBC, A.
flavus forms large green colonies, while colonies of P. roqueforti are lighter in
colour, with a blue-green centre. The difficulty in reading plates containing these
two moulds can partly explain the large dispersion in the results reported. Indeed,
it could be difficult to count single colonies of A. flavus if the concentration on the
plate is too high. More, because of the large size of its colonies, this mould can
hide colonies of P. roqueforti. It should be therefore easier to count single
colonies of P. roqueforti by looking at plates from underneath.
Finally, when analysing moulds, plates should be incubated in an upright
position and should not be touched until reading to avoid spores disseminating
and generating “new” colonies.
Analysis of yeasts
The mixture did not contain any yeast. Nevertheless, many laboratories reported
the presence of yeast in the mixture.
At the National Food Agency, none of the bacteria present in the mixture
grew on DG 18 or DRBC agar. More, the appearance of the two mould strains, A.
flavus and P. roqueforti, on these media was unambiguous (see above). A less
selective medium such as Sabouraud or malt extract agar could potentially support
the growth of bacteria, which could be misinterpreted as yeast. However, the
majority of the laboratories that reported false positive results actually used
selective medium for their analyses. Another hypothesis to explain false positive
results is the interpretation of P. roqueforti colonies as yeast colonies when
reading the plate from underneath (see above).
Figure 3. Histograms of all analytical results obtained for mixture C.
For details, see legend to Figure 1.
0 15 30 45 60 3 3,5 4 4,5 5 5,5 6 6,5 7 log 10 CFU per ml
Aerobic microorganisms 30 °C
5,2 ↓ N o o f re s u lt s 0 5 10 3 3,5 4 4,5 5 5,5 6 6,5 7 N o o f res u lt slog10 CFU per ml
5.1 ↓
Aerobic microorganisms in fish products 20-25 °C
0 15 30 45 60 2 2,5 3 3,5 4 4,5 5 5,5 6 log 10 CFU per ml 4,5 ↓
Enterobacteriaceae
N o o f re s u lt s 0 15 30 45 60 2 2,5 3 3,5 4 4,5 5 5,5 6 log 10 CFU per ml 4,2 ↓E. coli
N o o f r e s u lt s 0 10 20 30 3 3,5 4 4,5 5 5,5 6 6,5 7 log 10 CFU per ml 5,1 ↓Coagulase-positive staphylococci
*
*
N o o f res u lt s 0 10 20 30 2 2,5 3 3,5 4 4,5 5 3.6 ↓Mould
log 10 CFU per ml N o o f r e s u lt sOutcome of the methods
General comments
According to EN ISO/IEC 17043, for which the proficiency testing programme
organised by the National Food Agency is accredited since early 2012, it is
mandatory for the participating laboratories to give method information for all
analyses for which they report results. However, the method information is
sometimes difficult to interpret, e.g. many laboratories choose a medium that
differs from that in the reported standard methods (Table 6).
Table 6. Distribution of the methods used by the laboratories for each analysis.
Analysis
n
1NMKL ISO/IDF Petrifilm
TMOther Several
Aerobic microorgs, 30 ºC
169
63
53
25
25
2
Enterobacteriaceae
148
82
29
20
13
4
Escherichia coli
132
44
27
42
19
0
Presumptive B. cereus
132
85
24
0
22
1
Coagulase-pos. staph.
120
60
33
13
12
2
Lactic acid bacteria
65
41
9
0
15
0
Clostridium perfringens
71
48
18
0
5
0
Anaerobic sulph.-red. bact.
76
49
16
0
11
0
Aerobic microorgs in fish
prod.
23
23
0
0
0
0
H
2S-prod. bact. in fish prod.
22
22
0
0
0
0
Yeast
152
60
58
10
24
0
Mould
150
58
58
8
26
0
1
Number of laboratories that supplied method information for the respective analyses
In the following, we focus on the analysis of total aerobic microorganisms at 30
º
C.
Analysis of aerobic microorganisms
Most of the participating laboratories (69%) used either the NMKL or ISO/IDF
method for their analyses, but a substantial amount (15%) routinely used the
Petrifilm
TMmethod (Table 6). Looking at the results obtained with these three
different methods, no obvious difference could be seen regarding mixtures A and
C. However, the cfu counts for mixture B were significantly higher when the
analytical method chosen was Petrifilm
TM(Figure 4 and Table 7). This difference
is clearly visible on the histogram of mixture B results, where 20 of the 23 results
reported were above 4.5 log
10
cfu ml
-1
(Figure 4).
The organism present at the highest concentration in mixture B was B.
thermosphacta, which is the bacteria mainly detected in analysis of aerobic
microorganisms in fish products at 20-25
º
C (Figure 2). In view of the results, it
seems that these bacteria also appear more at 30
º
C when the Petrifilm
TMmethod is
used. It is known that some strains exhibit different behaviour and growth rate
depending on the method and/or substrate used for their detection. It is possible
that B. thermosphacta cells grow better on Petrifilm
TMthan on traditional plates, or
that they generally form small colonies at 30
º
C but the presence of tetrazolium in
the Petrifilm
TMfacilitates their enumeration. In either case this is a good
illustration of the variability in enumeration that can occur depending on method
and/or substrate used for a specific analysis.
Table 7. Analytical results of aerobic microorganisms at 30
o
C for mixture
A-C according to the method and the medium employed
Mixture
A
B
C
n
1m
2s
3N
1m
2s
3N
1m
2s
3Met
h
od
Petrifilm
TM22
4.31
0.14
23
4.84
0.25
23
5.22
0.22
NMKL
59
4.32
0.29
62
4.33
0.26
62
5.17
0.31
ISO/IDF
49
4.31
0.09
53
4.33
0.28
51
5.16
0.29
Med
iu
m
PCA
105
4.32
0.12
108
4.33
0.23
110
5.17
0.24
Petrifilm
TM21
4.32
0.12
22
4.82
0.24
22
5.21
0.22
MPCA
13
4.31
0.11
13
4.38
0.27
12
5.18
0.16
TSA
9
4.25
0.16
9
4.52
0.31
9
5.24
0.21
TGE
3
4.23
-
3
4.22
-
3
5.11
-
TEMPO
®3
4.41
-
3
4.45
-
3
5.24
-
1Number of laboratories that supplied method information
2
Mean value expressed in log
10cfu/ml
3
Figure 4. Analytical results of aerobic microorganisms at 30
o
C for mixture A-C
according to the method employed: NMKL, ISO/IDF, Petrifilm
TM.*:value>6
0 10 20 30 40 50 3 3,5 4 4,5 5 5,5 6 N o o f r e s u lts log 10 CFU per ml Mixture A 0 10 20 30 40 50 3 3,5 4 4,5 5 5,5 6 log 10 CFU per ml N o of r e s ul ts Mixture B
*
0 10 20 30 40 50 3 3,5 4 4,5 5 5,5 6 log 10 CFU per ml Mixture C N o of r e s ul tsGeneral outcome of the results - assessment
In order to allow comparison of the results from different analyses and mixtures,
all the results from quantitative analyses were transformed into standard values
(z-scores). A z-score is either positive or negative, depending on whether the
individual result is higher or lower than the mean value calculated from all
laboratory results for each analysis. The z-scores obtained, which are listed in
Appendix 2, can be used as a tool by laboratories when following up on the
results.
All the results from each laboratory – outliers included and false results
excluded – were compiled into a box plot (Figure 5) based on their z-scores. The
smaller and more centred round zero the box of a laboratory is, the closer its
results are to the general mean values calculated for all laboratory results.
The laboratories were not grouped or ranked based on their results. However,
for each laboratory, the number of false results and outliers is presented below the
box plots. These results are also highlighted in Appendix 1, where all the reported
results are listed, and the minimum and maximum accepted values for each
analysis are stated.
Information on the results processing and recommendations for follow-up work
are given in the Scheme Protocol (2). Samples for follow-up can be ordered, free
of charge, by e-mailing PT-micro@slv.se.
Figure 5. Box plots and number of deviating results for each laboratory.
- The plots are based on the laboratory results from all analyses transformed
into z-scores calculated according to the formula: z = (x-m)/s, where x is the
result of the individual laboratory, m is the mean of the results of all
participating laboratories, and s is the standard deviation.
- The laboratory median value is illustrated by a horizontal red line in the box.
- The box includes 50% of a laboratory’s results (25% of the results above the
median and 25% of the results below the median). The remaining 50% are
illustrated by lines and circles outside the box.
- Very deviating results are represented by circles and are calculated as follow:
the lowest result in the box − 1.5 × (the highest result in the box − the lowest
result in the box) or the highest result in the box + 1.5 × (the highest result in
the box
− the lowest result in the box). z-scores greater than +4 and less than
−4 are positioned at +4 and −4, respectively, in the plot.
- The background is divided by lines and shaded fields to indicate ranges in
order to simplify location of laboratory results.
z-scor
e
Lab no
1081
1149
1254
1290
1594
1970
2035
2058
2072
2086
2324
2344
2386
2402
2459
2553
2637
2720
2745
2764
No. of results 27 21 18 21 27 34 18 21 23 - 18 26 15 18 9 18 30 15 18 23 False positive - - - 1 - - 1 - - 1 - - - -False negative - - - 1 - - - 1 Low outliers 2 - - - 2 - 1 - 1 1 1 1 - 2 - -High outliers - - - 1 - - - 4 - - - --
z-scor
e
Lab no
2842
2920
3055
3225
3243
3305
3346
3457
3511
3543
3587
3588
3626
3803
3831
4047
4050
4064
4153
4171
No. of results 30 12 14 15 6 33 30 26 20 21 22 26 18 33 8 20 18 9 33 21 False positive - - 1 - - 1 - - - 3 1 - - - -False negative - - - 2 - 1 1 - 1 1 - - 4 - - - - 2 Low outliers 4 - - - 1 1 - - - -High outliers - - - 1 - - - ---4
-2
0
2
4
-4
-2
0
2
4
z-scor
e
Lab no
4246
4278
4288
4305
4339
4352
4353
4356
4400
4562
4633
4635
4658
4689
4713
4817
4840
4889
4951
4955
No. of results 6 15 27 18 36 18 15 23 15 27 26 24 12 6 32 23 23 29 15 30 False positive - - - 2 - - - 1 - - 1 - - - 1 - - -False negative - - - 1 - - - 1 1 - 1 - -Low outliers - 7 - - - 1 - - 1 - - - 1 -High outliers - - 9 - - - 1 - - - 1 - --
z-scor
e
Lab no
4980
5018
5100
5119
5162
5197
5201
5204
5220
5250
5304
5329
5333
5338
5350
5380
5545
5553
5615
5647
No. of results 21 30 8 6 12 18 21 23 15 8 15 20 15 9 18 17 19 15 26 24 False positive - - - 1 - 2 - - 3 - - - 2 - 1 -False negative - - - 3 - - - 1 - - - -Low outliers - - - 1 - 3 - 1 - - 1 High outliers - 1 1 - 1 - - - - 1 - - ---4
-2
0
2
4
-4
-2
0
2
4
z-scor
e
Lab no
5701
5764
5774
5801
5883
5893
5993
6052
6109
6138
6175
6220
6224
6232
6253
6343
6352
6368
6456
6490
No. of results - 6 12 15 24 18 3 20 20 24 6 6 9 6 24 27 27 33 27 21 False positive - - - 1 - - - -False negative - - - 1 - - - -Low outliers - - - 2 - 1 - - - 1 - - - -High outliers - - - 1 1 - - --
z-scor
e
Lab no
6594
6628
6658
6707
6720
6762
6852
6944
6958
6971
6992
7024
7096
7182
7207
7232
7242
7248
7253
7334
No. of results 20 9 9 32 27 9 15 24 15 7 24 14 15 16 14 8 20 29 15 17 False positive 1 - - - 1 - - 2 - 1 - 1 - 1 1 1 - 1 False negative - - - 1 - - - 1 1 - - - - -Low outliers - - - 1 1 - - 5 - - - 1 High outliers - - 1 - - ---4
-2
0
2
4
-4
-2
0
2
4
z-scor
e
Lab no
7438
7449
7533
7543
7564
7596
7627
7688
7728
7825
7876
7906
7930
7940
7946
7962
8066
8068
8105
8255
No. of results 26 11 15 - 35 24 14 27 23 18 24 24 27 3 22 21 17 30 14 29 False positive 1 1 - - 1 - - - 1 - - - 1 - - -False negative - - - 1 - - - 2 - - - - 1 Low outliers 1 - - - 1 1 - - -High outliers - - - - 1 - - - 1 - - 6 - 1 1 --
z-scor
e
Lab no
8260
8313
8333
8352
8380
8397
8428
8435
8523
8529
8568
8626
8628
8657
8676
8734
8742
8756
8766
8891
No. of results 27 24 23 26 29 33 29 24 8 29 23 12 33 12 14 14 30 18 24 21 False positive - - - 2 - - - 1 1 3 3 - -False negative - - 1 1 1 - 1 - 2 1 1 - - - -Low outliers - 1 - 1 - - - 2 - 1 -High outliers - - - 2 - - - 1 2 - - 1 - - - 4 ---4
-2
0
2
4
-4
-2
0
2
4
z-scor
e
Lab no
8909
8918
9002
9034
9217
9245
9359
9408
9420
9429
9436
9441
9451
9453
9465
9512
9555
9559
9569
9747
No. of results 20 27 26 11 15 18 27 9 12 27 29 35 24 18 15 14 24 26 30 10 False positive 1 - 1 - - - 1 1 - 1 - 1 - 1 - -False negative - - - 1 - - - 2 - - - 2 Low outliers - - - 2 - - - 1 - -High outliers - - 1 - - - 1 - -Falsknegativa ?z-scor
e
Lab no
9763
9783
9886
9890
9903
9923
9950
No. of results 24 3 29 21 24 23 15 False positive - - - 1 -False negative - - 1 - - - -Low outliers - - - -High outliers - - ---4
-2
0
2
4
-4
-2
0
2
4
References
1. Peterz. M. Steneryd. A.C. 1993. Freeze-dried mixed cultures as reference
samples in quantitative and qualitative microbiological examinations of food.
J. Appl. Bacteriol. 74:143-148.
2. Anonymous, 2007. Protocol. Microbiology. Drinking Water & Food. The
National Food Agency.
3. Kelly, K. 1990. Outlier detection in collaborative studies. J. Assoc. Off. Anal.
Chem. 73:58-64.
A B C A B C A B C A B C A B C A B C A B C A B C A B C A B C A B C A B C A B C 1081 3 2 1 4.41 4.34 5.2 3.94 0 4.34 3.95 0 3.94 3 0 0 0 0 5.56 - - - 2.38 0 0 2.38 0 0 - - - 3.53 2.95 0 0 0 2.99 1081 1149 1 2 3 4.33 4.31 5.25 3.95 <1 4.66 3.7 <1 3.94 3.6 <1 <1 <1 <1 5.19 - - - 3.35 3.1 <1 <1 <1 3.61 1149 1254 2 3 1 - - - 3.75 <2 4.48 3.83 <2 4.18 - - - <3 <3 4.95 - - - 3.43 <1 <1 - - - 3.71 3.28 <1 <1 <1 3.78 1254 1290 3 2 1 4.3 4.1 5.4 3.8 <1 4.4 3.7 <1 4 - - - <1 <1 5.3 - - - 3.2 <1 <1 - - - 3.6 3.3 <1 <1 <1 3.5 1290 1594 1 2 3 4.34 4.26 5.34 3.71 <2 4.58 3.89 <2 4.23 3.32 <1 <1 <3 <3 5.26 - - - 3.67 <1 <1 - - - <2 3.3 <2 3.63 3.36 <1 <1 <1 3.81 1594 1970 1 2 3 4.45 4.14 5.48 3.76 <2 4.43 3.91 <2 4.3 3.32 <1 <1 <3 <3 5.11 <1 4.91 4.63 3.54 <1 <1 3.4 <1 <1 4.46 5.28 5.45 <2 3.34 <2 3.79 3.46 <1 <1 <1 4.08 1970 2035 3 1 2 - - - 3.8 <1 4.1 - - - 3.7 4.3 <1 3.2 <1 <1 2.9 <1 <1 - - - 3.5 3.3 <1 <1 <1 3.6 2035 2058 3 2 1 4.22 4.28 5.34 - - - 3.87 0 3.99 3.05 0 0 0 0 5.26 - - - 3.36 0 0 - - - 3.53 3.08 0 0 0 3.34 2058 2072 1 2 3 4.3 4.15 5.3 4.04 <2 3.7 3.9 <2 4.2 3.04 <1 3.53 <3 <3 5.2 - - - 2.7 <1 <1 - - - 3.6 3.3 <1 <1 <1 3.7 2072 2086 3 2 1 - - - 2086 2324 1 2 3 4.28 4.2 5.11 3.79 0 4.54 - - - 3.15 0 0 0 0 3.15 - - - 3.67 3.36 0 0 0 2.97 2324 2344 1 2 3 4.28 4.46 5.1 3.46 0 4.6 3.46 0 3.79 3.08 0 - 0 0 5.11 3.93 - - 3.54 0 0 3.49 0 0 - - - 3.57 3.43 3.7 0 0 3.78 2344 2386 3 2 1 4.49 4.93 5.3 - - - 3.85 <2 4.24 3.2 <1 <1 <3 <3 5.11 - - - 2.3 <1 <1 - - - 2386 2402 1 2 3 4.5 4.48 4.68 3.94 <1 4.18 4.08 <1 4.35 - - - 1.54 <1 <1 - - - 3.62 3.26 <1 <1 <1 3.72 2402 2459 2 3 1 5.12 6.29 6.34 - - - 0.9 0 5.26 - - - 0 0 6.09 - - - 2459 2553 1 2 3 - - - 3.2 <2 4.04 3.1 <1 <1 <3 <3 5.6 3.9 4.1 <1 3.4 <1 <1 3.4 <1 <1 - - - 2553 2637 2 3 1 4.36 4.36 5.26 3.82 <1 4.58 3.95 <1 4.2 3.15 <1 <1 <1 <1 4.86 3.87 4.2 <1 3.18 <1 <1 2.93 <1 <1 - - - 3.61 3.38 <1 <1 <1 3.4 2637 2720 3 1 2 4.28 4.32 5.1 3.67 <1 4.55 - - - 3.18 <1 <1 - - - 2.93 2.59 <1 <1 <1 3.58 2720 2745 3 2 1 4.12 4.15 5.12 3.79 <2 4.54 3.75 <2 4.2 3.36 <1 <1 <3 <3 5.2 - - - 3.71 <1 <1 - - - 2745 2764 2 3 1 3.98 4.41 5.15 3.7 <1 4.64 3.67 <0.60 3.89 3.08 <0 <0 - - - 3.84 <2 <2 - - - 3.2 <0 <0 - - - 3.45 3.32 <1 <1 <1 3.28 2764 2842 2 3 1 3.26 4.08 4.65 3.54 <1 4.15 3.4 <1 3.23 2.86 <1 <1 <1 <1 5.51 3.78 3.79 <2 3.08 <1 <1 3.3 <1 <1 - - - 3.08 3.04 <1 0 0 3.18 2842 2920 2 1 3 4.41 4.34 5.25 3.79 <1 4.48 3.85 <1 4.19 - - - 3.17 <1 <1 - - - 2920 3055 3 2 1 4.11 4.29 4.88 3.54 <1 4.32 - - - 3.29 <1 2 - - - 3.54 3.32 <1 <1 <1 3.35 3055 3225 3 1 2 4.2 4.22 5.18 3.72 <1 4.46 - - - 2.9 <1 <1 - - - 3.45 3.25 <1 <1 <1 3.43 3225 3243 2 1 3 4.34 4.28 5.21 3.79 <1 4.5 - - - 3243 3305 1 2 3 4.5 4.2 5.1 4 <2 4.6 3.8 <2 4.2 <1 <1 <1 <3 <3 <3 3.3 4.1 4.5 3.4 <1 <1 3.6 <1 <1 4.4 4.7 5.2 <2 3.3 <2 3.6 3.2 <1 <1 <1 3.6 3305 3346 2 1 3 4.19 4.31 5.33 3.8 <1 4.64 3.85 <1 4.31 3.11 <2 <2 <2 <2 5.2 3.92 4.18 <2 3.38 <1 <1 3.53 <1 <1 - - - 3.61 3.32 <2 <2 <2 3.59 3346 3457 2 3 1 4.56 4.25 5.16 3.63 <2 4.44 - - - <3 <3 4.93 3.87 4.19 <1 3.54 <1 <1 - - - 4.16 4.54 5.2 <2 3.55 <2 <1 3.39 <1 <1 <1 3.66 3457 3511 1 3 2 - - - 3.74 <1 4.51 3.65 <1 <1 - - - <1 <1 5.45 - - - 4.29 4.33 5.23 <1 3.23 <1 3.6 3.29 <1 <1 <1 3.99 3511 3543 3 2 1 4.28 4.54 5.22 4.12 <1 4.71 - - - 3.06 <1 <1 <1 <1 4.68 - - - 3.23 <1 <1 - - - 4 3.45 <1 <1 <1 4.2 3543 3587 3 1 2 4.18 4.2 5.01 3.61 <1 4.44 3.6 <1 4.06 <1 <1 <1 <1 <1 4.7 - - - 2.15 <1 <1 - - - 3.41 3.11 <1 <1 <1 - 3587 3588 3 1 2 4.3 4.3 5.15 3.89 <2 4.58 3.96 <2 3.31 2.98 <1 <1 <3 <3 4.12 3.86 <1 <1 - - - 3.15 <1 <1 - - - 3.62 3.27 <1 <1 <1 3.66 3588 3626 2 3 1 4.4 4.3 5 3.7 <2 4.6 3.9 <2 4.1 3.1 <1 <1 <3 <3 5.4 - - - 3.3 <1 <1 - - - 3626 3803 2 1 3 4.32 4.35 5.08 - - - 3.85 <2 4.14 3.19 <1 <1 <1 <1 5.04 4.01 4.23 <1 3.19 <1 <1 3.28 <1 <1 4.06 4.8 5.06 <2 3.44 <2 3.68 3.47 <1 <1 <1 4.06 3803 3831 1 3 2 5.09 4.28 4.31 - - - 4.33 <1 3.68 - - - <1 <1 3.58 - - - <1 3.43 3.59 3.72 <1 <1 3831 4047 2 3 1 4.22 5.06 5.2 3.84 <1 4.56 3.95 <1 4.17 3.43 <1 4.85 <1 <1 4.73 - - - 3.45 3.2 <1 <1 <1 3.3 4047 m 4.31 4.43 5.18 3.73 – 4.50 3.80 – 4.17 3.12 – – – – 5.10 3.92 4.21 – 3.36 – – 3.32 – – 4.2 4.67 5.14 – 3.61 – 3.59 3.32 – – – 3.64 m
Yeast Mould Lab.
no. Coagulase pos. Staphylococcus Lactic acid bacteria Clostridium perfringens Anaerobic sulphite red. Aerobic m.o. in fish. 20-25 °C Hydr.sulph. prod. bacteria in fish Lab. no. Sampl e Aerobic microorg. 30 °C
Entero-bacteriaceae Escherichia coli
Presumptive
Bacillus cereus
Appendix 1.
Results from the participating laboratories.
All results are expressed in log10 cfu per ml sample.
Results reported as "< value" were regarded as zero (negative).
Results reported as "> value" were excluded from the calculations.
A dash in the table indicates that the analysis was not performed.
A B C A B C A B C A B C A B C A B C A B C A B C A B C A B C A B C A B C A B C
Yeast Mould Lab.
no. Coagulase pos. Staphylococcus Lactic acid bacteria Clostridium perfringens Anaerobic sulphite red. Aerobic m.o. in fish. 20-25 °C Hydr.sulph. prod. bacteria in fish Lab. no. Sampl e Aerobic microorg. 30 °C
Entero-bacteriaceae Escherichia coli
Presumptive Bacillus cereus 4050 2 3 1 4.4 4.31 5.17 3.72 <2 4.52 - - - 3.3 <1 <1 - - - 4.17 4.35 <1 - - - 3.69 3.37 <1 <1 <1 3.61 4050 4064 3 2 1 4.12 4.19 5.04 3.66 <1 4.59 3.68 <1 4.06 - - - 4064 4153 3 1 2 4.45 4.28 5.26 3.69 <2 4.69 3.83 <2 4.34 3.11 <1 <1 <3 <3 5.11 3.97 4.18 <1 3.18 <1 <1 3.32 <1 <1 - - - <2 3.91 <2 3.57 3.32 <1 <1 <1 3.63 4153 4171 2 3 1 4.28 4.83 5.11 3.7 <1 4.7 4.15 <0.60 4.71 <0 <0 <0 - - - 3.81 <2 <2 - - - >3.18 <0 <0 - - - 3.61 3.28 <1 <1 <1 3.86 4171 4246 2 3 1 4.3 4.28 4.91 - - - <2 <2 4.62 - - - 4246 4278 3 1 2 3 3.15 3.57 2.6 0 3.36 - - - 2.78 0 0 - - - 2.54 2.15 0 0 0 2.78 4278 4288 1 2 3 5.38 5.3 6.26 4.96 0 5.3 4.93 0 4.95 3.08 0 0 0 0 6.3 - - - 4.1 0 0 3.74 0 0 - - - 3.78 4.39 0 0 0 4.62 4288 4305 2 1 3 4.16 4.28 5.24 3.76 <2 4.38 - - - <1 <1 <1 - - - 4.12 4.25 5.16 - - - 3 <1 <1 - - - 3.71 3.29 3.23 <1 <1 3.62 4305 4339 2 1 3 4.3 4.4 4.9 3.9 <2 4.5 3.9 <2 4.1 3.4 <1 <1 <3 <3 4.7 4 4.3 <1 3.4 <1 <1 3.7 <1 <1 4.2 5 4.9 <2 3.6 <2 3.8 3.3 <1 <1 <1 3.9 4339 4352 2 3 1 - - - 3.18 <2 <2 <3 <3 5.04 - - - 4.23 4.52 5.18 <2 3.7 <2 3.65 3.11 <2 <2 <2 3.66 4352 4353 2 3 1 4.43 4.04 5.63 - - - 3.23 <1 <1 - - - 3.4 <1 <1 - - - 3.52 3.43 <1 <1 <1 3.23 4353 4356 3 1 2 4.28 4.87 5.04 3.79 <2 4.58 3.8 <2 4.08 2.92 <1 <1 <3 <3 4.86 - - - 2.98 <1 <1 - - - 3.23 3.43 3.94 <1 <1 3.81 4356 4400 2 1 3 4.4 4.2 4.8 3.8 0 4.4 - - - 4.2 0 0 - - - 3.5 3.1 0 0 0 3.5 4400 4562 1 3 2 4.26 4.41 5.04 3.73 <1 4.32 3.69 <1 3.79 3.2 <1 <1 <1 <1 4.91 3.98 4.15 <1 3.4 <1 <1 - - - 3.75 3.4 <1 <1 <1 3.11 4562 4633 1 3 2 4.44 4.2 5.33 3.82 <1 4.33 3.88 <1 4.15 3.2 <1 <1 <1 <1 5.34 - - - 3.43 <1 <1 3.36 <1 <1 - - - 3.61 3.35 2.44 <1 <1 3.44 4633 4635 2 3 1 3.46 5.34 5.41 3.72 <2 4.45 - - - 3.16 <1 <1 <3 <3 5.32 4 4.3 <1 - - - 3.41 <1 <1 - - - 3.56 3.36 <1 <1 <1 3.58 4635 4658 2 3 1 4.33 4.62 5.51 3.46 <2 4.49 3.82 <2 4.49 - - - <3 <3 5.06 - - - 4658 4689 1 2 3 - - - 4.1 0 4.5 - - - 2.9 0 0 - - - 4689 4713 2 3 1 4.4 4.18 5.36 3.68 <1 4.61 2.85 <2 4.28 3.48 <1 <1 <3 <3 5.18 4.11 <1 - 3.2 <1 <1 3.2 <1 <1 4.15 3.92 4.77 - 3.3 - 3.64 3.38 <1 <1 <1 3.4 4713 4817 2 3 1 4.32 4.2 5.17 3.74 <2 4.59 3.84 <2 4.48 <1 <1 <1 <3 <3 4.98 - - - 3.11 <1 <1 - - - 3.68 3.36 <1 <1 <1 3.76 4817 4840 2 3 1 4.34 4.32 5.45 3.75 <1 4.67 3.82 <1 4.2 - - - <1 <1 5.18 4.04 4.34 <1 3.28 <1 <1 - - - 4.41 3.2 4.04 <1 <1 3.28 4840 4889 3 1 2 4.3 4.36 5.34 3.85 0 4.62 3.94 0 4.38 3.3 0 0 0 0 0 - - - 3.48 0 0 4.18 4.96 5.38 0 3.97 0 3.6 3.38 0 0 0 3.26 4889 4951 1 3 2 4.15 4.05 4.9 3.29 <1 4.19 3.82 <1 3.87 - - - 3.04 2.85 <1 <1 <1 3.24 4951 4955 1 2 3 4.25 4.96 5.39 3.74 <2 4.64 3.76 <2 4.11 3.18 <1 <1 <3 <3 5.07 4.1 4.3 <1 3.34 <1 <1 3.34 <1 <1 - - - 3.61 3.38 <1 <1 <1 3.72 4955 4980 2 3 1 4.23 4.82 5.09 3.76 <2 4.3 3.69 <2 3.98 3.08 <1 <1 <3 <3 4.92 - - - 3.57 3.24 <1 <1 <1 3.7 4980 5018 1 3 2 4.21 4.24 5.04 3.62 <1 4.34 3.51 <1 4.15 2.72 <1 <1 <1 <1 4.9 4.1 4.88 <1 3.08 <1 <1 3.12 <1 <1 - - - 3.58 3.31 <1 <1 <1 3.76 5018 5100 2 1 3 4.22 4.25 5.48 - - - 3.73 - 4.31 - - - 4.52 3.36 - - - 4.29 5100 5119 2 3 1 4.35 4.31 5.29 - - - 4.03 <1 4.3 - - - 5119 5162 3 2 1 4.37 5.83 5.71 - - - 2.97 <1 <1 - - - 3.56 3.37 <1 <1 <1 3.37 5162 5197 3 1 2 4.6 4.5 5.2 4.1 <1 4.7 4 <1 4.3 - - - <1 <1 5.2 - - - 3.6 3.4 <1 <1 <1 4.4 5197 5201 2 1 3 4.25 5 5.15 3.57 <2 4.5 3.45 <2 4.2 2.51 <1 <1 <3 <3 5.1 - - - 3.58 3.38 <1 <1 <1 3.47 5201 5204 1 3 2 4.2 4.9 5.2 3.7 <2 4.4 3.8 <2 4 3.3 <2 <2 <3 <3 4.9 <1 <1 4.1 3.2 <1 <1 - - - 3.5 <1 <1 <1 <1 2.7 5204 5220 2 3 1 4.19 4.01 5.2 - - - 3.74 0 4.06 - - - 0 0 5.04 - - - 3.55 3.19 0 0 0 3.27 5220 5250 3 2 1 - - - 5.22 >1.0 4.42 4.24 >1.0 4.31 - - - 4.34 4.23 5.23 - - - 3.13 >1.0 5.57 >1.0 >1.0 3.61 5250 5304 1 2 3 4.51 4.67 5.26 - - - 3.96 <1 4.14 - - - 3.57 <1 <1 - - - 3.72 3.46 <1 <1 <1 4 5304 5329 1 2 3 4.4 4.24 5.57 3.99 <2 4.6 - - - 2.82 <1 <1 <2 <2 5.64 3.96 <1 <1 - - - 3.65 3.4 <1 <1 <1 3.48 5329 5333 3 1 2 4.32 4.28 4.03 3.62 <2 4.49 - - - 2.99 <1 4.96 <3 <3 4.71 - - - 3.26 3.32 <1 3.26 2.3 4.04 5333 5338 2 3 1 4.5 4.3 5.4 - - - 3.8 3.6 <1 <1 <1 4.32 5338 5350 2 1 3 4.3 4.4 5.56 - - - 3.98 <2 4.37 3.16 <1 <1 - - - 3.3 <1 <1 - - - 2.53 2.45 <1 <1 <1 2.26 5350 5380 2 1 3 3.95 5.28 5.41 3.85 <2 4.54 3.74 <2 4.26 3 <1 <1 <2 <2 5.31 - - - 3.71 3.18 - - - - 5380 5545 2 1 3 4.3 4.2 4.9 3.7 <1 4.6 - - - 3.1 <1 4.5 <1 <1 5.4 3.9 3.1 4.9 - - - 3.5 3.2 <1 <1 <1 3.7 5545 5553 1 2 3 - - - 3.36 <1 4.44 3.6 <1 4.04 3.19 <1 <1 <1 <1 5.01 - - - 3.79 <1 <1 - - - 5553 5615 3 2 1 4.4 5.11 5.43 3.81 <2 4.54 3.7 <2 4.32 3.23 <1 <1 <3 <3 5.18 - - - 3.23 <1 <1 3.18 <1 <1 - - - 3.65 3.32 4.15 <1 <1 3.08 5615 5647 1 3 2 4.47 4.33 4.77 4.17 0 4.41 3.34 0 4.07 - - - 0 0 5.28 - - - 2.46 0 0 3.77 0 0 - - - 3.72 3.42 0 0 0 3.6 5647 5701 1 3 2 - - - 5701
A B C A B C A B C A B C A B C A B C A B C A B C A B C A B C A B C A B C A B C
Yeast Mould Lab.
no. Coagulase pos. Staphylococcus Lactic acid bacteria Clostridium perfringens Anaerobic sulphite red. Aerobic m.o. in fish. 20-25 °C Hydr.sulph. prod. bacteria in fish Lab. no. Sampl e Aerobic microorg. 30 °C
Entero-bacteriaceae Escherichia coli
Presumptive Bacillus cereus 5774 1 3 2 - - - 3.81 <2 4.41 - - - <3 <3 5.36 - - - 3.59 3.4 <1.70 <1.70 <1.70 3.74 5774 5801 3 1 2 4.11 4.15 4.74 3.6 <2 4.34 - - - 3.18 <1 <1 - - - 3.18 3.16 <1 <1 <1 3.18 5801 5883 1 3 2 4.24 4.26 5.22 3.66 <2 4.46 3.68 <2 4.12 2.98 <1 <1 <3 <3 5.08 - - - 3.23 <1 <1 - - - 3.66 3.36 <1 <1 <1 3.59 5883 5893 2 1 3 4.4 3.3 5.8 3.7 0 4.3 4 0 4.7 - - - 1.9 0 0 - - - 3.8 3.2 0 0 0 3.7 5893 5993 1 3 2 - - - 0 0 8.89 - - - 5993 6052 3 2 1 4.74 4.98 5.14 3.91 <1 4.64 3.84 <1 4.3 - - - <1 <1 5.11 4 3.2 <1 - - - 4.24 4.2 4.84 <1 <1 3.5 6052 6109 3 1 2 4.18 4.43 5.57 - - - 3.52 <1.6 3.87 3.32 <1 <1 - - - 4.11 <2 <2 - - - 3.36 <1 <1 - - - 3.62 3.41 <1 <1 <1 3.79 6109 6138 2 3 1 4.14 4.9 5.38 3.79 <2 4.34 3.85 <1 4.13 3.18 <2 <2 <2 <2 5.23 - - - 3.54 <1 <1 - - - 3.6 3.41 <2 <2 <2 3.48 6138 6175 3 2 1 - - - 3.49 3.36 0 0 0 3.57 6175 6220 3 2 1 4.25 5.25 5.17 - - - 3.2 <1 4.04 - - - 6220 6224 2 3 1 4.5 5.2 5.3 3.9 <1 4.5 - - - 3.1 <1 <1 - - - 6224 6232 2 1 3 4.19 4.15 4.91 3.49 <1 4.41 - - - 6232 6253 3 1 2 4.25 4.36 5.17 3.89 <1 4.7 3.81 <1 4.18 3.04 <1 <1 <1 <1 5.15 - - - 3.2 <1 <1 - - - 3.69 3.38 <1 <1 <1 3.9 6253 6343 2 1 3 4.32 4.22 5.11 3.81 <1 4.56 3.81 <1 4.15 3 <2 <1 <3 <1 5.04 - - - 3.28 <1 <1 3.04 <1 <1 - - - 3.54 3.18 <1 <1 <1 3.8 6343 6352 1 2 3 4.27 4.19 5 3.7 <2 4.4 3.8 <2 4.1 3 <2 <2 <3 <3 4.74 3.9 4.16 <1 3.3 <1 <1 - - - 3.54 3.37 <1 <1 <1 3.55 6352 6368 2 1 3 4.3 4.3 5.19 3.66 <2 4.64 3.85 <2 4.28 3.28 <1 <1 <3 <3 5.08 3.91 4.2 <1 - - - 3.32 <1 <1 4.08 4.84 5.28 <2 4 <2 3.62 3.26 <1 <1 <1 3.73 6368 6456 2 3 1 4.39 4.33 5.19 3.81 <1 4.11 3.78 <1 4.27 3.13 <1 <1 <1 <1 5.18 - - - 3.35 <1 <1 3.43 <1 <1 - - - 3.63 3.36 <1 <1 <1 3.85 6456 6490 1 3 2 4.26 4.2 5.23 3.67 <2 4.42 - - - 3.18 <1 <1 <3 <3 5.6 - - - 3.45 <1 <1 - - - 3.72 3.4 <1 <1 <1 3.72 6490 6594 2 3 1 4.3 4.83 5.11 3.93 4.34 4.45 3.62 <2 4.04 2.86 <1 <1 - - - 3.4 <1 <1 - - - 3.58 3.26 <1 <1 <1 4 6594 6628 2 3 1 4.29 4.36 5.07 - - - 3.33 3.19 0 0 0 3.73 6628 6658 3 1 2 5.17 4.28 4.83 3.82 <1 4.14 - - - 2.86 <1 <1 - - - 6658 6707 2 3 1 4.36 4.38 5.08 3.76 <2 4.32 3.76 <2 4.28 3.11 <1 <1 <3 <3 5.53 - - - 3.54 <1 <1 3.48 <1 <1 4.16 4.26 5.06 <2 3.85 <2 3.51 <1 <1 <1 <1 3.58 6707 6720 2 1 3 4.41 4.35 5.13 3.83 <1 4.6 3.73 <1 4.21 3.16 <1 <1 <1 <1 5.14 - - - 3.48 <1 <1 3.49 <1 <1 - - - 3.65 3.42 <1 <1 <1 4.13 6720 6762 2 1 3 3.66 4.76 5.08 3 <1 4.41 3.95 <1 4.11 - - - 6762 6852 1 2 3 4.5 4.4 5.4 3.9 0 3.9 4 0 4 - - - - 4.2 - - - 3.8 3.4 0 0 0 3.8 6852 6944 3 1 2 - - - 3.77 <1 4.14 3.58 <1 <1 <1 <1 5.02 3.86 4.14 <1 - - - 3.86 4.01 4.95 <1 2.9 <1 3.41 3.26 <1 <1 <1 3.65 6944 6958 2 3 1 4.21 4 5.04 3.86 <1 4.83 - - - 2.95 <1 <1 - - - 3.51 3.13 <1 <1 <1 3.18 6958 6971 3 1 2 2.48 3.28 3.53 2.3 0 2 - - - 2.15 2.86 3.43 - - - 6971 6992 3 2 1 4.51 4.53 5.63 4.04 <1 4.48 4.04 <1 4.32 2.98 <2 <2 <0.48 <0.48 5.7 - - - 3.23 <1 <1 - - - 3.62 3.23 <1 <1 <1 3.67 6992 7024 3 1 2 4.38 4.42 5.11 3.75 <1 4.64 - - - 3.05 <1 <1 - - - 3.54 3.31 3.85 <1 <1 3.28 7024 7096 1 3 2 4.36 4.79 5.34 - - - 3.74 <2 4.3 - - - <3 <3 5.32 - - - 4.18 4.4 5.18 <2 3.95 <2 - - - 7096 7182 3 2 1 4.45 4.9 5.24 3.82 <1 4.19 3.82 <1 3.99 - - - 4.14 4.29 <1 - - - 3.61 <1 <1 <1 3.35 3.99 7182 7207 1 3 2 4.36 5.32 5.9 3.43 <1 4.4 - - - 3.78 <1 <1 - - - 3.41 3.12 <1 <1 <1 3.59 7207 7232 1 2 3 4.51 5.16 5.4 - - - 3.76 3.37 3.69 <1 <1 3.52 7232 7242 2 3 1 4.26 4.37 4.99 3.4 0 4.65 3.38 0 4.2 2.48 0 3.75 - - - 3.44 0 0 - - - 3.61 3.46 0 0 0 3.7 7242 7248 3 1 2 4.19 4.24 4.99 3.66 <2 4.48 3.88 <2 4.15 3.03 <1 <1 <3 <3 4.85 3.56 4.05 4.62 3.09 <1 <1 3.16 <1 <1 - - - 3.67 3.39 <1 <1 <1 3.64 7248 7253 1 3 2 4.33 4.25 4.98 3.4 <1 4.48 3.32 <1 4.01 - - - 3.55 3.36 <1 <1 <1 3.83 7253 7334 2 1 3 4.26 4.17 5.1 - - - >1 <1 >1 2.6 <1 3.54 <1 <1 >1 - - - 3.52 <1 <1 - - - 3.04 3.2 <1 <1 <1 3.47 7334 7438 3 1 2 4.2 4.11 5.05 3.59 <1 4.29 3.83 <1 4.09 3.08 <1 <1 <1 <1 5.03 - - - 2.63 <1 <1 2.6 <1 <1 - - - 3.74 3.18 3.64 <1 <1 3.8 7438 7449 3 1 2 4.26 4.28 5.29 3.68 <2 4.49 - - - 3.57 3.38 4 <2 <1 3.81 7449 7533 2 1 3 4.39 4.63 5.59 - - - 2.9 <1 <1 <1 <1 5.56 - - - 3.7 3.28 <1 <1 <1 3.57 7533 7543 2 3 1 - - - 7543 7564 1 2 3 4.28 4.23 5.2 3.72 <2 4.57 3.87 <2 4.46 3.04 <1 <1 <3 <3 5.11 3.89 4.93 5.04 3.41 <1 <1 3.26 <1 <1 4.11 4.6 5.3 <2 4.04 <2 3.7 3.26 <1 <1 <1 3.38 7564 7596 3 2 1 4.4 4.2 5.6 3.8 <2 4.8 4 <2 4.3 3.2 <2 <2 <3 <2 5.5 - - - 3.6 <1 <1 4.2 5.1 5.6 <2 3.8 <2 - - - 7596 7627 2 3 1 4.5 4.4 5.2 - - - <1 <1 <1 - - - 3.4 <1 <1 - - - 3.7 3.4 <1 <1 <1 3.6 7627 7688 3 2 1 4.23 4.35 5.2 3.6 <1 4.61 3.93 <1 4.34 3.1 <1 <1 - - - 3.98 4.36 <1 3.41 <1 <1 3.36 <1 <1 - - - 3.65 3.45 <1 <1 <1 3.41 7688 m 4.31 4.43 5.18 3.73 – 4.50 3.80 – 4.17 3.12 – – – – 5.10 3.92 4.21 – 3.36 – – 3.32 – – 4.2 4.67 5.14 – 3.61 – 3.59 3.32 – – – 3.64 m s 0.12 0.31 0.24 0.17 – 0.14 0.16 – 0.17 0.25 – – – – 0.30 0.21 0.09 – 0.18 – – 0.22 – – 0.13 0.33 0.19 – 0.32 – 0.14 0.13 – – – 0.32 s