Master’s Programme in Biomedicine
Degree Project in Biomedicine (30 hp)
Name: Florian Andreas Schober (florian.schober@stud.ki.se)
Title: A Novel Approach to Centrosome Asymmetries in Budding Yeast
Supervisor:
Assistant Professor Victoria Menendez-Benito, PhD
Alexander Julner Dunn
Supervisor affiliation:
Laboratory of Professor Karl Ekwall
Department of Biosciences and Nutrition
Karolinska Institute, Novum
ABSTRACT
Asymmetrically dividing stem cells inherit cellular components unequally to descending daughter cells. This creates two distinct cellular profiles originating from one mother cell. Among that, centrosomes are inherited according to their age in several types of stem cells. Centrosomes are the main microtubule organisation centres in the eukaryotic cytoplasm. Their two subunits duplicate once per cell cycle, which results in two differently aged centrosomes. However, it remains unknown how age can determine the fate of the organelle. Here, we studied asymmetries of spindle pole bodies (SPB), centrosome equivalents in budding yeast. To discriminate new and old SPB components, we used switchable fluorescent protein tags. By combining automated microscopy with unbiased high-content image analysis, we detected new asymmetry patterns of Nud1, the yeast homologue of the mammalian centrosome protein centriolin, and Spc97, a conserved adaptor protein for the microtubule receptor. Furthermore, our data shows a profound size asymmetry between the two cellular SPBs at early anaphase that is resolved by selective degradation of old components. Our findings support a dynamic and less conservative model of the SPB than previously thought with addition of new components to both SPBs and selective degradation of old subunits. For future studies, the developed methodology can be applied to high-throughput screenings for mutations that affect SPB inheritance patterns. This knowledge about SPB asymmetry formation might allow to find homologous regulators and mechanisms in mammalian cells and provide biological target sites for disease treatment.
I. INTRODUCTION
Stem cells are able to divide into two daughter cells, of which one continues to feed the stem cell pool and one initiates a differentiation pathway. This asymmetric division requires a proper segregation of cell fate determinants that guide cellular material of different quantity, property and age to each one of the two descendants (1). Among those determinants, centrosomes display a distinct inheritance pattern. Centrosomes are the main organisation centres for microtubule nucleation in eukaryotic cells, which are central to the formation of mitotic spindles as well as primary cilia. Mitotic spindles consist of two centrioles surrounded by pericentriolar material. Centrioles do not divide but are duplicated once per cell cycle. Because of that, they can be distinguished by age. One daughter cell receives an old centriole that was formed before the last cell cycle whereas the other one gains the newer one (reviewed in (2)). This asymmetry was shown to have a profound impact on cilia formation as the old centriole assembles primary cilia markedly faster than the new one, creating a time-correlating differential response to signalling factors between the two daughter cells. This is of importance in hedgehog signaling (3), a central developmental pathway.
Additionally, there is increasing evidence on stereotypical and non-equal centrosome behaviour and segregation in animal cells during mitosis and spindle formation. The pioneer finding came from studies in Drosophila neuroblasts. During the early cell cycle, the daughter centrosome stays at the apical pole and starts nucleating microtubules. In contrast, the mother centrosome moves around extensively in the cell. It is only shortly before mitosis that this centrosome settles at the basal pole and starts to develop a microtubule network (4). Following that, it is mostly the mother centrosome that is inherited to the differentiating daughter cell (5, 6). This brought up the hypothesis that the age of the centrosome could determine stem cell fate. However, the opposite pattern was found in Drosophila germ line cells. The cells are situated in stem cell niches adjacent to a complex of supportive cells called hub. It is significantly more often the younger daughter centrosome that migrates to the hub-opposite pole and is inherited to the differentiating gonioblast, whereas the mother centrosome is inherited to the cell that maintains the stem cell pool (7). Finally, Wang et al. could show a similar stereotypical behaviour in dividing murine radial glia cells (8).
Though the process of centrosome duplication has been extensively studied, it remains unknown why age-related cues of centrosomes correlate with cell fate decisions. Moreover, it is unclear how centrosome identity is achieved. A versatile model to study these questions is budding yeast (Saccharomyces cerevisiae). Of all eukaryotes, budding yeast has one of the
most basic microtubule nucleation centres (9) called spindle pole body (SPB), which has greatly facilitate studies on the asymmetry machinery.
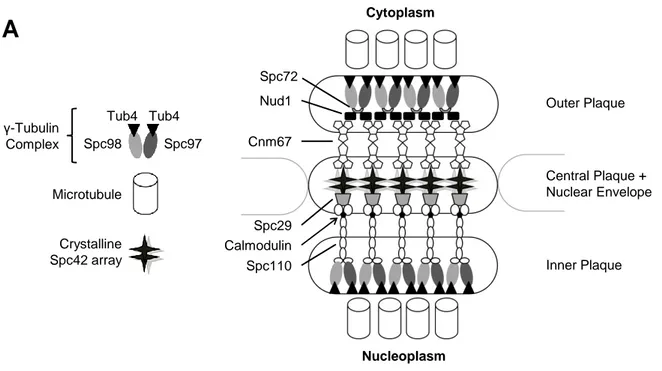
The composition of the SPB is profoundly different from centrosomes. The SPB comprises 18 core components, of which 16 are encoded by essential genes (10). As the nuclear membrane of budding yeast does not break down during mitosis, the SPB gains access to the nucleoplasm by being stably inserted into the nuclear envelope. Seen with electron microscopy, the SPB is built up of three flat plaques that are stacked on each other (11, figure 1). The central plaque is composed of a crystalline array of Spc42, which is linked to the outer and inner plaque by Cnm67 and Spc110, respectively. On the cytoplasmic side, Cnm67 is linked to a γ-tubulin complex via Nud1 and Spc72, whereas the γ-tubulin complex binds directly to Spc110 in the nucleoplasm. The γ-tubulin complex, in turn, is able to nucleate microtubules via Spc97/98 bound Tub4 (reviewed in (10)). On the nucleoplasmic side, SPBs nucleate spindle microtubules that partly attach to the kinetochores of the centrosomes, whereas astral microtubules on the cytoplasmic side help in correctly positioning the spindle. Throughout the cell cycle, the central plaque has a short appendix on the cytoplasmic side, which is not inserted into the membrane. This “half-bridge” provides the core for SPB duplication, which starts in G1 phase by lengthening of the half-bridge and depositing Spc42, Cnm67, Nud1 and others (12) at the tip of this tuft. The deposit, called satellite, grows laterally and is inserted into fenestrae of the nuclear envelope forming a duplication plaque. Afterwards, Spc110p is recruited to the nucleoplasmic side of the newly formed SPB (12) and binds the γ-tubulin complex, which gains access by a nuclear localisation signal.
Albeit the much simpler structure of the yeast SPB compared to bicentriolar centrosomes, both structures show an analogous asymmetric inheritance pattern. Stereotypical inheritance of the central plaque component Spc42 was already found in 2001 by Pereira et al. (14). They observed that the old SPB mostly migrates to the budding daughter cell, whereas the newly formed SPB is inherited by the mother.
However, there is conflicting data on whether new components are also added to the old SPB (14 - 16) and it remains unclear to what extent newly formed components are integrated into both SPBs. Furthermore, it is not known if old proteins are removed during separation of the two SPB, which would be a prerequisite to keep SPB size stable throughout generations. To gain further insight into the mechanism of asymmetry formation, the aim of this degree project is to evaluate potential novel asymmetries of SPB components. Additionally, the dynamics of the central plaque protein Spc42 are studied to get a better understanding of
Here, we approach these questions by using recombination-induced tag exchange (RITE) a cassette that encodes switchable fluorescent tags established by Verzijbergen et al. (17). It is inserted at the endogenous locus and marks old components with GFP and newly formed proteins with RFP. To accurately quantify the ratios of old to new components, we intended to collect hundreds of images for sufficient statistical validity. In order to increase efficiency, we combined automated fluorescent microscopy with computerised structure detection. Thus, our study design is capable of producing quantifications that overcome qualitative assessments of SPB subunit turnover. This enables us to study insertion and recycling of components of several newly tagged SPB proteins and gives a more detailed picture of established strains.
II. MATERIAL AND METHODS
Strains and Growth Conditions
The Saccharomyces cerevisiae strains that were used in this study are listed in table S1. Cells were grown in yeast extract peptone medium complemented with 2% D-Glucose (YEPD) or on YEPD agar plates with 40 µg/mL uracil and 8µg/mL tryptophan. Hygromycin and nourseothricin were used as selecting reagents at 200µg/mL and 100µg/mL, respectively.
Genetic Constructs and Transformation
The genetic construct that was used to generate yeast strains with RITE-tagged SPB subunits was described previously ((16), Table S2), which consists of the following components: Spacer-LoxP-3xHA-yEGFP-ADH1t-HygroMX-LoxP-3xT7-mRFP. The construct was yielded from the bacterial plasmid pVM016 (17) via PCR using primers with overhangs of 40 nucleotides that were homologous to the genomic loci of cnm67, nbp1, nud1 and spc97 (Table S3). The PCR conditions were optimised by using 3% DMSO, Buffer for GC-rich templates and Phusion HotStart II DNA-Polymerase (Life Technologies). The PCR products were purified from excessive primers and salts (QIAquick PCR Purification Kit). 500ng to 1000ng of DNA were used to transform cells based on the LiOAc method (18).
The construct replaced the stop codon of the wild-type gene, which was verified by colony PCR with primers that were homologous to an upstream and downstream region of the potential insertion site and parts of the hygromycin cassette (Table S3 and Figure S1).
Additionally to colony PCR, the insertion site of the RITE-cassette was sequenced. Therefor, genomic DNA was extracted from positively transformed colonies according to a previously published protocol (19). In brief, cells were lysed in 200mM lithium acetate with 1% SDS at
70°C and DNA was precipitated in 95% ethanol. The cassette’s upstream and downstream insertion regions were PCR amplified with primers MF and DR (Figure S1) and the 1.2kb products were send for sequencing (Eurofins Genomics, Ebersberg/Germany).
Sample Preparation and RITE assay
YEPD containing the antibiotic Hygromycin B (Life Technologies) at a concentration of 0.2mg/mL was inoculated with a monoclonal colony of haploid yeast cells, which was then grown at 30°C for 16 hours and subsequently diluted 1:10 with fresh YEPD medium. Then, cells were grown for further 56 hours at 30°C up to post-diauxic shift, which is a stationary phase in which cells do not divide. We used this as a method to synchronise cells. The switch from GFP to RFP in RITE strains was induced for 16 hours by addition of 1nM β-estradiol to cells that were resuspended in glucose depleted, filter-sterilised medium without antibiotic. To identify mother cells by microscopy, cells were incubated with 2µg/µL Alexa Fluor 647 coupled to Concavalin A (A647 – ConA, Life Technologies), a lectin that binds to the cellular glycocalyx, in PBS for 30 minutes. At formation of the daughter cell, new membrane material is inserted at the site of budding. Therefore, A647-ConA is not transferred to the bud and specifically marks the mother cells. After four washes with 2% Galactose in PBS, the cells were released from post-diauxic shift by resuspension in fresh YEPD without antibiotics and grown in dark tubes for three hours at 30°C until harvest and fixation with 4% formaldehyde. Scars were stained on fixated material with 20µg/mL Calcofluor White (Sigma-Aldrich). For subsequent microscopy, the samples were plated at different concentrations on 96-well glass-bottom plates that had been coated with 0.25mg/mL Concavalin A for 5 minutes and dried overnight at room temperature. Samples were kept dark until imaging.
Automated Fluorescence Microscopy
All samples were imaged on a Nikon point scanning confocal microscope A1R with a 20X air objective that was controlled by Nikon NIS Elements software. To increase the amount of data, we performed automated high-throughput imaging using the JOBS tool in NIS Elements. The general strategy of this pipeline was: (a) Large overview image composed of several images at 512 x 512 pixels at a resolution worse than suggested by the Nyquist-Shannon sampling theorem using excitation lasers of 488nm (GFP) and 640nm (A647-ConA); (b) Automated identification of anaphase cells based on thresholds of the 405nm excitation autofluorescence signal, ellipticity, cellular fill area and overlap with A647 - ConA mother staining; (c) 13 or 9 focal planes with a distance of 0.9µm or 1.1µm, respectively, of
CellProfiler Analysis
Signals were quantified by CellProfiler software ((20), Version 2.1.1). The pipeline consisted of the following steps: (a) Sum and variance intensity projections of each z-stack; (b) Identification of cell-pairs based on GFP background signal; (c) Segmentation of SPBs within the cell-pair mask on either GFP variance intensity projections of Spc42-yEGFP strains or on a combination of GFP and RFP variance intensity projections by a further maximum projection for RITE-strains; (d) Recognition of either mother or daughter cell by propagation based on the segmented SPBs; (e) Mother segmentation based on A647 – ConA maximum projections and relation of SPBs to the mother mask. The presented values of SPB intensities are integrated signal intensities, which derive from measurements of the mean SPB signal intensity minus the mean intensity of either mother or daughter cell, multiplied with SPB fill area. The replicative age was inferred from scar coverage of the cell cortex. The values presented in this study are the percentage of cell wall that was covered with scars.
Statistics and Plotting
All statistical analyses were done with R ((21), Version x64 3.2.0). Two means were compared via paired or unpaired Student’s t-test and all confidence intervals were calculated assuming a normal distribution. Data was tested for normality using a Shapiro-Wilk Normality Test from the R package PerformanceAnalytics ((22), Version 1.4.3541). Correlation was assessed by Pearson’s Product - Moment Correlation. Beeswarm plots were generated with the R package beeswarm ((23), Version 0.2.0).
III. RESULTS
Cnm67, Nbp1, Nud1 and Spc97 are taggable components of the SPB
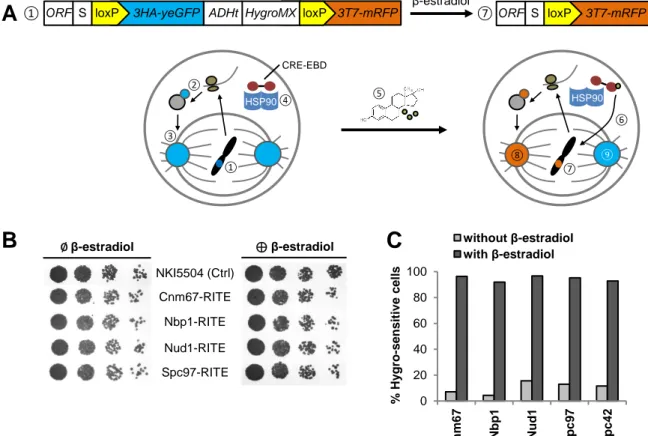
In order to study asymmetric inheritance patterns of SPB components, we intended to tag 10 budding yeast SPB genes (bbp1, cnm67, nbp1, ndc1, nud1, sfi1, spc72, spc97, tub4, kar9) at their endogenous locus with the RITE construct that was previously published (17). This cassette allows for discrimination of old and newly synthesised proteins by a switchable fluorescent tag (Figure 2A). It was inserted at the place of the stop codon of the respective genes (Figure S1). The transformation was successful for four SPB subunits: Cnm67, Nbp1, Nud1 and Spc97. Transformation efficiency was highest for cnm67 and spc97 and lower for nbp1 and nud1 despite similar amounts of transforming DNA. The correct insertion of the RITE-cassette was successfully shown by PCR and sequencing of both insertion sites on both strands (data not shown). Growth deficiencies were assessed by dilution series on agar plates,
using strains expressing X-Spacer-loxP-3xHA-yEGFP or X-loxP-3xT7-mRFP, with X being the endogenous SPB gene (Figure 2B). The strains including the parental control NKI5504 had grown similarly fast after incubation at 30° for 48 hours (Figure 2B), indicating that the C-terminal tag does not influence cellular proliferation. This result was verified by optical density measurements of strains release from post-diauxic shift in liquid medium before, shortly after and several days after tag switch induction with β-estradiol (Figure S2). During the time course of 5 hours no growth differences could be detected between all strains generated in this study (refer to Table S1) and the parental control NKI5504.
To test for the switch efficiency after β-estradiol induction and spontaneous switch without addition of β-estradiol, we plated a fixed amount of cells on plates with and without Hygro antibiotics, as resistance to Hygro is lost during the switch. We found stable switch efficiency across all strains, whereby 95% of cells lost the Hygro resistance gene after 18 hours of β-estradiol induction and 11% switched spontaneously without induction (Figure 2A). High spontaneous switch rate was found for RITE cassettes at the loci of nud1, spc42 and spc97 (15.6%, 11.6% and 13.0%), whereas nbp1 and cnm67 RITE cassettes were less likely to recombine (4.3% and 7.1%).
Therefore, Cnm67, Nbp1, Nud1 and Spc97 can be tagged with a switchable fluorescent tag and are suitable for asymmetry studies.
Cnm67, Nud1, Spc42 and Spc97 are asymmetrically inherited
To assess asymmetry of SPB components in the new RITE-strains, we combined automated microscopy using the JOBS module of the Nikon NIS Elements microscope software and high-content image analysis using CellProfiler (20). We found that all newly established strains had GFP positive signals located in a spot that we assumed to be the SPB. Furthermore, after recombinase induction with β-estradiol, we could detect RFP together with GFP signals. However, the signal-to-noise ratio differed profoundly between strains. Our pipeline was selecting for cells with two SPBs, one located in the bud (further called SPBbud) and one in the mother cell (SPBmother). Given those conditions, we could use 28.8% of all images of spc97-RITE, 18% of cnm67-RITE, 9.2% of nud1-RITE and 3.6% of nbp1-RITE. As a quality control, we used the strain spc42-RITE, which had been previously published (16) and achieved an image-to-data yield of 21.3%. Due to the limited usability of Nbp1-RITE and its high dropout rate, we did not continue to follow this particular strain.
We assessed asymmetry of RITE tagged strains of cnm67 (N=60), nud1 (N=32), spc42 (N=80) and spc97 (N=63) by measuring absolute fluorescent intensities of GFP and RFP for
SPBmother and SPBbud. Data of three independent experiments was pooled. The background-corrected values were then used to calculate an asymmetry index (AI):
AI = SPBbud− SPBmother SPBbud+ SPBmother
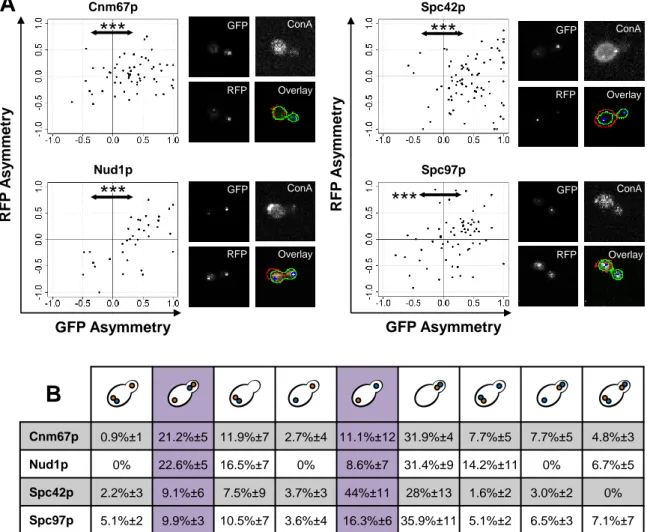
Thereby, AI > 0 indicates a brighter SPB in the budding daughter cell and vice versa for AI < 0. For all strains, we found that AI was significantly greater than the expected value μ0=0 for GFP (p < 0.001) but not for RFP signal intensities, indicating that GFP was highly asymmetric towards a brighter SPB in bud cells and RFP was symmetrically distributed over both SPBs (Figure 3A). However, the data also suggested that GFP and RFP signal intensities were coupled. We therefore grouped cells according to different asymmetry categories. A signal was counted as asymmetric, if its value was larger or smaller than the 99%-confidence interval. According to previously published data, we expected an asymmetry of GFP towards SPBbud and of RFP towards SPBmother (14, 15). We found that this observation could only be reproduced for Spc42 distribution (44% of all cells fulfilled the expectations), whereas Cnm67-, Nud1- and Spc97-RFP was most intense together with GFP tagged subunits in daughter cells (31.9%, 31.4% and 35.9%; Figure 3B).
Conclusively, our data highlights asymmetric distribution of new and old components of Cnm67, Nud1, Spc42 and Spc97.
Components of the new SPB are removed in late anaphase
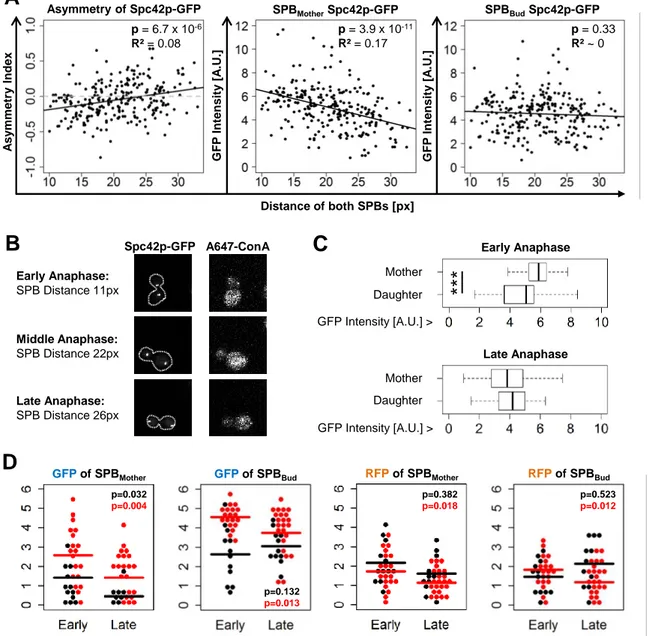
Tracing differentially aged SPB components revealed a partial correlation of GFP and RFP signal asymmetries of tagged Cnm67, Nud1 and Spc97. This suggests that protein levels and asymmetries of SPB components are dynamically regulated. To shed light on this hypothesis, we studied levels of Spc42-GFP, which we chose due to a high signal-to-noise ratio and thus solid data and low dropout rates. Using budding yeast strains with spc42 solely tagged with yEGFP (Table S1), we correlated GFP intensity levels with distances of SPBs towards each other, a proxy for anaphase progression (15, Figure 4B). In two biologically independent experiments (N=308), we found a positive correlation between asymmetry indexes of GFP signals and SPB distances (p=6.6x10⁻⁶), which resulted from an intensity decrease of SPBmother and not SPBbud (p=4.5x10⁻¹² vs p=0.23; Figure 4A). Furthermore, SPBsmother were significantly brighter at early anaphase, but this intensity difference was lost during spindle elongation (Figure 4C). This finding indicates that SPB elements are turned over during anaphase. Consequently, we asked whether the signal decrease was specific to old or new
proteins. We used a spc42-RITE strain to differentially tag old and new SPB components. Three hours after release from post-diauxic shift, we found a negative correlation between anaphase progression and intensities of GFP tagged old subunits in SPBmother (p=0.003) in two independent experiments (N=60), but no relation to RFP (p=0.08; Figure 4D). Consistent with what we found with yEGFP tagged Spc42, SPBbud intensities did not change during anaphase in spc42-RITE samples.
These results emphasize that the amount of SPB components and thus the SPB size is dynamic during anaphase and that old proteins are selectively degraded in SPBmother.
Asymmetry of SPC42 increases in aged cells
The lifespan of budding yeast is measured in the amount of cell divisions that a mother cell can undergo until it dies. Each division event leaves a scar, a chitin remnant at the budding site on the cell wall, which can be stained with Calcofluor White (24, CFW) and excited at 405nm. We used the bright CFW signals to measure a percentage coverage rate of scars on the cell membrane. Two biologically independent experiments with GFP tagged Spc42 strains were performed, whereby we could find significant positive correlations between scar coverage and SPBbud signal intensities (p=0.0005) at late anaphase (N=67), which was not detectable for SPBmother (p=0.12) and overall in early anaphase (N=63, p>0.4; Figure 5A). Thus, age is not a confounder of the size decrease of SPBmother but rather correlates with SPBbud. However, testing the normality assumption revealed significantly skewed values for scar coverage (p<0.001; Figure 5B), which points out that the test statistics are not suitable. Conclusively, we found indications for a correlation between age and SPB size, but the experimental setup has to be improved to draw statistically valid conclusions.
IV. DISCUSSION
Asymmetric division is a central mechanism during development to establish cell pools with different properties originating from one mother cell (25). Several cell types have been identified in which centrosomes follow asymmetry cues, a symmetry-breaking event that creates two differing daughter cells (7, 8). However, it is unclear what these cues are and how age-related properties of centrosomes are able to differentially react.
Budding yeast vs. higher eukaryotes to study centrosome asymmetries
The spindle pole body of the budding yeast Saccharomyces cerevisiae has been a powerful model to study these questions, although its morphology differs from bicentriolar
centrosomes. The yeast SPB consists of three electron-dense plaques which span the nuclear envelope to gain both constant access to the cytoplasm and nucleoplasm, whereas the centrosome is assembled by a pair of centrioles that lie orthogonally to each other, surrounded by pericentriolar material and situated in the cytoplasm. Despite these structural differences, there are several conserved components which include the γ-tubulin complex composed of Spc97, Spc98, Tub4 with the human homologues TUBGCP2, TUBGCP3 and TUBG1,2, furthermore the spacer protein Spc110 (human homologue Kendrin, CGNAP), and the signaling platform Nud1 with its human homologue Centriolin (reviewed in 26).
Moreover, the duplication mechanism of SPBs and centrosomes is partly similar. SPBs carry the half-bridge as a cytoplasmic appendix that grows into a satellite structure in G1 and is then inserted into the nuclear membrane as a duplication plaque (10). Centrosome duplication occurs in two steps, whereby (a) the centriole pair looses its orthogonality and a procentriole is formed attached to each centriole in G1-S phase and (b) the procentriole grows and matures until mitosis (27). As the procentriole is formed at a fixed distance to the pre-existing centriole, it is thought that a template structure exists that facilitates nucleation and assembly of new subunits at the procentriole. This resembles SPB duplication and, in fact, two proteins involved into the duplication mechanism have been identified as homologues ((26), yeast Sfi1 and Cdc31 with human Centrin-3,2,1 and HSfi1). When the centrioles separate, their symmetry is broken and the descending cell will have two differently aged centrioles, comparable to the differing age of the two SPBs in budding yeast.
Because of the similarities of core components, the duplication machinery and stereotypy, SPBs can serve as models to investigate centrosome asymmetry formation. This enables us to profit from the advantages of budding yeast as a model organism, which include elaborated genetical methods, rapid growth, less vulnerability and ethical considerations. However, it will be interesting to test assumptions about asymmetry formation in higher eukaryotes.
The suitability of the methods
The field has developed substantially within the last 15 years; however, the detailed mechanism of SPB duplication and asymmetric inheritance remains elusive. We developed a pipeline that enables us to combine high-content fluorescence microscopy with automated analysis of a high quantity of images. This improved both statistical accuracy by acquisition of a large number of images and data quality by eliminating observer bias. Our method is based on the assumption that the number of subunits in the SPB plaques correlates directly with the intensity of the fluorescence signal. The validity of this approach has been shown by
Yoder et al. (15). In tetraploid strains, one to four copies of spc110 were tagged with YFP, the remaining copies with CFP. They found a linear correlation between the number of tagged genes and the fluorescence intensity. Though this outlines our assumption, the interrelationship of component concentration to fluorescence signal should be verified for subunits tagged with the RITE cassette in tetraploid strains as well.
An increased number of tagged subunits do not only enhance the fluorescence signal intensity but also the visible size of the spindle pole body, which can grow vertically (11). To our knowledge, size changes had not been considered in previous studies and mean intensity values had been used to label SPBs as being brighter or dimmer. By using CellProfiler software (20), we could introduce an unbiased size measurement of SPB signals that is multiplied with the mean intensity values to calculate an integrated intensity per SPB. This is crucial for accurate quantitative measurements of intensity differences between old and new spindle pole bodies. Additionally, background signal can be determined more precisely in both mother and daughter cells as the visual border between SPB and non-SPB areas is defined in an unbiased way.
Although our approach could enhance data quality, we still face the problem that the border between SPB and background is determined by an absolute threshold that is calculated on whole image analysis and not dynamically for each SPB spot. As the background signal was significantly lower in daughter cells than in mother cells, which is most likely due to volume differences, the threshold for mother SPBs is relatively leaner than for daughter SPBs, which makes signals of SPBs in mother cells appear higher and in daughter cells lower. However, we were able to reproduce trends that we found by just using mean intensity values instead of integrated intensities. Mean values are less susceptible to inaccurate border detections, but lack the x-y-dimensional component of the SPB. The problem of inaccurate SPB border detection is more evident in images with high signal to noise ratios as seen for the nbp1-RITE strain. It would be possible to counteract the global thresholding by first identifying daughter and mother cells separately and locally calculate a threshold for SPB borders which is based on background to signal contrasts instead.
Detection of new SPB asymmetries
The newly developed pipeline gave gainful insights into unknown asymmetries of SPB components and added new information on the separation of old components to SPBmother and SPBbud during centrosome duplication. Asymmetric SPB segregation has first been shown by delayed appearance of slow-folding RFP fused to Spc42 in mother cell inherited SPBs (14).
Since then, several components have been found to be asymmetrically inherited, which are Spc110, Spc72, Tub4 and Cnm67 (13–15). We focussed our interest in components whose asymmetry has to our knowledge not been studied. We could show stereotypical inheritance of Spc97 and Nud1 and confirm findings on Cnm67 and Spc42. Our data indicates that old components of these proteins migrate to the daughter cell whereas the SPB that stays in the mother cell mostly receives new protein copies. Nonetheless, SPB duplication is not totally conservative in that the younger centrosome has partially old components and the older centrosome is subject to addition of new proteins (15, 16). During SPB duplication in G1, the cytoplasmic appendix of the SPB grows to form a satellite composed of the core components Spc42, Cnm67 and Nud1 (12). It is not known whether these components are transported from the old to the new SPB or if they nucleate as newly translated components at the half-bridge. Our data supports the hypothesis that a small portion of the new SPB derives from its mother. It is likely that these are the remnants of the satellite forming proteins that migrate from the mother SPB to the tip of the tuft. However, the presented data is not sufficient to explain the migration and to proof the origin of old components. Ultrastructural analyses with immuno-electron microscopy could help in clarifying this delicate question by using the RITE system with switchable proteins epitopes instead of fluorescent tags.
We found that asymmetry was less pronounced for spc97-RITE in comparison to spc42-RITE. However, whereas Spc42, Cnm67 and Nud1 tagged with GFP or RFP could be clearly separated from background noise, fluorescence labelled Spc97 was more difficult to segment. It is thus likely that the intensity values of SPBs and the corresponding background were less accurate than for other tagged subunits, which could account for the lower asymmetry. For nbp1-RITE, our method failed to produce a signal to noise ratio sufficient enough for SPB segmentation. A different fixation protocol that reduces background noise more effectively might be helpful for analysing Nbp1. Preliminary data indicates that fixation with cold ethanol could lead to better imageable samples. The lower signals could be due to a lower abundancy of Nbp1 and Spc97, though Spc97 has been shown to be highly present in yeast cells (28). Furthermore, an impaired integration of these components into the growing SPB due to the fusion to a fluorescent tag is likely due to the importance of the C-terminal domain in interaction with other subunits (10).
The role of Nud1 asymmetry
With regard to the previously found pronounced asymmetries of several other components, it is not surprising that Nud1 and Spc97 show a similar stereotypical behaviour. However, the
distribution of Nud1 during SPB duplication adds an interesting argument to the discussion about why the old mother SPB migrates into the bud in more than 9 out of 10 cells (14, 29, 30). Nud1 has recently come into focus as a central scaffolding protein within the mitotic exit network (MEN) (30, 31). The cascade is initiated by the recruitment of MEN signaling complexes to the SPB. It has been shown that phosphorylation of Nud1 is necessary in order for the machinery to bind and exacerbate its downstream functions. Phosphorylated Nud1 can, in turn, recruit Dbf2-Mob1, which releases an effector phosphatase from the nucleolus to propagate mitotic exit (31). Furthermore, Dbf2-Mob1 phosphorylates Kar9 (30), which is thought to be central for symmetry breakage of the two spindle pole bodies (32, 33). A Kar9 containing complex is recruited specifically to the old SPB. The Kar9 complex then translocates to the distal plus ends of SPB associated microtubules and associates with the motor protein Myo2 which drags microtubules into the budding daughter cell (34). The initiating event that breaks symmetry in this cascade is not clear yet, but it could be due to a differential timing in recruitment of MEN signaling complexes. The asymmetry of Nud1 indicates that it could be the different properties of old and new proteins that contribute to differential Kar9 loading on microtubules. It has been shown that Nud1 has at least 52 phosphorylation sites (35), whereby phosphorylation of a minimum of three locations is critical to recruitment of MEN signaling factors (31). All three phosphorylation sites are established during mitosis, but it is unclear when this happens. Two scenarios are possible: (a) phosphorylation occurs before Nud1 symmetry break, which would result in identical mitotic phosphorylation patters; (b) Phosphorylation of the critical site occurs after Nud1 symmetry has already been broken. In the second scenario, the asymmetry of Nud1 would cause Kar9 to bind specifically to microtubules of the old SPB body and thus label the whole old SPB as destined to go to the daughter cells. Yet, late phosphorylation would still generate SPBs with an identical mitotic phosphorylation pattern that are both educated recruiters of MEN factors to exit mitosis in that division round in both mother and daughter cells. Additionally to these scenarios, 13 sites of Nud1 are phosphorylated during G1 (35), which is most likely unique to the old SPB and which might contribute to differential recruitment of Kar9 as well. A more detailed analysis of phosphorylation patterns could help in answering this enigmatic question.
SPB component turnover during anaphase
We applied our methodology to spc42-yEGFP strains to understand to what extent components are added to or removed from the old and new SPB during anaphase after SPBs are separated and migrating to opposite poles. As readout for cell cycle progression, we used
the distance of the two SPBs towards each other, a value that has been used previously to correlate SPB position with cell cycle phase (15). This measurement is very simple to obtain and clearly marks beginning and end of anaphase. However, SPBs are partly wobbling around the major cell axis in early anaphase (32). Depending on the motion axis along the spherical dimensions of the nuclear envelope, cell cycle phase could be underestimated. Yet, terminal anaphase is clearly marked by the maximum possible distance of the SPBs in relation to cell axis. Therefore, a significant difference between the more inaccurate values in early anaphase and the precise measurements in late anaphase is rather seen as too small than too large. We found that Spc42-yEGFP of the new SPBmother was significantly brighter in early anaphase compared to its older parent SPBbud. This difference was resolved during anaphase by a significant decrease of yEGFP signal. How the size of the centrosome is a matter of controversial debates (36). A recent publication by Decker et al. underlines the limiting component hypothesis (37), which suggests that protein accumulation at the centrosome occurs if the concentration of free subunits reaches a certain limit and that the aggregate shrinks if it is lower than the threshold. Additionally to that, Adams and Kilmartin (12) found that Spc42-mRNA is highest in G2 phase and before cytokinesis. If this holds true, despite the inaccuracy of mRNA to protein level correlation, then the concentration of free Spc42 subunits would decrease throughout late mitosis and G1 phase, which would lead to shrinkage of the SPB in mothers. However, it is unclear why the SPB in the daughter cell does not change in size during anaphase although bud size increases rapidly during and after anaphase (38). To elucidate the fate of the SPBbud in the light of the limiting component model, it is necessary to determine subunit levels in mothers and daughters separately.
A potential shortcoming of our approach is to compare cells that were arrested by nutrient depletion at different cell cycle phases instead of following individual cells by live cell imaging. As the SPB duplication plaque is already formed early during the cell cycle (10), it is possible that cells that are in G1 phase when being released from post-diauxic shift have a different mother to bud SPB size in comparison to cells whose duplication plaque has already been formed at the moment of release. This could also explain why we observe brighter Spc42-GFP spots in SPBmother compared to SPBbud at early anaphase. To proof this effect it is inevitable to follow centrosome growth by live-cell imaging.
Despite of that, it is notable that it is specifically old material that is removed from SPBmother while SPBbud is not affected by changes in new to old protein ratios. Even if the amount of old components in SPBmother is artificially high, this suggests that protein age is a crucial factor for turnover in yeast centrosomes.
Effects of replicative age on old to new component ratios
By measuring the changes of yEGFP tagged Spc42 in both mother and daughter centrosome, we found a clustered group of SPBmother outliers with very low signal intensities. We hypothesised that this group might consist of particularly old cells. To test this, we stained Spc42-yEGPF samples with Calcofluor White, a widely used fluorescent marker for chitin fibres that are especially present in bud scars (24). To obtain a continues value for age, we implemented a tool in our CellProfiler pipeline that detected bright Calcofluor White spots and determined a coefficient of scar membrane coverage. This readout correlated well with manual classification of replicative age. With that, we found a significant increase of SPBbud signal intensities. This suggests that offspring of old cells is morphologically different from daughters of virgin and young cells. In general, this observation could have at least two explanations. Either the causing size regulatory step does not work as well in aged cells or an increased size is necessary to obtain a higher microtubule nucleation capacity. It would be interesting to analyse if and how the increased size of SPBbud is resolved during further cell division of the virgin bud cell. However, we might overestimate the effect on SPBbud or miss size changes of SPBmother with our small and not normally distributed dataset. Thus, the applied methodology has to be improved to draw statistically valid conclusions. Moreover, we found a significant correlation between SPB distance, which we used as readout for cell cycle phase, and scar coverage. This could be due to the fact that the mean cell volume increases with age (39), which has been found to positively correlate with mitotic spindle length in Xenopus laevis oocytes (40, 41). Thus, distance of SPBs as a proxy for cell cycle phase has to be normalized to cellular age to exclude that the observed trend is not confounded by the decrease of old components in SPBmother described in the previous section. To validate this empirical observation, old cells could be enriched and Spc42-yEGFP signal intensities could be compared with a young population.
Concluding remarks
Centrosomes are a central component during mitosis to correctly apportion genetic material to the two daughter cells. An aberrant number of chromosomes in cells, termed aneuploidy, is a central hallmark of cancer and about 90% of all solid tumours are aneuploid (42). Centrosomes may play a major role in that failure, as extra centrosomes in mammalian tissue cell cultures could be directly linked to chromosome missegregation during cell division (43). This was also found in a Drosophila model, but the effect was limited to asymmetrically dividing neuroblasts and was not observed in symmetrically dividing cells (44). This underlies
the importance of asymmetric centrosome inheritance in stem cells. The implications of centrosome failures on cancer formation also highlight the necessity to understand the duplication cycle of centrosomes and the maintenance machinery in great detail to identify potential disease causing mutations. This study contributes to the field by developing a pipeline that is suitable for high-throughput screening of centrosome asymmetries in budding yeast cells. As several components of the yeast spindle pole body are conserved in higher eukaryotes, it is likely that genes affecting spindle pole asymmetry also have regulatory functions in other species. In order to understand the simpler yeast model better to be able to draw conclusions on the more complex bicentriolar centrosome, we studied asymmetries of several SPB components whose inheritance pattern had been previously unknown. By finding asymmetries in Nud1, the yeast homologue of the human centrosome component centriolin (45), we add an interesting argument to the discussion about the cues and the machinery that guide the two differentially aged SPBs specifically to mother or daughter cell. In addition to that, our pipeline revealed size asymmetries during anaphase which can have implications on the fate of ageing cells.
Therefore, our methodology and our findings contribute towards the debate on how cellular asymmetries are established. Bearing the limitations of the model in mind, studies on the budding yeast spindle pole body will help to understand the significance of asymmetric stem cell division and its failure in tumour aneuploidy.
ACKNOWLEDGMENTS
Thank you, Victoria, for a very exciting time, stimulating and controversial discussion, your help and input and for all the numerous things that I could learn. You are a great supervisor!
Alex, for great discussions from “pipeline to pipeline”, your support and patience. Good luck
with your PhD! Sylvie Le Guyader for input on the pipeline. Karl Ekwall for allowing me to work in the laboratory of your group. The whole KEK group for a great working atmosphere, exciting Monday talks and all your help. Uta for your accurate dissection of my methods and the huge motivation that you give me every day.
This study was performed at the Live Cell Imaging unit/Nikon Centre of Excellence, Department of Biosciences and Nutrition, Karolinska Institutet, Huddinge, Sweden, supported by grants from the Knut and Alice Wallenberg Foundation, the Swedish Research Council, the Centre for Innovative Medicine and the Jonasson donation to the School of Technology and Health, Kungliga Tekniska Högskolan, Huddinge, Sweden.
REFERENCES
1. J. Fu, I. M. Hagan, D. M. Glover, The centrosome and its duplication cycle, Cold Spring Harbor perspectives in medicine. 5, a015800 (2015).
2. L. Pelletier, Y. M. Yamashita, Centrosome asymmetry and inheritance during animal development, Current Opinion in Cell Biology. 24, 541–546 (2012).
3. C. T. Anderson, T. Stearns, Centriole age underlies asynchronous primary cilium growth in mammalian cells, Current biology. 19, 1498–1502 (2009).
4. E. Rebollo et al., Functionally unequal centrosomes drive spindle orientation in asymmetrically dividing Drosophila neural stem cells, Dev. cell. 12, 467–474 (2007). 5. J. Januschke, S. Llamazares, J. Reina, C. Gonzalez, Drosophila neuroblasts retain the
daughter centrosome, Nature communications. 2, 243 (2011).
6. P. Conduit, J. Raff, Cnn dynamics drive centrosome size asymmetry to ensure daughter centriole retention in Drosophila neuroblasts, Current biology. 20, 2187–2192 (2010). 7. Y. M. Yamashita, A. P. Mahowald, J. R. Perlin, M. T. Fuller, Asymmetric inheritance of
mother versus daughter centrosome in stem cell division, Science. 315, 518–521 (2007). 8. X. Wang et al., Asymmetric centrosome inheritance maintains neural progenitors in the
neocortex, Nature. 461, 947–955 (2009).
9. T.-C. Lin et al., Targeting of γ-tubulin complexes to microtubule organizing centers: conservation and divergence, Trends in cell biology. 25, 296–307 (2015).
10. M. Winey, K. Bloom, Mitotic spindle form and function, Genetics. 190, 1197–1224 (2012).
11. E. Bullitt, M. P. Rout, J. V. Kilmartin, C. W. Akey, The Yeast Spindle Pole Body Is Assembled around a Central Crystal of Spc42p, Cell. 89, 1077–1086 (1997).
12. I. R. Adams, J. V. Kilmartin, Localization of core spindle pole body (SPB) components during SPB duplication in Saccharomyces cerevisiae, The Journal of cell biology. 145, 809–823 (1999).
13. M. A. Juanes et al., Spindle pole body history intrinsically links pole identity with asymmetric fate in budding yeast, Current biology. 23, 1310–1319 (2013).
14. G. Pereira, T. U. Tanaka, K. Nasmyth, E. Schiebel, Modes of spindle pole body
inheritance and segregation of the Bfa1p-Bub2p checkpoint protein complex, The EMBO journal. 20, 6359–6370 (2001).
15. T. J. Yoder, C. G. Pearson, K. Bloom, T. N. Davis, The Saccharomyces cerevisiae spindle pole body is a dynamic structure, Molecular biology of the cell. 14, 3494–3505 (2003).
16. V. Menendez-Benito et al., Spatiotemporal analysis of organelle and macromolecular complex inheritance, Proceedings of the National Academy of Sciences of the United States of America. 110, 175–180 (2013).
17. K. F. Verzijlbergen et al., Recombination-induced tag exchange to track old and new proteins, Proceedings of the National Academy of Sciences. 107, 64–68 (2010).
18. M. Knop et al., Epitope tagging of yeast genes using a PCR-based strategy: more tags and improved practical routines, Yeast (Chichester, England). 15, 963–972 (1999),
doi:10.1002/(SICI)1097-0061(199907)15:10B<963::AID-YEA399>3.0.CO;2-W. 19. M. Lõoke, K. Kristjuhan, A. Kristjuhan, Extraction of genomic DNA from yeasts for
PCR-based applications, BioTechniques. 50, 325–328 (2011).
20. A. E. Carpenter et al., CellProfiler: image analysis software for identifying and quantifying cell phenotypes, Genome biology. 7, R100 (2006).
21. R Core Team, R: A Language and Environment for Statistical Computing (2015) (available at http://www.R-project.org/).
22. Brian G. Peterson and Peter Carl, PerformanceAnalytics: Econometric tools for performance and risk analysis (available at
http://CRAN.R-project.org/package=PerformanceAnalytics).
23. Aaron Eklund, beeswarm: The Bee Swarm Plot, an Alternative to Stripchart (available at http://CRAN.R-project.org/package=beeswarm).
24. M. V. Elorza, H. Rico, R. Sentandreu, Calcofluor white alters the assembly of chitin fibrils in Saccharomyces cerevisiae and Candida albicans cells, Journal of general microbiology.
129, 1577–1582 (1983).
25. R. A. Neumuller, J. A. Knoblich, Dividing cellular asymmetry: asymmetric cell division and its implications for stem cells and cancer, Genes & Development. 23, 2675–2699 (2009).
26. S.L. Jaspersen, M. Winey, The budding yeast spindle pole body: structure, duplication, and function, Annual review of cell and developmental biology. 20, 1-28 (2004).
27. B. M. Lange, K. Gull, Structure and function of the centriole in animal cells: progress and questions, Trends in cell biology. 6, 348–352 (1996).
28. S. Ghaemmaghami et al., Global analysis of protein expression in yeast, Nature. 425, 737–741 (2003).
29. J. K. Moore, S. D'Silva, R. K. Miller, The CLIP-170 homologue Bik1p promotes the phosphorylation and asymmetric localization of Kar9p, Molecular biology of the cell. 17, 178–191 (2006).
30. M. Hotz et al., Spindle pole bodies exploit the mitotic exit network in metaphase to drive their age-dependent segregation, Cell. 148, 958–972 (2012).
31. J. M. Rock et al., Activation of the yeast Hippo pathway by phosphorylation-dependent assembly of signaling complexes, Science (New York, N.Y.). 340, 871–875 (2013). 32. D. Liakopoulos et al., Asymmetric loading of Kar9 onto spindle poles and microtubules
ensures proper spindle alignment, Cell. 112, 561–574 (2003).
33. F. D. Smith, J. D. Scott, Scaffolding proteins: not such innocent bystanders, Current biology. 23, R515-7 (2013)
34. K. H. Siller, C. Q. Doe, Spindle orientation during asymmetric cell division, Nat Cell Biol.
11, 365–374 (2009).
35. J. M. Keck et al., A cell cycle phosphoproteome of the yeast centrosome, Science. 332, 1557–1561 (2011).
36. W. F. Marshall, Centrosome Size: Scaling Without Measuring, Current Biology. 21, R594–R596 (2011).
37. M. Decker et al., Limiting amounts of centrosome material set centrosome size in C. elegans embryos, Current biology. 21, 1259–1267 (2011).
38. F. Ferrezuelo et al., The critical size is set at a single-cell level by growth rate to attain homeostasis and adaptation, Nat Comms. 3, 1012 (2012).
39. E. A. Vallen, T. Y. Scherson, T. Roberts, K. van Zee, M. D. Rose, Asymmetric mitotic segregation of the yeast spindle pole body, Cell. 69, 505–515 (1992).
40. J. Hazel et al., Changes in cytoplasmic volume are sufficient to drive spindle scaling, Science (New York, N.Y.). 342, 853–856 (2013).
41. M. C. Good, M. D. Vahey, A. Skandarajah, D. A. Fletcher, R. Heald, Cytoplasmic Volume Modulates Spindle Size During Embryogenesis, Science. 342, 856–860 (2013). 42. Weaver, Beth A A, D. W. Cleveland, Does aneuploidy cause cancer?, Current Opinion in
Cell Biology. 18, 658–667 (2006).
43. N. J. Ganem, S. A. Godinho, D. Pellman, A mechanism linking extra centrosomes to chromosomal instability, Nature. 460, 278–282 (2009).
44. E. Castellanos et al., Centrosome dysfunction in Drosophila neural stem cells causes tumors that are not due to genome instability, Current biology. 18, 1209–1214 (2008). 45. O. Gordon et al., Nud1p, the yeast homolog of Centriolin, regulates spindle pole body
Figure 1: Schematic representation of the SPB core components
Budding yeast divides with a closed mitosis, meaning that the nuclear envelope does not break down during cell division. Therefore, the SPB has to be integrated into the envelope to gain access both to the cytoplasm and the nucleoplasm. It consists of three plaques stacked above each other. The central plaque within the nuclear envelope is formed of a crystalline array of Spc42. It is connected to the outer plaque via long rods of Cnm67 and to the inner plaque through Spc29 and Spc110, which contains a calmodulin domain. On the cytoplasmic side, Cnm67 binds to the γ-tubulin complex via Nud1 and Spc72. These adaptors are not present in the inner plaque and γ-tubulin is directly connected to Spc110. Microtubules are nucleated at Tub4, which forms the γ-tubulin complex together with Spc97 and Spc98. Illustration adopted from (1).
A
Cytoplasm Nucleoplasm Cnm67 Nud1 Spc72 Spc29 Calmodulin Spc110 Central Plaque + Nuclear Envelope Outer Plaque Inner Plaque Tub4 Tub4 Spc98 Spc97 Microtubule Crystalline Spc42 array γ-Tubulin ComplexFigure 2. Components of the yeast centrosome can be tagged with a switchable element.
(A) Scheme of Recombination-Induced Tag Exchange (RITE) assay. (1) The endogenous
open reading frame (ORF) of a SPB protein coding region is tagged with the RITE cassette that consists of spacer (S) and two loxP-sites that flank the first tag (3HA-yEGFP), its terminator (ADHt) and a antibiotics resistance (HygroMX). The cassette ends with the second tag (3T7-mRFP). In stage (1), the yEGFP-tag (blue) is expressed at the C-terminal end of an SPB protein (2), which is integrated into the newly forming SPB (3). The yeast strain further encodes a Cre-recombinase fused to an estrogen-binding domain (CRE-EBD), which is inactively bound to heat-shock protein 90 (HSP90) in the cytoplasm (4). Upon addition of β-estradiol (5), the hormone binds and releases CRE-EBD (6), which is translocated into the nucleus and loops out the region between the two loxP-sites (7). Now, newly synthesised SPB genes are expressed with an RFP fusion tag (orange). This can be used to discriminate new (8) and old (9) SPBs. (B) Spotting of strains with SPB genes fused to a RITE cassette, before (∅) and after (⊕) switch with β-estradiol, after 48 hours at 30°C. NKI5504 is the parental control strain. Spc42-RITE had been established before (16). (C) Evaluation of spontaneous recombination (without β-estradiol) and yield of switched cells (with β-estradiol). Note that switched cells are sensitive to Hygro. Mean of two clones are shown.
0 20 40 60 80 100 Cn m6 7 Nb p 1 Nu d 1 S p c9 7 S p c4 2 % Hy gro -s e nsitiv e c e ll s without β-estradiol with β-estradiol
C
Cnm67-RITE Nbp1-RITE Nud1-RITE Spc97-RITE ∅ β-estradiol ⊕ β-estradiolB
NKI5504 (Ctrl) β-estradiolA
ORF S loxP 3HA-yeGFP ADHt HygroMX loxP 3T7-mRFP ORF S loxP 3T7-mRFPHSP90 HSP90 CRE-EBD ① ① ② ③ ④ ⑤ ⑥ ⑦ ⑧ ⑦
Figure 3. Several SPB components are inherited asymmetrically.
(A) GFP versus RFP asymmetry index of three new RITE strains (Cnm67-, Nud-1 and Spc97-RITE) and the previously published Spc42-RITE (16). An asymmetry index smaller than zero indicates a brighter mother SPB compared to its daughter pair and vice versa. Arrows indicate a significant statistical difference between negative and positive GFP asymmetry indexes (***: p < 0.001, Student’s t-test with null hypothesis μ0=0). No significant RFP differences were detected. Microscope images show channel specific projections of 13 layer z-stacks. “Overlay” indicates the CellProfiler output, whereby the mother cell is circled in red, the cell pair in green and the SPBs in blue. (B) Classification of SPB pair asymmetry according to symmetry of GFP (blue) and RFP (orange) signal distribution in mother cell and bud. A SPB pair is counted as asymmetric if its asymmetry index (refer to text) for GFP or RFP is outside the 99% confidence interval around zero. Violet indicates the asymmetry patterns that were expected according to previously published data (14, 16). The table shows percentages ± SD of three colony means.
Cnm67p 0.9% 1 21.2% 5 11.9% 7 2.7% 4 11.1% 12 31.9% 4 7.7% 5 7.7% 5 4.8% 3 Nud1p 0% 22.6% 5 16.5% 7 0% 8.6% 7 31.4% 9 14.2% 11 0% 6.7% 5 Spc42p 2.2% 3 9.1% 6 7.5% 9 3.7% 3 44% 11 28% 13 1.6% 2 3.0% 2 0% Spc97p 5.1% 2 9.9% 3 10.5% 7 3.6% 4 16.3% 6 35.9% 11 5.1% 2 6.5% 3 7.1% 7
B
A
GFP Asymmetry RF P A s y mme try Cnm67p Nud1p Spc42p Spc97p***
***
***
***
GFP Asymmetry RF P A s y mme try GFP RFP ConA Overlay GFP RFP ConA Overlay GFP RFP ConA Overlay GFP RFP ConA OverlayFigure 4. Mother SPBs loose old Spc42 during anaphase.
(A) Correlation of SPB brightness with SPB distance in pixels (“px”), which is used as an
approximation of cell cycle phase. The absolute, integrated GFP signal was measured on two spc42-yEGFP colonies with total N = 308, the graphs show pooled data of one experiment. p-values and R² refer to the plotted linear model. (B) Illustration of the SPB distance readout.
(C) Comparison of Spc42-GFP brightness of SPBmotherand SPBbud in early anaphase and late anaphase cells. Early anaphase is defined as a SPB distance smaller than the 25%-quartile of all analysed cells, late anaphase larger than the 75%-quartile. (D) Dynamics of old and new components of SPBmotherand SPBbud during spindle pole separation, measured on 65 cells of two spc42-RITE colonies. The black and red dots of the beeplot indicate two different datasets. Given p-values refer linear regression model of SPB distance and signal intensity.
***
Early Anaphase Daughter Mother Daughter Mother Late Anaphase GFP Intensity [A.U.] > GFP Intensity [A.U.] >C
Early Anaphase: SPB Distance 11px Middle Anaphase: SPB Distance 22px Late Anaphase: SPB Distance 26px Spc42p-GFP A647-ConAB
GFPof SPBMother GFPof SPBBud RFPof SPBMother RFPof SPBBud
p=0.032 p=0.004 p=0.132 p=0.013 p=0.382 p=0.018 p=0.523 p=0.012
D
A sy mm etry Ind ex G F P Int ensit y [ A .U.] G F P Int ensit y [ A .U.] Distance of both SPBs [px] SPBMotherSpc42p-GFP p = 6.7 x 10⁻⁶ R² = 0.08 p = 3.9 x 10⁻¹¹ R² = 0.17 p = 0.33 R² ~ 0A
Asymmetry of Spc42p-GFP SPBBudSpc42p-GFPFigure 5. SPB size may correlate with replicative age.
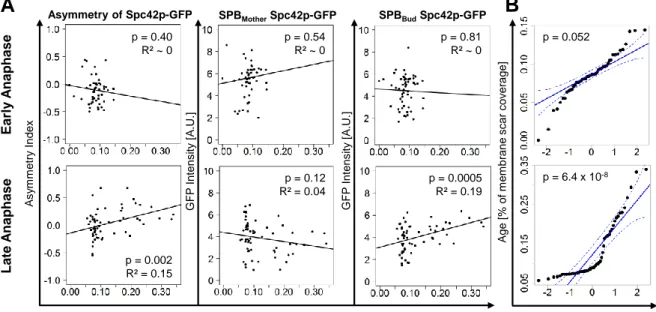
(A) Correlation of SPB brightness with scar coverage in percent for early and late anaphase,
which was used as a proxy for replicative age of cells. The plots are based on pooled data from two biologically independent samples of spc42-yEGFP with n(early anaphase)=56 and n(late anaphase)=60. p-values and R² derive from the fitted linear regression model. (B) Normal Quantile Plot of all scar values in (A). In case of normality, all points should lie on the continuous blue line. The dotted blue lines show the 95%-confidence interval. The p-values refer to the null hypothesis that normality is fulfilled.
Age [% of membrane covered by scars]
A s y m m etry Ind ex G F P In ten s ity [A .U.] G F P In ten s ity [A .U.] E a rly A na phas e La te A na phas e Norm Quantiles p = 0.40 R² ~ 0 p = 0.54 R² ~ 0 p = 0.81 R² ~ 0 p = 0.12 R² = 0.04 p = 0.002 R² = 0.15 p = 0.0005 R² = 0.19 p = 6.4 x 10⁻⁸ p = 0.052
A
B
A ge [% of m em brane s c ar c ov erage] SPBMotherSpc42p-GFP Asymmetry of Spc42p-GFP SPBBudSpc42p-GFPETHICAL REFLECTION
This Master’s degree project presents data on novel asymmetries of several yeast centrosome components and studies the development of the asymmetry during anaphase. The
methodology involved automated imaging and computerised analysis of hundreds of cells. Using yeast as a model poses much fewer ethical considerations on the researcher than higher eukaryotes do, especially pain sensitive mice, rats and apes. Still, on the one hand one could advance the humbleness towards any living object. On the other hand, I think that we don’t ignore singularity of life in itself if we want to study its origins, its mechanisms and its contribution to evolution of the human kind. Thereby, modifying a species is an essential part of understanding the molecular events in a cell and is justifiable as we intend to not spread mutant yeast cell across the borders of the laboratory. Thus, genetic modifications that were introduced do not enter the environment and do not destabilize natural selection.
Consequently, the main argument against this project is not a moral commitment towards yeast cells. It is rather economical considerations and possible implications for human kind that one should reflect upon. Every research study is costly, but the outcome might justify the financial input. Studying budding yeast gives us results that are not of direct use for human beings who pay for it, expect for the joy of knowledge which is mostly limited to researchers. Therefore, should our financial means rather used for experiments with direct outcome for human kind? I think we did not only increase the understanding of yeast biology. Cellular asymmetries are important in a large context – stem cells divide asymmetrically to generate two different daughter cells, tumours divide asymmetrically and worsen the imbalance of genetic material. By understanding the principles of asymmetries in yeast cells, we can start to search for, understand and target their causes more focussed in higher eukaryotes and
mammalian cells. The existence of several conserved proteins in centrosomes from yeast to humans further validates our approach. Thus, by finding new asymmetries in the yeast model, our research might have prevent the usage of a large number of mammalian models.
As each yeast cell can be seen as an organism of its own, variance is fairly high. To address asymmetries of small and dynamic structures like centrosomes, we need fairly large datasets. To decrease human observer bias and save working capacity, we used automated microscopy at the Live Cell Unit core facility in Huddinge. By using common means for researchers, we were saving money, underlining the financial considerations of this project.
SUPPLEMENTARY DATA to the Degree Project of Florian Schober (2015)
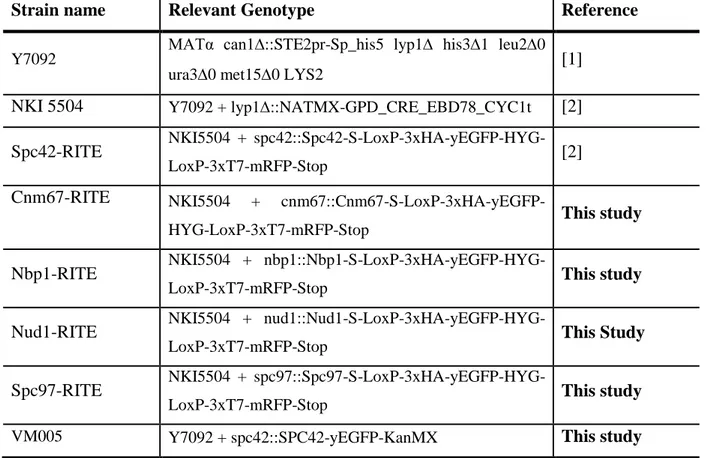
Table S1: Strains used in this study
Strain name Relevant Genotype Reference
Y7092 MATα can1::STE2pr-Sp_his5 lyp1 his31 leu20
ura30 met150 LYS2 [1]
NKI 5504 Y7092 + lyp1::NATMX-GPD_CRE_EBD78_CYC1t [2] Spc42-RITE NKI5504 +
spc42::Spc42-S-LoxP-3xHA-yEGFP-HYG-LoxP-3xT7-mRFP-Stop [2]
Cnm67-RITE NKI5504 +
cnm67::Cnm67-S-LoxP-3xHA-yEGFP-HYG-LoxP-3xT7-mRFP-Stop
This study
Nbp1-RITE NKI5504 +
nbp1::Nbp1-S-LoxP-3xHA-yEGFP-HYG-LoxP-3xT7-mRFP-Stop This study
Nud1-RITE NKI5504 +
nud1::Nud1-S-LoxP-3xHA-yEGFP-HYG-LoxP-3xT7-mRFP-Stop This Study
Spc97-RITE NKI5504 +
spc97::Spc97-S-LoxP-3xHA-yEGFP-HYG-LoxP-3xT7-mRFP-Stop This study
VM005 Y7092 + spc42::SPC42-yEGFP-KanMX This study
Table S2: Plasmid List
Name Content Reference
pKV016 Backbone (AmpR) – Spacer – loxP – yeGFP – TerminatorADH1 – HphMX – loxP – mRFP
[3]
pKT127 pFA6a – link – yEGFP - Kan [4]
Table S3: Primer list
Primer Name Sequence (5’ to 3’)
Cnm67_RITE_fwd GGACCATCTGTATGATCATATCCTGGAGAAGATGGTGAAGG GTGGATCTGGTGGATCT Cnm67_RITE_rev ACAATTACAACAATTTATCTATTGACTCCGTTAATAAAAAAA AGCTTTTAGGCGCCGGTGGAGTGGCG Cnm67_MF TGCTCAACGTCTGCATAGACA Cnm67_DR GCCGCTTAAGCCCTCCAAT
Nbp1_RITE_fwd ACTTTCACCAATCTCAGTGGACTTTTCAAGTTATTTATCTGGT GGATCTGGTGGATCT Nbp1_RITE_rev GCTCCATATATGGAGAATACTTTTAATTTCACAGGAGAAAA AAGCTTTTAGGCGCCGGTGGAGTGGCG Nbp1_MF ACCAGAGATGCAGCCGTTAC Nbp1_DR ACGGCCAAACAGTACAACCA Nud1_RITE_fwd CTGGTTAGATGACACTCCTGCCCCAACTGCCACGAATCTGGG TGGATCTGGTGGATCT Nud1_RITE_rev ACATACATTTTTAGTACTGCGTACGGGTATAGTTATGGGGAA AGCTTTTAGGCGCCGGTGGAGTGGCG Nud1_MF AACCCAATCACGACACCACG Nud1_DR GCGGGGAATCATACCAGCAA Spc97_RITE_fwd TATAGTACCTCCTCGCTCAGCATCTGCTTCTTCCCAAAGAGG TGGATCTGGTGGATCT Spc97_RITE_rev CCGCAAGTTGGTGCACGTCGTTAGTGACATAACGCCGCGTA AAGCTTTTAGGCGCCGGTGGAGTGGCG Spc97_MF AACGCGTCCAGCATTTTTCG Spc97_DR CCACGAAAGTGGGCTTCAGA Spc42_F5 ATGTCAGAAACATTCGCAACTCCCACTCCCAATAATCGAGGT GACGGTGCTGGTTTA Spc42-R3 TTTAAGAATGCGCCATACTCCTTAACTGCTTTTTAAATCATC GATGAATTCGAGCTCG MXTEFI CGAGGCAAGCTAAACAGATC MXTEFII_long TAACGCCGCCATCCAGTGTCGAAAACGAGC
References for Supplementary Tables:
1. Tong, Amy Hin Yan, C. Boone, Synthetic genetic array analysis in Saccharomyces cerevisiae, Methods in molecular biology. 313, 171–192 (2006).
2. V. Menendez-Benito et al., Spatiotemporal analysis of organelle and macromolecular complex inheritance, PNAS. 110, 175–180 (2013).
3. M. Terweij et al., Recombination-Induced Tag Exchange (RITE) Cassette Series to Monitor Protein Dynamics in Saccharomyces cerevisiae, G3 (Bethesda). 3, 1261–1272 (2013).
4. M. A. Sheff, K. S. Thorn, Optimized cassettes for fluorescent protein tagging in Saccharomyces cerevisiae, Yeast. 21, 661–670 (2004).
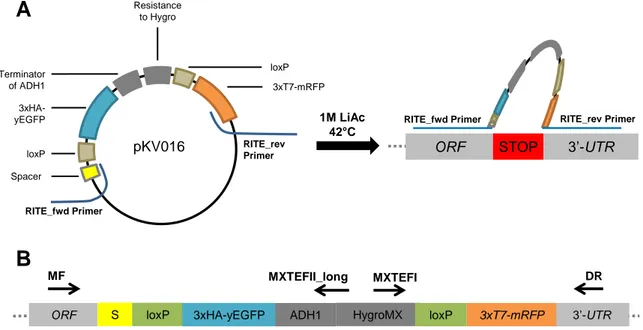
Figure S1 : Overview of construction and validation of yeast strains
(A) Primers were constructed to bind to the upstream and downstream region of the
RITE-cassette on plasmid pKV016. The genetic elements of the RITE RITE-cassette have been described previously in this report (refer to Figure 2A). Both forward primer (RITE_fwd) and reverse primer (RITE_rev) had 5’ overhangs of 40 nucleotides that were homologous to the genomic destination region. After PCR amplification of the cassette including the homologous regions, NKI5504 cells were transformed chemically with 1M Lithium Acetate (LiAc) at heat shock temperature 42°C. On a genomic level, the homologous regions bound exactly before and after the endogenous stop-codon of the target gene and substituted it by the RITE cassette. (B) Binding sites for validation primers (black arrows with primer name above). Correct insertion was verified by PCR and sequencing.
RITE_rev Primer Spacer loxP 3xHA-yEGFP Terminator of ADH1 Resistance to Hygro loxP 3xT7-mRFP RITE_fwd Primer
pKV016 ORF STOP 3’-UTR
1M LiAc
42 C RITE_fwd Primer
RITE_rev Primer
A
B
ORF S loxP 3xHA-yEGFP ADH1 HygroMX 3xT7-mRFP 3’-UTR
MF MXTEFII_long MXTEFI DR
Figure S2: Growth curves of RITE-strains
Strains were grown in liquid YEPD medium and growth was assessed by optical density measurement at 600nm. Strains marked with (+) were grown to post-diauxic phase, before recombination was induced by addition of β-estradiol. (-) indicates identical treatment without addition of β-estradiol. “Old” strains refers to the genotype X-loxP-3xT7-mRFP at the endogenous locus of SPB gene X. These strains were switched about one week before the experiment, but were otherwise treated equally as the other strains without addition of β-estradiol. NKI5504 is the parental control strains. All samples were released by re-suspension in fresh YEPD medium at time point zero.
0 0.2 0.4 0.6 0.8 1 1.2 1.4 0 43 62 93 124 151 185 213 240 273 310 O p tica l Densit y [ A .U.] Time [min] Cnm67 + Cnm67 -Old Cnm67 Nbp1 + Nbp1 -Old Nbp1 Nud1 + Nud1 -Old Nud1 Old Nud1 Spc42 + Spc42 -Spc97 + Spc97 -Old Spc97 NKI5504