DEGREE PROJECT IN
TECHNOLOGY, FIRST CYCLE, 15 CREDITS
STOCKHOLM, SWEDEN 2017
Assessment of the
Electricity Generation
Mix in Ghana
the Potential of Renewable Energy
AMBER AHMED
JINDAN GONG
KTH ROYAL INSTITUTE OF TECHNOLOGY
TRITA -IM-KAND 2017:20
I
Abstract
Electricity is a fundamental part a functioning society. Ghana’s electricity system is strained by an ever-growing climate instability and increase of population. Therefore, it is crucial for the country's development that it's electricity supply is done in a sustainable way.
This report aims to analyze Ghana’s ability to reach SDG 7.1 and the Marrakech Vision, an outcome from the COP 22 meeting in Morocco. This was done by creating a model over Ghana’s electricity system and how it develops over time, called BAU, using the analytical tools:
OSeMOSYS and OnSSET. A practical implementation of BAU was then discussed. After that, three development scenarios with different renewable energy targets for the electricity system, were implemented in the model. The results show that CSP and natural gas power plants were the most prominent electricity producers. The growing share of renewable energy in the target scenarios was mostly due to wind power, replacing the natural gas power plants.
Ghana has local natural gas resources as well as high solar potential. The rising share of renewable energy limits the fossil fuel emission. At the same time, this increased share also endangers the reliability of the electricity supply, as the capacity of renewable energy resources fluctuate and could lead to high investment costs. BAU can be a possible solution which minimizes the fossil fuel consumption and limits the CO2 emissions, but at the risk of possibly having an unreliable electricity supply. To be able to meet SDG 7.1, increasing the share of renewable energy in electricity generation can be a solution, but at the same time, not all requirements of the goal will be fulfilled.
II
Sammanfattning
Elektricitet är en grundläggande del av ett välfungerande samhälle. Ghanas elsystem påfrestas allt mer av skiftande klimat och växande befolkning. Därför är det oumbärligt för landets utveckling att elförsörjningen sker på ett hållbart sätt.
Denna rapport syftar till att undersöka Ghanas förmåga att uppnå SDG 7.1 och Marrakech-visionen, vilken landet förband sig till under COP 22 mötet i Marocko. Detta genomfördes genom att utveckla en modell över Ghanas elsystem och dess utveckling, kallad BAU, med de digitala verktygen: OSeMOSYS och OnSSET. Därefter diskuterades dess genomförbarhet. Fortsatt undersöktes tre utvecklingsscenarier med olika mål för andel förnybar energi i elproduktionen, i modellen. Resultatet visar på att CSP och gaskraftverk var de mest framträdande elproducenterna. En stigande andel förnybar energi utspelade sig som en ökad elproduktion från vindkraftverk och minskad från gaskraftverk.
Ghana besitter naturgastillgångar och hög solpotential. Den stigande andelen förnybar energi begränsar koldioxidutsläppen. Samtidigt kan den ökande andelen förnybar energi sätta pålitligheten i fråga då tillgången till sådan energi fluktuerar, och innebära höga investeringskostnader. Således kan BAU vara genomförbar sett till begränsning av koldioxidutsläpp, men kan eventuellt inte tillhandahålla tillförlitlig eller tillräcklig elektricitet. Att öka andelen förnybara energi i elproduktionen kan förbättra chanserna att nå SDG 7.1 men inte uppfylla målet helt.
III
Acknowledgements
The authors would like to acknowledge all individuals, institutions and organizations that have provided us with support and contributed to this report.
We would like to express our utter gratitude towards Eunice Ramos and Vignesh Sridharan for their great expertise and guidance through the modelling tools, report writing and for always taking time for us. We are also grateful to professor Mark Howells and all the members of KTH-dESA for their support and letting us be a part of this project. Furthermore, we extend our gratitude to all the people at SADA, especially Mr. Charles A. Abugre, Madame Christiana Akpilima-Atibil, Madame Habiba Nantuo, Madame Millie Ashkar and Mr. Erik Ewoh for their generosity and warm hosting. This report has been conducted with the financial support from ÅForsk, KTH Opportunities Fund and any other funding that might be granted after this report is written.
Finally, we would like to thank Hanna Hammarsten and Jenny Fu for sharing this experience with us through thick and thin and making this field study a reality.
IV
Table of Contents
1. Introduction ... 1
2. Aim and objectives ... 2
3. Ghana in context... 3
3.1. Socio-economic background and trends ... 3
3.2. Natural resources and potential ... 3
3.3. The electricity system and electricity access ... 4
3.4. Relevant development policies and initiatives ... 5
4. Methodology ... 6
4.1. The CLEWs framework applied to Ghana case study... 7
4.1.1. OSeMOSYS - Open Source Energy Modelling System and MoManI - Model Management Infrastructure ... 7
4.1.2. OnSSET - Open Source Spatial Electrification Toolkit ... 7
4.2. Model development ... 8
4.2.1. Electricity system with OSeMOSYS ... 8
4.2.1.1. Data collection and refinement ... 9
4.2.2. Household electricity access with OnSSET ... 10
4.3. Target scenarios... 11
4.4. Model integration ... 11
4.5. Main assumptions ... 13
5. Results ... 16
5.1. BAU - The cost optimal solution ... 16
5.2. LRET ... 17
5.3. IRET ... 18
5.4. HRET ... 18
5.4. OnSSET results for scenarios ... 19
5.5. Scenarios comparison with BAU ... 22
6. Discussion ... 24
6.1. BAU - The cost-optimal solution ... 24
6.2. The scenarios’ role towards meeting SDG 7.1 ... 25
6.3. Limitations and future work ... 26
6.4. Source of error ... 27
7. Conclusions ... 28
8. Bibliography ... 29
V
List of Figures
Figure 1: Ghana’s major export products in 2015 (OEC, 2017). ... 3
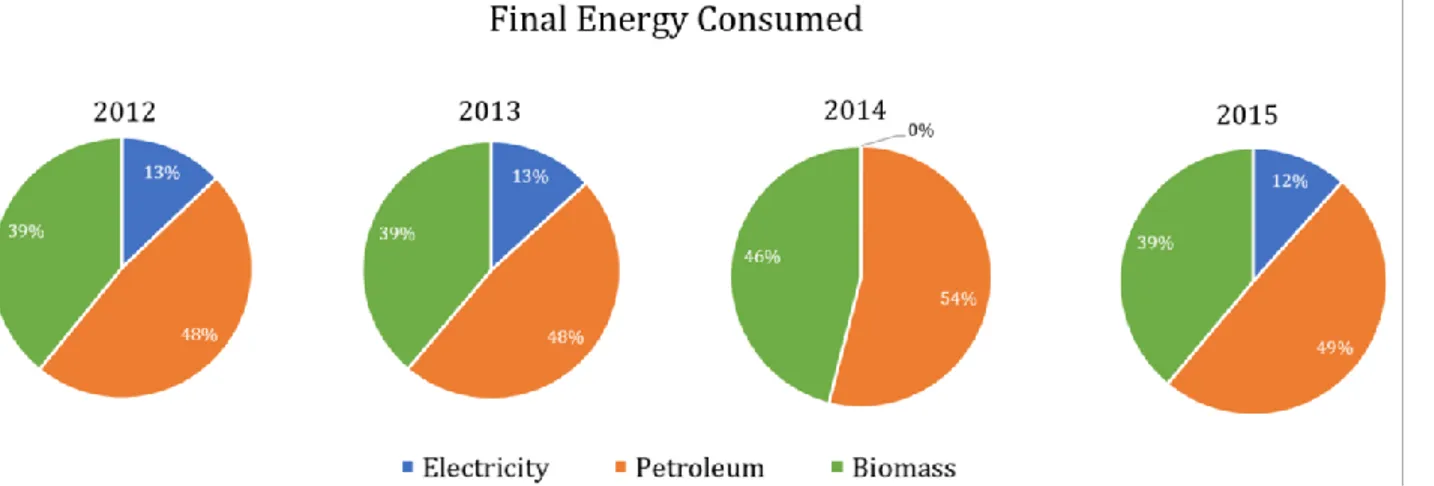
Figure 2:Ghana’s final energy consumption from 2012 to 2015 (Energy Commission of Ghana, 2016b) ... 4
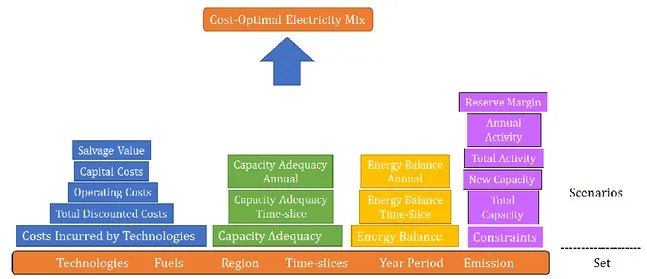
Figure 3: Electricity generation and consumption in Ghana from 2010 to 2015 (Energy Commission of Ghana, 2016b). 5 Figure 4:A diagram that illustrates the modelling tool OSeMOSYS and what it represents (Howells et al., 2011)... 8
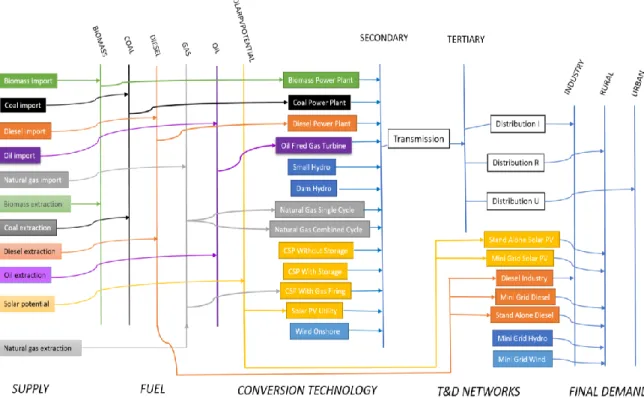
Figure 5:The Reference Energy System diagram of Ghana’s electricity sector. ... 9
Figure 6:A diagram that illustrates the modelling tool OnSSET and what it represents (UN DESA, n.d.-b). ... 10
Figure 7: A diagram that illustrates the integration between the modelling tools OSeMOSYS and OnSSET. ... 12
Figure 8:Annual production by each technology in PJ in the BAU cost-optimal solution. The graph only considers technologies that will generate electricity in the modelling period. ... 17
Figure 9:Annual production by each technology in PJ in the LRET cost-optimal solution. The graph only considers technologies that will generate electricity in the modelling period. ... 17
Figure 10:Annual production by each technology in PJ in the IRET cost-optimal solution. The graph only considers technologies that will generate electricity in the modelling period. ... 18
Figure 11:Annual production by each technology in PJ in the HRET cost-optimal solution. The graph only considers technologies that will generate electricity in the modelling period. ... 18
Figure 12:Mapped Results for the BAU scenario. A spatial visualization of the optimal technology split to the left. To the right is a spatial visualization of the LCOE for the optimal technology split in Ghana. ... 20
Figure 13:Mapped Results for the LRET scenario. A spatial visualization of the optimal technology split to the left. To the right is a spatial visualization of the LCOE for the optimal technology split in Ghana. ... 20
Figure 14: Mapped Results for the IRET scenario. A spatial visualization of the optimal technology split to the left. To the right is a spatial visualization of the LCOE for the optimal technology split in Ghana. ... 21
Figure 15:Mapped Results for the HRET scenario. A spatial visualization of the optimal technology split to the left. To the right is a spatial visualization of the LCOE for the optimal technology split in Ghana. ... 21
List of Appendix Figures
Figure A1:A map over the annual direct normal solar radiation in Ghana (SADA, 2016). ... 34Figure A2:A map over wind power classification of Ghana (NREL, 2010). ... 35
VI
List of Tables
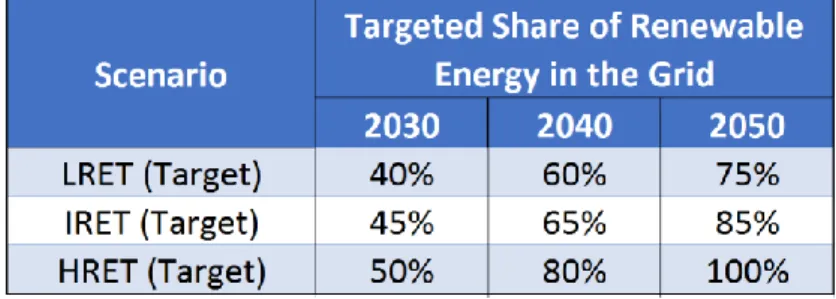
Table 1. The targeted share of grid electricity provided by RE, BAU is shown as a reference. ... 11
Table 2.Registered and projected fossil fuel prices in Ghana (Energy Commission of Ghana, 2016a; IRENA, 2013)… 14
Table 3.List of operational and planned hydropower plants in Ghana and their capacities (S&P Global Platts, 2017). 14
Table 4.Ghana’s RE Targets as a part of the Renewable Energy Master Plan (Energy Commission of Ghana, 2016c). 15
Table 5.The resulting optimal electrification split in order to electrify the new connection in OnSSET. ... 19
Table 6.The resulted share of RE in the grid for each scenario in comparison to the set targets. ... 22
Table 7.The total production for the whole modelling period by each technology in PJ. All scenarios and technologies are represented. ... 23
List of Appendix Tables
Table A1.Used input values for the Ghana OnSSET model after harmonization with OSeMOSYS, developed by KTH-dESA. ... 37
VII
Acronyms and abbreviations
BAU Business As UsualCLEWs Climate, Land, Energy and Water strategies COP 22 22nd Conference of Parties
CSP Concentrated Solar Power CVF Climate Vulnerable Forum GDP Gross Domestic Product HRET High Renewable Energy Target IRET Intermediate Renewable Energy Target KTH The Royal Institute of Technology
KTH-dESA KTH division of Energy Systems Analysis LCOE Levelized Cost Of Electricity
LRET Low Renewable Energy Target MDGs Millennium Development Goals MoManI Model Management Infrastructure NREL National Renewable Energy Laboratory OnSSET Open Source Spatial Electrification Toolkit OSeMOSYS Open Source Energy Modelling System
RE Renewable Energy
RES Reference Energy System SDGs Sustainable Development Goals SE4ALL Sustainable Energy for All Solar PV Solar Photovoltaic
TEMBA The Electricity Model Base For Africa
UNECA United Nations Economic Commission for Africa
UN DESA United Nations Department of Economic and Social Affairs WAGP West African Gas Pipeline
1
1. Introduction
Energy is the foundation of a functioning society. Without it there would be no lighting, warmth or transport. With a growing population worldwide and increasing living standards many countries are struggling to provide sufficient amount of energy needed in a sustainable manner. This strain is more evident in developing countries, affected by an ever-growing climate instability (Vidal, 2013). Ghana used to solely rely on hydropower for its electricity production in the year 1966. But with the harsh drought in the year 1983, Ghana had to implement thermal power generation as a complement. Future electricity generation prognosis show that it will be progressively more fossil fuel based. However, with the negative environmental impact as well as the fluctuation of fuel cost such a course is too unreliable (Awoponea et al., 2017).
Several initiatives have begun tackling this problem, beginning with the Millennium Development Goals (MDGs) which are in total 8 goals that world leaders together decided upon to reach year 2015. The MDGs’ target was for example to eradicate extreme hunger and ensure environmental sustainability (UN Millennium Project, 2006). These were later succeeded by United Nation’s Sustainable Development Goals (SDGs), which are 17 goals and aims to completely end
worldwide hunger, ensure affordable energy for all among several other sustainable developments. These goals are aimed to be fulfilled year 2030 (UNDP, n.d.-a). Another such initiative is
“Sustainable Energy For all” (SE4ALL) where the goal is to give universal access to energy by 2030 (Nerini et al., 2016). These initiatives challenges countries to include sustainable
development as part of their resource planning process. This concerns Ghana’s energy system as well, but to do so, it is necessary to have the analytical capacity to assess a country's energy, land and water use and to find the most cost-effective solution.
For this purpose, the Royal Institute of Technology's division of Energy Systems Analysis (KTH-dESA) has been collaborating with the United Nations Department of Economic and Social Affairs (UN DESA). Together they are working on the development of Climate, Land use (Food), Energy and Water strategies (CLEWs) assessments in developing countries, with the direct engagement of governmental authorities.
2
2. Aim and objectives
The aim of this project is to produce an initial screening of the energy sector in Ghana, emphasizing on the analysis of the electricity sector and the ability to meet SDG 7.1 and the Climate Vulnerable Forum's (CVF) Marrakech Vision. The analysis is aimed to provide a better understanding of the development challenges in Ghana from an integrated resource management perspective.
The objective of the project is to develop a model of the electricity system. The initial model will be a cost optimal Business As Usual (BAU) development scenario of the electricity system. From this, the practical implementation of the model will be discussed from a resources, reliability, and sustainability perspective. Furthermore, three development scenarios will be created based on the BAU model. The resulting scenarios on how to electrify Ghana will be examined and compared with one another.
To fulfil the purpose of the project, the thesis will strive to answer the research questions:
- Is the BAU scenario implementable as Ghana’s future electricity system, from a resources, reliability and sustainability perspective?
- Acknowledging Ghana’s commitment to the Marrakech Vision, how would an increased share of renewable energy affect the ability to ensure universal access to affordable, reliable and modern electricity, as a part of achieving SDG 7.1?
3
3. Ghana in context
The Republic of Ghana, formerly known as the Gold Coast, was one of the first African countries to gain independence in 1957 and is considered a very stable democratic and economic state in Africa (UNDP, n.d.-b). Located in West Africa, Ghana has an area of 238 533 m2. The capital, Accra, lies in the south of Ghana which is covered in grasslands and shrublands (Utrikespolitiska Institutionen, 2016) whereas the northern area is mostly covered in savannah (SADA, n.d.). The following section is written to provide background information on Ghana, focused on areas relevant to the electricity sector.
3.1. Socio-economic background and trends
In 2015, Ghana’s population reached 27.4 million people (World Bank, n.d.-a) with an annual population growth rate of 2.3% (World Bank, n.d.-b). Despite the low productivity due to slow technical advances and droughts, agriculture is a key economic sector for Ghana and employs around half of the country’s labor force (FAO, 2014). In 2015, the nation’s exports of 10.5 billion USD made up 28% of the nation’s Gross Domestic Product (GDP) (OEC, 2017). The main export products; oil, gold and cocoa products have come to boost the country’s economy for it to enter the status of middle-income countries (UNDP, n.d.-b). The major export products can be seen in Figure 1. Even though Ghana as a whole has halved its poverty figures, is still a great challenge, especially in the northern area (SADA, n.d.).
Figure 1: Ghana’s major export products in 2015 (OEC, 2017).
3.2. Natural resources and potential
Ghana is in possession of great natural resources. The water and land resources holds high potential for a sustainable development of Ghana, if managed in a sustainable manner. The Volta river system basin is covering 70% of Ghana's land area. The remaining 30% is covered by the southwestern and coastal river system. Even though there are plentiful water resources, there is still a problem with scarcity, with a supply coverage of 50-60% in rural and urban communities (Ghana National Commission for UNESCO, 2009/2010). In 2014, around 30% of the country’s total land area was cultivated (FAO, 2016), which leaves about half of the agricultural-potential land area unused. Ghana’s various agro-ecological zones allows for a wide range of crops to be grown. Yams, cassava, plantain and cocoa beans are the commodities with the highest production quantities and values (FAO, 2014).
4
As of today, Ghana has domestic supply of natural gas, crude oil and biomass. To meet the energy demand, import of additional natural gas and oil is necessary. A majority of the heavy fuel oil, light crude oil and diesel, used in thermal power plants, are procured from Nigeria. Primary import fuel is coal as there are no such reserves in Ghana. Ghana’s two main natural gas sources are imports from Nigeria via the West African Gas Pipeline (WAGP) and a local supply from Atuabo in the offshore Jubilee fields. In 2015, the total natural gas flow had almost doubled from the year before. The supply from Atuabo rose from contributing 4.6% of the total gas flow in 2014 to 56% of the total gas flow in 2015 (Energy Commission of Ghana, 2016a). The electricity sector is the major consumer category of natural gas, covering 80% of the natural gas demand (Ministry of Petroleum, 2015).
There are abundant resources for renewable electricity generation in Ghana. The largest potential lies in solar power and wind power, as most of the large-scale hydropower potential is utilized. A map of the annual direct solar radiation in Ghana can be seen in Figure A1 in Appendix. Ghana has a monthly average solar irradiation of 4.4-5.6 kWh/m2/day. The most favorable conditions for solar energy lies in the north with monthly solar irradiation of 4-6.5 kWh/ m2 / day (IRENA, 2015). IRENA (2015) estimates the technical potential for wind power to be more than 5000 MW. Ghana’s wind streams reach a monthly average speed of 4.8-5.5 m/s at 12 meters’ height. This exceeds the general limit of 4 m/s for wind power technology to be feasible (Park, Schäfer, & Richards, 2009). A map of the wind speeds across the country can be seen in Figure A2 in
Appendix. The areas with high wind speed have the potential for installing wind power. According to the National Renewable Energy Laboratory (NREL) the most prominent areas for wind energy are near the border to Togo and on elevations between 6° to 8° latitude (NREL, 2014).
3.3. The electricity system and electricity access
In 2014, around 72% of Ghana's population had access to electricity (IEA, 2016). The prospect of the electricity demand is expected to grow by 10-15% each year due to population growth and growing incomes (Eshun & Amoako-Tuffour, 2016). According to the Energy Commission of Ghana (2016b), the electricity demand made up about 12% of the final energy consumption in 2015, the smallest consumer category amongst petroleum and biomass (shown in Figure 2).
5
The electricity generation was dominated by hydropower and thermal power plants and was mainly consumed by the industrial and the residential sector in 2015, see Figure 3 (Energy Commission of Ghana, 2016b). The most electricity intensive industries include aluminum smelting, mining and manufacturing (CEPA, 2002).
Figure 3: Electricity generation and consumption in Ghana from 2010 to 2015 (Energy Commission of Ghana, 2016b).
The electrification access has improved by expanding the grid connections but expanding the transmission and distribution network has also restricted its capacity (Energy Commission of Ghana, 2006). Inefficient and unreliable access to electricity has hindered the economic
development in Ghana (Energy Commission 2016a). A map of the 2014 grid network of Ghana can be seen in Figure A3 in Appendix.
3.4. Relevant development policies and initiatives
Ghana has taken many initiatives to improve their energy and electricity sector. One of Ghana’s target is to have universal access to electricity by 2020, where 30% of the rural area is to be electrified by decentralized renewable energy (RE) (Energy Commission of Ghana, 2006). To reach the nation’s energy related goals, Ghana has initiated several institutional frameworks. The Ghana SE4ALL Action Plan from 2013 has the main objectives to ensure access to modern energy for rural communities (Energy Commission of Ghana, 2012). The National Energy Policy and the Energy Sector Strategic Development Plan are two institutional frameworks, aiming to facilitate access to high quality, sustainable energy and utilization of RE technologies (IRENA, 2015; Energy Commission of Ghana, 2006)
The two initiatives forming the basis of this study are Ghana’s commitment to the CVF Marrakech Vision and to SDG 7. In the 22nd Conference of Parties (COP 22) in Marrakech, Ghana together with 48 developing countries vulnerable to climate change, agreed on the CVF Marrakech Vision. The Marrakech Vision aims to take actions against climate change and to reduce the impact of climate change on livelihoods, infrastructure, cultures and ecosystems. One action to realize this vision is to strive for a 100% share of domestic RE production by latest 2050. The pledge of the Marrakech Vision was an action to realize the Paris Agreement of net carbon neutrality by 2050 (CVF, 2016). SDG 7 was adopted by Ghana during the 2015 Sustainable Development Summit (United Nations in Ghana, n.d.). The sub-target 7.1 which aims to “Ensure universal access to affordable, reliable and modern energy services till the year 2030” (IAEG-SDGs, 2017, p.10) is the most relevant for this study. The dimensions of affordable, reliable and modern overlap each other and consists of several sub-dimensions. The requirements to meet the 7.1 sub-target are thereby vaguely defined as they depend on the country’s current state (Wu, 2014).
6
4. Methodology
The approach of this assessment was to study Ghana’s electricity system by following the CLEWs framework. This was done by developing a model of the electricity system and examining its development under different conditions. The model was developed with the use of the analytical tools Open Source Energy Modelling System (OSeMOSYS) and Open Source Spatial
7
4.1. The CLEWs framework applied to Ghana case study”. An initial model was developed using The Electricity Model Base for Africa (TEMBA) database provided by KTH-dESA, explained in sub-section 4.2.1.1. Data collection and refinement”. This was then refined with collected and calculated data more relevant to the case study of Ghana. The quantitative approach was supplemented with a qualitative study as a part of the refinement process. The refined model represented a BAU scenario. Based on the results from BAU, three target scenarios were created with rising RE goals. The different scenarios can be summarized as:
- BAU described the reference case when the electricity sector was expected to follow the development according to TEMBA
- The Low Renewable Energy Target (LRET) scenario had an electricity production target of 75% RE in the year 2050
- The Intermediate Renewable Energy Target (IRET) scenario had an electricity production target of 85% RE in the year 2050
- The High Renewable Energy Target (HRET) scenario had an electricity production target of 100% RE in the year 2050.
The results from OSeMOSYS and OnSSET were exchanged between the tools in an iterative process until a converging cost-optimal solution was reached. This was repeated for each scenario. The resulting cost-optimal solution from each scenario was visualized as graphs showing the production by each technology on an annual basis and as maps over the technology split and the Levelized Cost Of Electricity (LCOE). An assessment of the BAU solution and its implementation followed. The results from each scenario were then compared to each other and similarities and differences were identified. An analysis of the scenarios’ ability to ensure universal access to affordable, reliable and modern electricity followed. As were the scenarios’ realization of the Marrakech Vision of 100% domestic RE production by 2050.
8
4.1. The CLEWs framework applied to Ghana case study
The CLEWs is a framework for efficient resource management. Land, energy and water resources are very valuable and highly interdependent. The use of such resources is vital for the development from both an economic and sustainability perspective. At the same time, exploitation of these resources can also have a great impact on natural systems, such as affecting the concentration of greenhouse gases in the atmosphere which are directly linked to climate change. Changes in climate can, in return, also harm the natural systems that provide these fundamental resources. Because of these close connections between the climate and land, energy and water resources, it is necessary for an integrated assessment to have a sustainable usage of such resources. CLEWs complements single-resource modelling tools by also investigating the interactions between the resource sectors to identify pressure points and synergies. In this way, CLEWs takes the
development of resource management policies into consideration. Such an assessment strategy is of importance for policy-making and an efficient use of resources (Howells et al., 2013).
The impact of climate change in Ghana will become even more evident in all six agro-ecological zones. The most significant consequences from climate change will play out as it alters in the rainfall patterns, sea level, temperature and frequency of extreme weathers. Exposure to weather extremes such as flood, droughts and high temperatures are all climate challenges for Ghana, entailing serious consequences for the predominantly rain-fed agriculture and the capacity of hydropower dams (UNEP & UNDP, 2012). Amidst these effects of a changing climate, the linkages between the climate and land, energy and water resource systems are exposed to even more strain. Utilizing these resources in a sustainable manner will play an important role for a sustainable development of the country.
4.1.1. OSeMOSYS - Open Source Energy Modelling System and MoManI - Model
Management Infrastructure
OSeMOSYS is a tool used for modelling energy systems and visualizing the results of sustainable development strategies. It is used for energy planning and has a wide-range usage, from continents to small villages (OSeMOSYS, n.d.). MoManI is an interface to facilitate the use of OSeMOSYS developed by KTH-dESA together with UN DESA. The tools can also be used to explore different scenarios based on the challenges identified in the focus area. These scenarios can then be
compared to analyze technology and energy requirements, social costs and environmental impacts so that the area can reach its development goals in the most effective way. Together with MoManI, OSeMOSYS can therefore be a useful tool for energy planning and energy policy analysis (UN DESA, n.d.-a).
4.1.2. OnSSET - Open Source Spatial Electrification Toolkit
OnSSET is a toolkit developed by KTH-dESA (KTH-dESA, 2016). It is designed to be used for energy research and policy planning. OnSSET targets 100% electrification of households in 2030 to be supplied with modern, reliable and affordable energy, which is a part of achieving SDG 7. The model uses geospatial data to make assessments of the household electricity demand, how it is diffused in the country and identifies the resources availability to see how to meet the demand in the most cost-effective way. The solution will be a mixture of standalone, mini-grid and grid-based technologies, from both renewable and conventional energy sources. The result is visualized on a map of the country (Mentis et al., 2015).
9
4.2. Model development
The electricity system model was an essential part to fulfil the purpose of the thesis. What follows describes the modelling process, how it was developed, refined and how the explored development scenarios were defined.
4.2.1.
Electricity system with OSeMOSYS
OSeMOSYS has several parameters and sets that needed to be defined for Ghana, where it then found the most cost optimal solution for the electricity generation. Fuels and technologies used in the electricity sector were added to the interface. This included both RE, such as wind, solar, biomass, and hydropower, as well as the fossil fuels: coal, oil, diesel and natural gas. Electricity generating technologies related to these fuels were also added to the model. As the technologies’ performance vary throughout a year, each year was divided into four time slices, to represent the seasonal variations. Namely, the time slices summer day, summer night, winter day and winter night were defined.
Through the parameters, the constraints on the technologies came into play. As many factors affect how the technologies perform, several parameters were defined as constraints in order to
implement conditions for the technologies. Some technologies linked to the fossil fuels were set to produce a certain quantity CO2 emissions as a byproduct. Determinant factors for capacity, efficiency and costs were defined for respective technology and power plants. The capacity was represented using values for minimum and maximum capacity for each power plant, capacity factor and availability factor for each technology. The efficiency of the power plants was defined as the plants’ input and output activity ratios. The cost parameters for each power plant consisted of capital costs, fixed costs and variable costs. Factors dependent on time had also impact on the technologies. Each power plant’s operational life and restrictions for their total annual energy production had to be added to the model in order to make a better representation of the electricity system’s development (Howells et al., 2011). A schematic view of OSeMOSYS can be seen in Figure 4.
10 4.2.1.1. Data collection and refinement
The primary electricity model data was taken from TEMBA. TEMBA, modelled and developed in OSeMOSYS, is the world’s first open-source electricity model of Africa. The development of TEMBA was sponsored by the World Bank and SIDA and is an ongoing project jointly with the United Nations Economic Commission for Africa (UNECA). It represents each African country's electricity supply system as well as the transmissions between countries in good detail. Only data of Ghana’s electricity model was used which shows the current and future demand of the country and electricity producing technologies which are bounded by constraints, such as capacity and operational life. TEMBA differentiates between three types of energy users; already electrified, urban unelectrified and rural unelectrified. These are represented as industry, urban and rural, respectively. As the data spans from year 2010 to 2050, future energy projects are taken into consideration (Taliotis et al., 2016).
As TEMBA is a model for the whole of Africa, the data is generalized for all African countries and does not delve in the details of the energy systems of each country. The model development proceeded from the TEMBA data with more explicit data for Ghana from national documents by the Ghanaian government and reports by local organizations. This included the Energy Outlook and the Renewable Energy Master Plan from the Energy Commission of Ghana, and a list of power plants in Ghana from S&P Global Platts, amongst others. Additional hydropower plants, currently under construction, were included in the list of power generation technologies in the model. The fossil fuel prices were also updated using historic prices in Ghana.
The Reference Energy System (RES) is used as an input for the BAU scenario in the model and can be seen in Figure 5. It is a schematic of the actual electricity system in the country. The lines represent different energy carriers while the boxes represent different technologies. The
abbreviation solar PV stands for solar photovoltaic and the abbreviation CSP stands for Concentrated Solar Power.
11
4.2.2. Household electricity access with OnSSET
OnSSET analyzes the optimal electrification split between the national grid and off-grid
technologies. The off-grid technologies include mini-grid solutions of solar PV, diesel, hydro and wind, as well as standalone solutions of solar PV and diesel. For that parameters for the current electrification split and future demand needed to be defined. The data for the critical input parameters were developed by KTH-dESA and can be seen in
12
Table A1 in Appendix. This data contained size of the population and urban ratio for the years 2015 and 2030, national grid price, electrification status and base to peak ratio amongst others. See
13
Table A1 in Appendix for a list of parameters and input values used.
In addition, there were more adjustable parameters that defined what is to be considered an electrified settlement or not. In order to be considered electrified, the settlement had to either have at least a certain night light intensity or to meet the requirement for minimum population together with minimum distance to roads or to the grid. The adjustable parameters and how they were related, were set so that the modeled electrification rate for 2015 agreed with the actual electrification rate.
All the households were set to reach the third tier of electricity consumption by 2030. The third tier provides approximately 695 kWh for each household every year, which is enough electricity to use washing machines, general food processing and other light appliances, beyond general lighting and television (UN DESA, n.d.-b). OnSSET assumes all electrified settlements in the base year of 2015 to be electrified from the national grid and no off-grid technologies. A schematic view of OnSSET can be seen in Figure 6. The resulting cost-optimal technology split from OnSSET, displayed the number of people connected to the grid and off-grid technologies, respectively, to electrify Ghana in the most cost-optimal way.
Figure 6: A diagram that illustrates the modelling tool OnSSET and what it represents (UN DESA, n.d.-b).
4.3. Target scenarios
Three target scenarios were developed in addition to BAU; LRET, IRET and HRET. These were created with the intention to realize the Marrakech Vision of 100% domestic RE production by 2050. The RE targets for each scenario can be seen in Table 1. All these target scenarios will force renewable technologies connected to the national grid to produce more electricity. With the RE share of the grid generation in BAU as a base, the RE targets were set to gradually increase between each scenario. HRET represented the most effortless way for Ghana to realize the vision
14
but will also require considerable efforts to be reached. Therefore, the LRET and IRET scenarios with lower targets were created. This way, the scenarios were created to image Ghana’s striving to realize the vision.
Table 1. The targeted share of grid electricity provided by RE, BAU is shown as a reference.
4.4. Model integration
To calculate the optimum grid cost solution for electrifying Ghana using the models described above, they needed to be soft-linked. Although both tools analyzed the electricity system, they used different approaches and were therefore required to be connected through specific parameters. The integration was initiated by harmonizing parameters such as discount rates and fuel costs between the models. Off-grid electricity generating technologies were also harmonized between the modelling tools. Technologies for grid solar PV, grid diesel, grid hydro and mini-grid wind were added to the OSeMOSYS model. As were standalone technologies for solar PV and diesel.
The average grid cost for electricity generation was calculated using parameters related to electricity generating technologies from MoManI. The parameters were used in Equation (1) to calculate the grid cost per year.
𝐺𝑟𝑖𝑑 𝑐𝑜𝑠𝑡 𝑝𝑒𝑟 𝑦𝑒𝑎𝑟 =∑ { 𝐴𝑛𝑛𝑢𝑎𝑙𝑖𝑧𝑒𝑑 𝐼𝑛𝑣𝑒𝑠𝑡𝑚𝑒𝑛𝑡 𝐶𝑜𝑠𝑡𝑡 (1+𝑟)𝑡 +𝐷𝑖𝑠𝑐𝑜𝑢𝑛𝑡𝑒𝑑 𝑂𝑝𝑒𝑟𝑎𝑡𝑖𝑛𝑔 𝐶𝑜𝑠𝑡𝑡} 𝑛 𝑡=1 ∑𝑛𝑡=1(𝐴𝑛𝑛𝑢𝑎𝑙 𝑃𝑟𝑜𝑑𝑢𝑐𝑡𝑖𝑜𝑛𝐸𝐿1)(1+𝑟)𝑡 (1)
15 Where,
r – discount rate;
Discounted Operating Cost – Output from OSeMOSYS, compiles fixed and variable costs;
Annual ProductionEL1- Annual electricity generation of the grid before transmission and distribution;
t and n - t being the first technology and n being the last in the list of technologies; and
Annualized Investment Cost – Annual cost of a technology taking into consideration the capital recovery
factor.
The final grid cost was then calculated a weighted cost based on generation. This value was inserted in OnSSET, which then produced the optimal technology split to electrify the households. The split presented how much of the demand that was expected be supplied by the grid and each off-grid technology. Calculations of the split values were implemented in the MoManI model by setting the calculated values as limits for the corresponding technologies’ maximum and minimum generation in the modelling period 2015-2030.
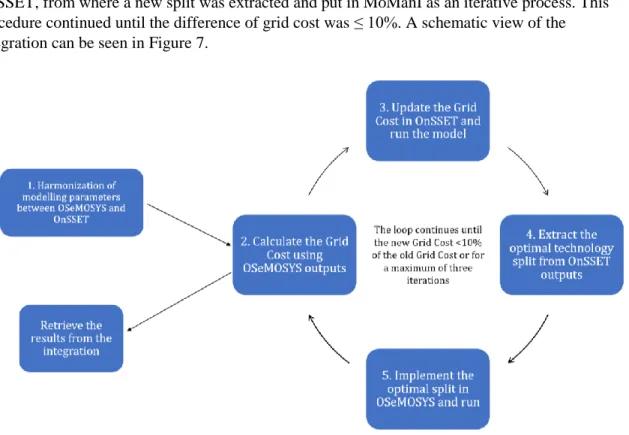
By running MoManI with the updated limits, a new grid cost could be calculated and inserted in OnSSET, from where a new split was extracted and put in MoManI as an iterative process. This procedure continued until the difference of grid cost was ≤ 10%. A schematic view of the integration can be seen in Figure 7.
Figure 7: A diagram that illustrates the integration between the modelling tools OSeMOSYS and OnSSET.
The retrieved results consisted of the cost-optimal electricity generation mix on an annual basis and how it was distributed through the country. The mix included both on-grid and decentralized solutions as well as information about production from each technology.
16
4.5. Main assumptions
For the first research question, regarding implementation of BAU, the resources and reliability perspective were defined as: if the fuel and technology resources available will be sufficient to support the BAU’s solution, and if the technologies are able to generate the amount of electricity as is suggested by the model. The sustainability perspective was defined to consider the share of RE in the electricity system.
To answer the second research question of ensuring universal access to affordable, reliable and modern electricity, two assumptions were made. Reliable electricity was defined as: if the technologies are able to generate the amount of electricity as is suggested by the model. Modern electricity was defined as electricity services signifying a modern society and for the electricity to produce low carbon emissions.
The development of the electricity system model entailed several assumptions, both during the refinement of OSeMOSYS and OnSSET individually and during the integration of the modelling tools. Two main assumptions were:
- to use Ghana's data from TEMBA as the foundation for the OSeMOSYS model; and - to use the input values of 63% urban ratio in 2030, 20% grid losses and others as the
foundation in the OnSSET model. The input values were developed by KTH-dESA and are presented in Table A1 in Appendix.
One assumption regarding TEMBA was to only consider the import and extraction of the fuels: biomass, coal, diesel, oil and natural gas. Thus, trade links with other countries were omitted. Based on the technology representation in TEMBA, heavy fuel oil was assumed to be the only type of oil fuel used by in the model.
During the refinement of the fuel prices, natural gas from the WAGP was assumed to represent all the imported natural gas. Natural gas from Atuabo was assumed to represent all the local gas, as these are considerable natural gas sources in Ghana (Energy Commission of Ghana, 2016a). Fuel prices for natural gas, heavy fuel oil and diesel were assumed to be the same as the historic
measured values, based on the Energy Outlook for Ghana. In the Energy Outlook, no fuel price for coal was registered. Instead, coal price projections from the West African Power Pool: Planning and Prospects for Renewable Energy, were used. All historic and projected fuel prices used in the model can be seen in Table 2. As the fossil fuel prices fluctuate from year to year, the prices were not assumed to follow a linear relationship. Instead, the registered price for a certain year was presumed to remain the same in the following years, where the price was unknown. When the progression reached a year where another price was registered, the assumed fuel price changed accordingly and continued with the same progression.
17
Table 2. Registered and projected fossil fuel prices in Ghana (Energy Commission of Ghana, 2016a; IRENA, 2013).
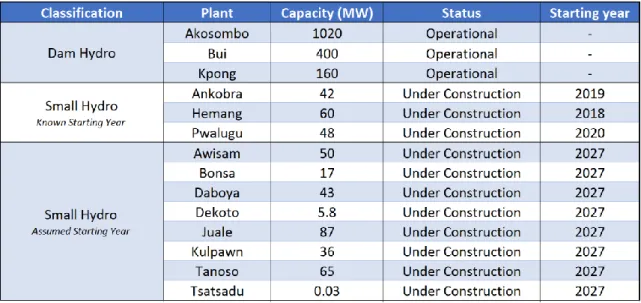
Another assumption was to represent the hydropower plants as separate technologies, in contrast to the rest of the power plant technologies. For the other power plants, the technologies with the same input and output were accumulated as one technology. The hydropower plants that were considered in the model corresponded to the S&P Global Platts list of power plants in Ghana from 2015. Plant specific capacity factors were taken from (Cervigni et al., 2015).
The hydropower plants were divided into two classes; dam hydropower plants and small
hydropower plants. The dam hydropower plants consisted of three operational dams: Akosombo, Bui and Kpong. The three dams were assumed to be able to increase their installed capacity with a maximum of 20% during the modelling period. The small hydropower plants consisted of several power plants that are currently under construction. The plants, Ankobra, Hemang and Pwalugu were assumed to be fully running and able to reach their full capacity in their registered years. For the rest of the small hydropower plants; Awisam, Bonsa, Daboya, Dekoto, Juale, Kulpawn, Tanoso and Tsatsadu, the expected year of start was unknown and assumed to be in 2027. Since the power plants are under construction, capital investments of said plants were forced in the model with respect to their expected time frame. A compilation of the hydropower plants can be seen in Table 3.
18
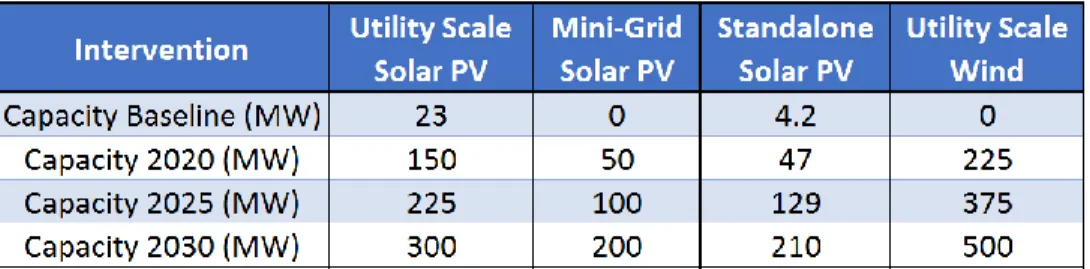
The model was assumed to follow generation targets stated in the Renewable Energy Master Plan of Ghana. Capital investments of the additional capacity needed were not forced into the model. However, the targets were set as the minimum capacity for respective technology. This way, the model itself could choose whether to make the investments needed to utilize the capacity. The targeted capacity for different RE technologies can be seen in Table 4. The baseline capacity was assumed to be the capacity in year 2015.
Table 4. Ghana’s RE Targets as a part of the Renewable Energy Master Plan (Energy Commission of Ghana, 2016c).
As an initiation of the integration between OSeMOSYS and OnSSET, the two tools needed to be harmonized. In this harmonization, the diesel price and electricity demand in 2030 in OnSSET were assumed to be 0.57 USD/liter and 695 kWh/household/year, respectively. The diesel price was set to be the same as the mean variable cost for the diesel extraction and import technologies in OSeMOSYS. The demand on OnSSET was also set to correspond to the demand for 2030 defined in OSeMOSYS. TEMBA expected the quantity of electricity consumption to reach Tier 3 in 2030.
Another assumption made in the integration process was to omit the standalone solar PV
technologies with capacity to store energy. The remaining standalone solar PV technologies were compiled to one technology, assumed to supply electricity to satisfy the rural demand. An analogous compilation was made with the standalone diesel technologies, with exception for the standalone diesel supplying the "industry" consumer. The technology for wind power with 30% capacity factor was also omitted in the model.
19
5. Results
By implementing the constraints, targets and other conditions in OSeMOSYS and OnSSET the modelling tools produced the cost-optimal solutions to electrify Ghana for each scenario. The following section starts by presenting the resulted annual generation mix from MoManI for BAU and the target scenarios. This is followed by showing the technology split between grid and off-grid solutions to electrify Ghana together with the LCOE retrieved from OnSSET. The end of the section contains similarities and differences between the scenarios from comparing the results from each scenario with one another.
5.1. BAU - The cost optimal solution
The first modelled scenario created was the BAU. The results from OSeMOSYS, using MoManI, can be seen in Figure 8. The graph displays the cost-optimal electricity generation mix of
technologies throughout the time frame 2010 to 2050. Seen from the figure, hydropower plays a considerable part in the generation mix in the early years of the modelling period, correlating to national documentations, until 2014, where its production reaches its peak and the thermal power plants increase their production significantly. In the results for year 2017, natural gas power plants become the main electricity producers, oil power plants reduce their production, diesel plants cease to produce and wind power production starts in the generation mix. The natural gas power plants and dam hydro power is joined by considerable electricity generation from coal power plants starting 2020 and from small hydro power starting 2027.
During the modelling period, many technologies increase their production with time but CSP technology increases the most, producing around 357 PJ in the end year 2050. In 2030, the CSP with storage technology starts its production and increases its electricity generation considerably, to become the major source of electricity in 2039. In the overall generation mix for the whole modelling period, natural gas power plants and CSP with storage generates the highest shares making up about 35% each. Coal power plants and dam hydro comes in second contributing with about 9% to the total grid electricity generation, followed by wind power.
The result shows that the RE share resulted in OSeMOSYS does not steadily increase with time. Rather, it starts off with a high percentage since hydropower was the main electricity source in the early years of the modelling period. In year 2012, the share of the total RE is around 80%. But as the usage of natural gas increases, the share of RE in the grid decreases to as low as 19%. The RE split increases again when solar energy starts generating electricity in around 2030, at the end year it has increased to around 72% of the total grid electricity production.
20
Figure 8: Annual production by each technology in PJ in the BAU cost-optimal solution. The graph only considers
technologies that will generate electricity in the modelling period.
5.2. LRET
The LRET scenario's result, which can be seen in Figure 9, has the lowest RE targets. As seen from the figure, the main electricity producers are natural gas power plants and CSP with storage
technology. Other prominent technologies are hydropower, coal power plants and wind power plants. From the total electricity produced in the modelling period, 55% is from RE sources, with around 72% RE in the end-year 2050, meaning it is around 3% under its original target.
Figure 9: Annual production by each technology in PJ in the LRET cost-optimal solution. The graph only considers
21
5.3. IRET
The cost-optimal mix of technologies for the IRET scenario can be seen in Figure 10. As seen from the result, the intermediate RE targets are met with a high share of CSP with storage, wind power and to some extent dam hydropower. Apart from the RE technologies, natural gas power plants are the dominant electricity suppliers in the cost-optimal solution, on average generating 40% of the grid electricity annually. For the whole modelling period, CSP with storage generates the highest share in the generation mix, closely followed by natural gas power plants. Wind power and dam hydropower also produces a considerable share of the total grid supply.
Figure 10: Annual production by each technology in PJ in the IRET cost-optimal solution. The graph only considers
technologies that will generate electricity in the modelling period.
5.4. HRET
The scenario with the highest forced RE target is HRET. The result can be seen in Figure 11. The main electricity generators are CSP with storage, natural gas power plants and wind power plants. This scenario has the highest share of wind power, replacing the electricity generation from natural gas and coal fueled power plants.
Figure 11: Annual production by each technology in PJ in the HRET cost-optimal solution. The graph only considers
22
5.4. OnSSET results for scenarios
Results of the optimal electrification split for the new connections in all four scenarios using OnSSET is shown in Table 5. As shown in the results table, most the settlements that are new connections in 2030 are supplied with electricity by the national grid. The other technologies expected to electrify the population are standalone solar PV, mini-grid hydro, mini-grid solar PV and standalone diesel, in that order. Amongst the off-grid technologies, standalone solar PV was the dominating electricity source in all scenarios.
Table 5. The resulting optimal electrification split to electrify the new connection in OnSSET.
A spatial visualization of the diffusion of electricity supplying technologies and their LCOE for the BAU, LRET, IRET and HRET scenarios are displayed in Figure 12, Figure 13, Figure 14 and Figure 15 respectively. The split of LCOE represents the unit-cost of electricity for construction, operation and maintenance of the required capacities at each point, in USD/kWh. Seen from the maps, the cost of electricity is generally the highest where the off-grid technologies were operating and increases with the distance from the grid.
23
Figure 12: Mapped Results for the BAU scenario. A spatial visualization of the optimal technology split to the left. To
the right is a spatial visualization of the LCOE for the optimal technology split in Ghana.
Figure 13: Mapped Results for the LRET scenario. A spatial visualization of the optimal technology split to the left. To
24
Figure 14: Mapped Results for the IRET scenario. A spatial visualization of the optimal technology split to the left. To
the right is a spatial visualization of the LCOE for the optimal technology split in Ghana.
Figure 15: Mapped Results for the HRET scenario. A spatial visualization of the optimal technology split to the left. To
25
5.5. Scenarios comparison with BAU
The resulted and targeted RE share for each scenario can be seen in Table 6. A comparison between the resulted RE shares and the targeted RE shares shows that the cost-optimal solution does not reach the targets in any scenario, with an exception for the 2040 target in IRET. However, as the targets are set higher, the share of RE rise. The resulted share on HRET is enough to meet the lower targets set in LRET and IRET.
Table 6. The resulted share of RE in the grid for each scenario in comparison to the set targets.
The total production of each technology for the whole modelling period can be seen in Table 7. The table includes the results from all the scenarios. The major alterations of the scenarios to meet the RE targets, is that the electricity production from natural gas power plants decreases and is mostly replaced by wind power and to some extent hydropower. In the period 2010-2030 dam hydro is the primary renewable replacement of decreasing fossil fueled production. During these years, hydropower is the accompaniment to occasional generation spikes from oil and diesel fuels power plants. From 2030 and onwards, wind power production increases rapidly making it the dominant technology replacing natural gas, coal and diesel. The amount of increase and decrease of wind power production depends on the set target. The annual production from CSP with storage technology does not change for any scenario as the annual production has no room to increase.
The LRET scenario stands out from the others. In contrary to the target’s intention, the total electricity generation from natural gas power plants and oil plants increase over the whole modelling period with about 146 PJ and 26 PJ respectively, as seen in Table 7. At the same time, coal power plants reduce their production by 239 PJ meaning that the overall fossil fuel production decreases. Replacing the thermal power plants is wind power which increases its production by 63 PJ making a 6 % share of the total grid production during the whole modelling period.
In the IRET scenario, the total generation from oil power plants increases by 29 PJ compared to BAU, as seen in Table 7. In contrast to LRET, the production from natural gas power plants decreases by 241 PJ compared to BAU. The extent of the production alterations is reflected in each technology’s share of the total grid production for the whole modelling period. Wind power production makes the largest changes, increasing its production share from 5.5% in BAU to 11.3% in IRET. The second largest change is made by the coal power plants, reducing its production share from 9.3% in BAU to 6.0% in IRET, followed by natural gas power plant that reduce their share from 37.0% in BAU to 34.1% in IRET.
26
As seen in Table 7, for the HRET scenario, the coal power production rises compared to IRET, but still decreases compared to BAU by 160 PJ for the whole modelling period. In parallel, oil power plants reduce their production compared to IRET and LRET, but has still increased compared to BAU by 16 PJ. Natural gas power production decreases significantly, by 1027 PJ. As HRET has the highest target the share of wind power has also increased the most, being 5.5% of the total grid production in BAU to 20% in HRET during the whole model period. Other significant changes are natural gas power plants decreasing their share from 37% in BAU to 25% in HRET and coal power plants decreasing their share from 9% in BAU to 7% in HRET.
Table 7. The total production for the whole modelling period by each technology in PJ. All scenarios and technologies
are represented.
As the share of RE in the grid increase between the BAU, LRET and IRET, the grid cost rise consequently. Accordingly, the number of new connections to be supplied by the national grid slightly decreases as the targets get higher. In these cases, the grid supply is replaced by standalone solar PV technologies. The grid cost decreases between IRET and HRET making the new
connections supplied by the grid increase. The maps of the LCOE and technology split distribution does not change considerably for any scenario compared to BAU as the changing grid cost does not have significant effect on the technology split.
27
6. Discussion
The following section summarizes, interprets and analyzes the results. The sections start with analyzing the if the BAU scenario is implementable as Ghana’s future electricity system, from a resource, reliability and sustainability perspective. This is followed by a discussion of the target scenarios’ ability to ensure universal access to affordable, reliable and modern electricity. Lastly, limitations and topics of future research together with sources of error are discussed.
6.1. BAU - The cost-optimal solution
The results from OSeMOSYS showed that CSP plants and natural gas power plants are the two most considerable technologies for the electricity generation mix, over the whole modelling period. Due to Ghana's plentiful solar energy resources, there are prospects for solar power in the country. However, the CSP with storage technology is not mentioned in any of the country’s development or policies initiatives. This draws uncertainty to the prospect of this technology being one of the leading electricity sources of the future. CSP technology has yet to become as widespread as solar PV due to several factors. It has a higher cost of installation and is more dependent on electricity storage compared to solar PV. A well-developed storage technology is required to make the CSP electricity supply more resistant to shortages due to unfavorable weather conditions or at night time. These constraints make it uncertain whether the technology will evolve to meet the predicted expansion and can therefore be unreliable as a solution. At the same time, it can be argued that the pace at which solar technology is evolving today, CSP technology may very well be part of the future electricity supply for Ghana (Bosetti et al, 2012). Apart from the advancement in
technology, large areas of land required for the CSP plants will also constraint CSP's availability in the future. It is possible that the land area needed to generate the amount of electricity suggested by BAU is more than Ghana can provide.
The second largest producers in the OSeMOSYS results were the natural gas power plants. Between the years 2017-2028, the newly available natural gas reserves are estimated to provide enough fuel to supply the electricity sector. After that year, there is a projection of the natural gas supply being insufficient to meet the growing demand (Ministry of Petroleum, 2015). As the natural gas resources are estimated to be inadequate in the forecasts of the Ministry of Petroleum, it is unlikely that they will be sufficient to meet the BAU demand of natural gas in the electricity system model. This points to BAU not being implementable seen from a resources perspective, unless a major additional flow will be available in the future.
As hydropower is one of the main electricity producers today and has utilized most of its expansion potential, it has little room to increase its electricity generation. Since this was an assumption made during the development of the electricity system model, BAU takes this constraint in consideration when modelling the hydro power’s capacity. In contrary to hydropower, there is high unutilized potential for wind power in the solution. To generate more electricity from wind power would diversify the electricity generation mix, balance the risks associated with the main producing technologies and could provide a more reliable supply of electricity. It would however also be a costlier option.
28
Ghana generated around 5600 GWh from thermal power plants in 2015, as seen from the Figure 3, which is 49% of all the electricity generated that year. In the BAU model the share of thermal power plants decreases to around 28% in the end year 2050. As fossil fueled power production reduces with around half of what it was at year 2015, the model proposes a sustainable solution for how the electricity system can develop. However, the amount electricity produced with fossil fuel still increases with time. BAU suggests using around 160 PJ in year 2050, which is around 44 400 GWh.
In short, it is uncertain if there will be sufficient supply of the resources suggested by BAU in the future. The CSP plants will presumably need large land area and the natural gas resource is forecasted to not meet the estimated future demand. The CSP technology and its storage needs to be further developed for it to be readily available to support the BAU solution. Wind power could be a complement to increase the reliability of the model but comes with a higher cost. The BAU model enforces a more sustainable electricity system, as the share of RE increases with about 20% between the actual generation in 2015 and the modelled end year of 2050.
6.2. The scenarios’ role towards meeting SDG 7.1
One of the objectives of this study was to examine the scenarios’ ability to ensure universal access to affordable, reliable and modern electricity, as a part of achieving SDG 7.1. Accordingly, electricity will be the only energy service examined, and the analysis will not be focusing on the ability of achieving the SDG 7.1 by 2030. The analysis will instead examine the ability to achieve it in the time frame of the model, namely between 2010 and 2050.
As OnSSET and OSeMOSYS were developed to produce the cost-optimal solution to ensure 100% electrification to all households, all the scenarios will achieve the requirement of universal access to all households. The modelling tools were also set to adjust the solution to an electricity
consumption quantity of tier 3 in 2030 and tier 5 in 2050. This would entail that all Ghanaian households will have sufficient amount of electricity to use appliances that might not be an option today. Such appliances could signify a modern society in Ghana. However, all solutions partly fulfilled the requirement of providing clean electricity, as none of the scenarios achieved 100% RE electricity generation.
BAU relied mainly on two electricity sources, natural gas power plants and CSP with storage to meet the future electricity demand. In the scenarios, the target forced the model to choose more RE leading to less dependency on natural gas power and more on wind power. As the targets rose, the generation mix increased its diversity. By diversifying the electricity generation mix, the risks associated to the technologies are lowered, leading to a more reliable electricity supply. The target scenarios would be better equipped for withstanding unexpected electricity generation shortages, in case of shortfalls of fuel availability. As HRET had the highest production rate from wind, it can be assumed to be the most reliable solution out of all the scenarios, followed by IRET, LRET and BAU in that order.
29
A higher RE target forced the model to increase the share of RE, even if it was not the cost-optimal, which could be why the RE share is the largest in HRET but still not fully covering the targets. This indicates that a high share of RE may not be the most cost-optimal solution to electrify Ghana. Since HRET had the highest targets and highest resulted share, it would therefore be the costliest solution, followed by IRET and then LRET. This could mean that the more sustainable a solution is, the costlier it becomes, resulting in it may not being the most attractive option for Ghana to implement. However, the fact that the LCOE maps were about the same for each scenario, including BAU, could indicate that the grid costs does not change enough to affect the choice of electricity supply significantly, for any scenario. This would imply that the ability of ensuring affordable electricity to the consumer, is only slightly affected by the share of RE in the grid but more by some other criteria, based on the LCOE.
As the targets of HRET were not reached, Ghana would not realize the Marrakech Vision of 100% domestic RE production by 2050. However, the striving to realize the vision will still make a valuable difference to the country’s impact on the amount of greenhouse gases in the atmosphere and thereby the climate change. An important note is that the definition of affordable, clean and modern electricity is unique for each country and can be interpreted in various ways. Thereby, it is difficult to assess and clearly state whether the requirements are fulfilled or not. Still, analyzing how the electricity system can develop in the future gives an insight on how to achieve the SGD 7. A deeper and more extensive analysis is required to understand the fulfillment of all the
requirements of the goal. Considering Ghana’s recent entry to the status of middle income countries, it is likely the nation’s demand will not be one of the main energy consuming countries of the world. For Ghana to achieve the SDG 7.1 sub target will not make a considerable difference for the whole continent’s energy mix, let alone the world’s. Striving to achieve SDG 7 is therefore be a necessary effort to be on a global scale, by each country.
6.3. Limitations and future work
Considering the limited amount of resources, knowledge and time, this thesis is only aimed to initiate a preliminary development of an integrated resources assessment of Ghana. It can be used as a base for future research of Ghana or improved with more updated methods and data.
Specific areas for future studies suggested by the authors, involve a deeper analysis of the
electrification of Ghana. The deeper analysis would contain a model of Ghana’s electricity system based on actual data directly from the Ministry of Energy for both existing and planned power plants, fuel prices and expansion plans. Credible projections of fuel prices, future power plants, demand and other data would also make the model more accurate. The development differences between the northern and southern Ghana suggest a variation in need for electrification in the country. Making the model reflect a lower electrification rate and urban ratio in the northern Ghana could give the geospatial results more accuracy. However, due to the intricacies of a country’s electricity system, an exact model is near impossible to create. As a main difference between BAU and the target scenarios was BAU being more cost-optimal, it would be of interest to analyze the cost difference and difference of environmental impact between BAU and the target scenarios. Through such an analysis, the most suitable scenario to implement would be explored.
30
Next steps for the assessment could include further investigation on how to make the electricity affordable to consumers, emphasizing on the cost of RE and on the cost for the rural areas of the country. As electricity access, does not rule out regular power blackouts and shortages, assessing the grid quality improvement can also be a part of ensuring reliable energy in the future. Since the modelling tools only consider the electrification of currently un-electrified and currently non-existing residential demand, future studies could analyze the electrification of other electricity consuming sectors. The industry sector currently makes up a large share of the electricity
consumption and is proposed to expand further to diversify Ghana’s economy. An investigation of the future industry demand, including manufacturing and mining, could therefore also be an important part of an integrated resources assessment. As SDG 7 involves all energy services, and not just electricity, an assessment of the whole energy sector of Ghana would be a topic of interest for future research.
6.4. Source of error
Incorrect values can have been used in the modelling process in OSeMOSYS and OnSSET. This could be because of human error or using incorrect values that do not represent Ghana’s electricity system. Simplifying the reality made by the models can lead to incorrect results. As technology evolves with time, the cost for implementing and the efficiency of the technologies may also change, something the modelling system cannot take into consideration accurately. In the OSeMOSYS model, the standalone and mini-grid technologies were only connected to the rural demand and not to the urban demand.
Since the electrification rate and urban ratio inserted in the OnSSET model are mean values for the whole country, OnSSET assumes that the welfare is distributed equally throughout the nation. This could lead to a faulty visualization of the settlement sizes and the electricity demand throughout the country, resulting in inaccuracies of the spatial distribution of the technologies. The size and number of settlements to be electrified has a large impact on the cost-optimal technology choice and ultimately the result. The adjustable parameters and how they are related defines whether the settlements are considered electrified or not and therefore a source of error. The requirements in this model were only set to make the models and actual electrification rates match, only partially based on background research.
31
7. Conclusions
To conclude, the BAU solution is implementable from a sustainability perspective as the share of RE increases with time. It may not be implementable from a reliability and resource perspective since there is a risk of the fuel supply, available land and technology advancements being inadequate. Installing more wind power could increase the model’s reliability but would also be costlier.
No solution for any of the analyzed scenarios realized the Marrakech Vision of 100% domestic RE production by 2050. Neither did an increased share of RE in the national grid ensure universal access to affordable, reliable and modern electricity as part of achieving SDG 7.1. The electricity system model is developed to investigate 100% electrification of the country meaning universal access will be achieved. The model’s requirements for tier 3 and tier 5 electricity consumption together with an increased share of RE, would provide more modern electricity but the higher share of RE would not necessarily make the electricity more reliable. The increased share of RE may be too costly for Ghana to implement. Consequently, the affordable requirement is not necessarily achieved.