EXAMENS
ARBETE
Naturvård och artmångfald 180hp
The impact of eutrophic discharge on
invertebrate abundance in Fucus communities
Felicia Ahlefeldt-Laurvig
Examensarbete i biologi 15hp
The impact of eutrophic discharge on
invertebrate abundance in Fucus
communities
Abstract
Eutrophication due to enhanced nutrient concentrations can affect marine communities by altering the species composition of macroalgae and marine invertebrates, where certain species have shown tendencies to increase. The aim with this study was to assess how the species composition changed in relation to the distance from a nutrient enriched stream
discharge. The study was conducted in an area with rocky shores and Fucus vesiculosus as the dominant alga, and also included the mouth of the eutrophic stream Kvarnabäcken.
Macroalgae and invertebrate abundance was examined in eight locations (including an unaffected reference location) at different distances from the mouth of Kvarnabäcken. The concentrations of total nitrogen and total phosphorus were measured in the marine locations as well as in the stream. Although Kvarnabäcken displayed elevated nutrient concentrations, no distinct nutrient gradient was detected in the marine locations due to distance from the stream. The abundance of invertebrates and macroalgae varied to some extent in the locations, where the location in the immediate mouth area showed most differences, which contributed to the conclusion that the direct impact of nutrient discharge is limited. Although there are aspects indicating that the alterations in animal and algae abundance are consequences of nutrient discharge, other factors that regulate community composition must be considered when evaluating eutrophication in marine communities.
Sammanfattning
Övergödning kan påverka marina samhällen genom att artsammansättningen av makroalger och marina evertebrater ändras till följd av förhöjda närsalter, bland annat genom att vissa arter tenderar att öka i förekomst. Syftet med denna studie var att undersöka om
artsammansättningen av marina evertebrater förändrades i relation till avståndet från ett utsläpp från en bäck med förhöjda närsaltkoncentrationer. Studien utfördes i ett område med klippiga stränder och Fucus vesiculosus som den dominerande algen och inkluderade även mynningen av den övergödda bäcken Kvarnabäcken. Förekomst av makroalger och
evertebrater undersöktes i åtta lokaler (en opåverkad referenslokal inkluderad) längs kusten på varierande avstånd från bäcken. Koncentrationerna av totalkväve och totalfosfor mättes i de marina lokalerna och i bäcken. Trots att Kvarnabäcken visade höga halter av närsalter, visade inte resultatet någon tydlig näringsgradient från bäcken, medan det fanns en antydan till förändrad förekomst av evertebrater och alger i lokalerna. Lokalen närmast utsläppet skiljde sig något från övriga, vilket kan indikera att den direkta påverkan av näringstillförsel kan vara begränsat. Därtill är det viktigt att understryka att även om skillnader i förekomst av
evertebrater och alger i lokalerna kan bero på närsalter från bäcken måste övriga faktorer tas hänsyn till vid undersökningar av marina samhällen.
Introduction
The eutrophic waters of Sweden
In the fall of 1980, the fisheries’ catches from trawling in Laholm bay did not consist of fish, but dead benthic animals. This initiated an investigation of the area, which revealed 135 km2 of hypoxic bottoms (“dead zones”). This phenomenon repeated itself in Kattegat during the following years; in 1988 the dead zones extended to 5000 km2 (Karlson et al. 2002; Wirdheim 1989). Hypoxic bottoms and high mortality among benthic animals were among the first detected effects when studies concerning the consequences of pollution were initiated, as well as a shift in macroalgae species (Baden et al. 1990; Pihl et al. 1995; Rosenberg et al. 1996; Rosenberg et al. 1990).
The oxygen deficiency that occurred in Kattegat had detrimental effects on the fauna in the area, where many benthic animals died during periods of hypoxia. Brittle stars (Ophiura
albida) were observed standing on the tips of their arms, trying to reach higher oxygen
during the following years the lobster catches declined until the population collapsed in 1988. The catches of cod were reduced by 80-90% in the autumns during 1978-1988, most probably due to oxygen depletion causing the fish to migrate from the area (Baden et al. 1990).
The large areas of hypoxic bottoms, and the subsequent effects on the fauna in Kattegat during the 1980’s, were consequences of eutrophication – excess nutrients in the water that promotes primary production. Between 1971 and 1990 oxygen deficiency correlated with high nutrient concentrations (Andersson 1996; Andersson & Rydberg 1988). Oxygen deficiency in bottom waters occurs when the excess nutrients enhance the production of phytoplankton, and when the phytoplankton die and sink to the bottom, the mineralization process consumes oxygen. Due to the distinct halocline in Kattegat, mixing of the water masses is infrequent, thus promoting oxygen depletion in the bottom waters particularly during the autumns (Baden et al. 1990; Wirdheim 1989).
During the 1970’s, the extensive use of fertilizers in agriculture led to nutrient concentrations five to eight times higher compared to levels occurring in the beginning of the twentieth century. From the mid 1980’s, the concentrations slowly started to decline (SEPA 2008b). Although the levels have shown declining trends during the past 30 years, agriculture is still the primary cause of the nutrient loadings to Swedish waters (SEPA 2013; SMED 2011).
Many streams in southern Sweden are eutrophic due to agriculture, and coastal eutrophication is often a consequence of discharge from land (SEPA 2008a).
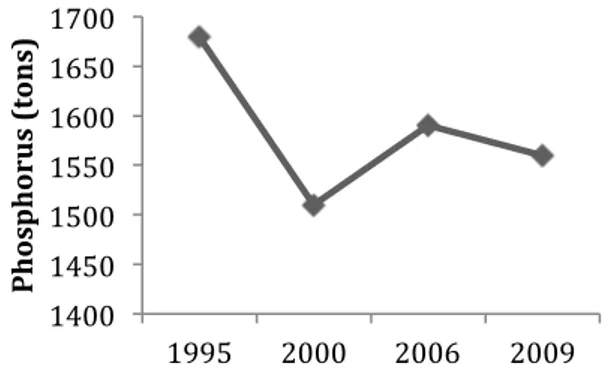
1400 1450 1500 1550 1600 1650 1700 1995 2000 2006 2009 P h osp h or u s (t on s) 47500 50000 52500 55000 57500 60000 1995 2000 2006 2009 N it ro ge n ( to n s)
Figure 1. The total net load of nitrogen from agriculture to Swedish seas during the period 1995-2009. Modified from data from SMED 2011.
Figure 2. The total net load of phosphorus from agriculture to Swedish seas during the period 1995-2009. Modified from data from SMED 2011.
The net leakage of total nitrogen from agriculture to Swedish seas in 2009 was 51 700 tons, which is a decline compared to previous years (Fig. 1). Total net leakage of total phosphorus does not show as distinct decline, although levels are lower compared to 1995 (Fig. 2)
(SMED 2011). One measure to prevent leakage of nutrients from land is to construct wetlands that can retain nutrients before entering other waters or the sea. However, the decline in nutrient loadings in recent years is not an outcome of enhanced measures, but due to a decrease in total area of agriculture land. Although wetlands can be effective in nutrient retention regarding adjacent lakes and other freshwater, the total effect of nutrient retention to the sea is <0.2% for nitrogen and 0.5% for phosphorus (SEPA 2009).
Regarding the Swedish seas, the highest anthropogenic loadings of nitrogen and phosphorus are to Kattegat and the Baltic Proper (SEPA 2008a; SMED 2011). Current nutrient
concentrations in the coastal waters of Halland show positive trends, although the decline in phosphorus is not as significant as regarding nitrogen. Oxygen concentrations in the bottom waters show negative trends, but are classified as good (SMHI 2013). “Zero eutrophication” is one of the 16 environmental quality objectives adopted by the Swedish Parliament, which states that “Nutrient levels in soil and water must not be such that they adversely affect human health, the conditions for biological diversity or the possibility of varied use of land and water”. According to the follow-up 2013, extended measures are necessary and that the goal is not possible to achieve by 2020, since environments are still considered negatively affected by excess nutrients (SEPA 2013).
Effects of eutrophication in shallow coastal waters
A documented shift in macroalgae species was furthermore considered as a consequence of enhanced nutrient concentrations (Baden et al. 1990; Pihl et al. 1995; Rosenberg et al. 1990). This shift often involves an expansion of thin, ephemeral algae at the expense of the coarse, perennial algae (Bernes 2005; Eriksson et al. 1998; Eriksson et al. 2002; Worm & Lotze 2006). Perennial algae can retain nutrients during the winter months, thus having an advantage over the ephemeral algae in the nutrient poor water that occurs in the spring in natural nutrient conditions. However, in eutrophic conditions, the ephemeral algae have the potential to grow at times when they otherwise would be nutrient-limited. Since many
nutrient conditions, they benefit from this in several aspects (Bokn et al. 2003; Diaz et al. 2012; Wirdheim 1989; Worm & Lotze 2006). Primarily, the ephemeral algae increase rapidly in biomass by retaining nutrients at large extent and higher rates than perennial algae
(Martínez et al. 2012; Wallentius 1984). The increase in biomass of the ephemeral algae can lead to shading, thus inducing a decline of slow-growing species (i.e. perennial algae) due to light-limitation (Bernes 2005; Eriksson et al. 1998).
Another consequence of eutrophication is increased turbidity, which can contribute to the shading of the slow growing algae (Bernes 2005; Krause-Jensen et al. 2008). Additionally, enhanced nutrient concentrations may have direct negative impact on the physiology of the perennial algae by reducing the recruitment success (Berger et al. 2004; Bergström et al. 2003; Korpinen & Jormalainen 2008) and causing the tissue to become thinner (Hemmi & Jormalainen 2002). Thus, the combination of the expansion of ephemeral algae, increased turbidity and high nutrient concentrations in itself, may have negative impact on the survival of perennial algae.
Since perennial brown algae of the genus Fucus (hereafter collectively called “fucoids”) compose shelter, habitat and food source for several marine invertebrates, the disappearance or exchange of these algae may lead to an alteration in associated invertebrate species
abundance (Råberg & Kautsky 2007; Wikström & Kautsky 2007; Korpinen et al. 2007). The prominent reason for this is based on the animals’ food preferences, e.g. an expansion of green algae tend to benefit herbivores of genera Jaera and Gammarus (Kraufvelin 2007). Ephemeral algae have the potential to attain equivalent fauna biodiversity as fucoids;
differences in species composition and abundance are more common (Kraufvelin & Salovius 2004, 2014; Wikström & Kautsky 2007).
The presence of herbivores may in turn have an impact on the macroalgae community through top-down control and have the potential to reduce the effects of eutrophication through
grazing (Andersson et al. 2009; Burkepile 2006). Grazing can reduce the epiphytes and periphytons, which tend to accumulate in eutrophic conditions (Bokn et al. 2002; Bokn et al. 2003; Kraufvelin et al. 2006), as well as ephemeral algae (Andersson et al. 2009; Lotze et al. 2000). Nonetheless, herbivores in eutrophic waters may have negative impact on the fucoids as well, e.g. the thinning of the tissue can enhance grazing pressure (Hemmi & Jormalainen 2002).
Besides an alteration in animal species composition or abundance due to a changed macroalgae community, species of herbivores may also react to the nutrient content of the alga. Herbivores have shown to attain higher fecundity, shorter intermolt period, higher growth rate and biomass when consuming fucoid algae growing in nutrient enhanced waters. This is due to the higher content of nutrients and insoluble sugars in the tissue of fucoid algae (Bokn et al. 2003; Hemmi & Jormalainen 2002). Another less conspicuous factor that may regulate the animal abundance, is the presence of periphytons and phytoplankton that tend to increase in eutrophic conditions, which can benefit species that are including these in their diet (Bokn et al. 2002; Kraufvelin et al. 2002).
At the study site in Ugglarp, Falkenberg municipality, the beach consists of rocky shores with
Fucus vesiculosus as the dominant alga species. Additionally, this area includes the mouth of
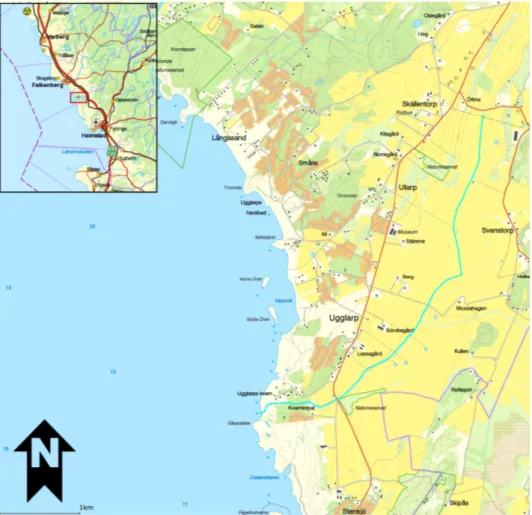
the stream Kvarnabäcken. Kvarnabäcken is a small stream with a depth of approximately 20-40 cm and that stretches 5.4 km through the arable lands of Ugglarp (Fig. 3). The morphology of the stream has been modified for agricultural purposes, therefore the course is for the most part straight and the grade of the stream bank is very steep. The water is eutrophic due to the surrounding arable land, both in terms of direct discharge and as a consequence of the physical alteration of the stream (VISS 2014).
The aim of this study was to assess a potential alteration in the marine invertebrate composition in the recipient area, due to the enhanced nutrient levels in Kvarnabäcken. A gradient might occur where the eutrophic-induced effects are largest at the stream mouth and decline in both directions along the shoreline. Based on previous studies, eutrophic-induced effects could involve e.g. an alteration of abundance in certain animal species or groups. The following questions was addressed when conducting the study:
-Does the community structure differ due to nutrient concentrations/distance from the stream? -Is there a correlation between certain invertebrate species and nutrient
concentrations/distance from the stream?
In order to answer these questions, the invertebrates inhabiting the area serving as recipient of the stream Kvarnabäcken was examined, and nutrient concentrations were measured.
Method
The study area
Figure 3. Map displaying the course and location of the stream Kvarnabäcken according to VISS. Source: VISS 2014-11-14.
The study was primarily conducted in the coastal waters of Ugglarp, Falkenberg municipality, in an area that also includes the mouth of the stream Kvarnabäcken (Fig. 3) (N 56° 48’, E 12° 36’). The study was performed in seven locations along the coast (Fig. 4), where the locations were selected based on the distance from the stream and accessibility.
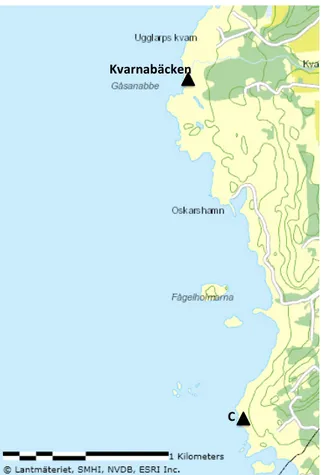
The characteristics of the marine environment in this area consisted of rocky shores, with a depth varying from 10 to 60 cm, and the algal community was dominated by the perennial brown alga Fucus vesiculosus. The terrestrial surroundings were pastureland and cliffs. One location 2.5 km south of the Ugglarp study area was included to function as a control, or a reference site (Fig. 5). This location was considered unaffected by the stream and direct discharge from other contaminated waters, due to the distance from the stream and observations of the surrounding area. The control was located in the coastal waters of the nature reserve Stensjö in Halmstad municipality (N 56° 46’, E 12° 36’). The environment was similar to that in the Ugglarp area, i.e. the terrestrial surroundings were pastureland and cliffs, and the coast consisted of rocky shores with Fucus vesiculosus as the dominant alga in the water.
Figure 5. Map displaying the position of Kvarnabäcken and the control location (C). Map source: VISS 2014-11-25.
Figure 4. Map displaying the study locations in Ugglarp. Location 0 is in the immediate area of the stream mouth. N1, N2 and N3 are located north of the stream mouth, and S1, S2 and S3 south of the stream mouth. Map source: VISS 2014-11-25.
3
Kvarnabäcken+
Data sampling
In order to determine the current nutrient concentrations, water samples (20 ml) for total nitrogen and total phosphorus were collected at the marine locations and in Kvarnabäcken at a depth of approximately 20 cm. The samples were placed in a cooling bag and later in the fridge. Salinity, conductivity and temperature were measured at a depth of approximately 20 cm, in Kvarnabäcken and the marine locations by using HANNA instruments (HANNA microprocessor conductivity/TDS meter HI 9835 and HANNA EC/TDS/NaCl/Resistivity meter). The sampling in Kvarnabäcken took place approximately 20 m upstream from the mouth.
In the marine locations, a D-frame net with 1.5 mm mesh size was used to collect the animals during 15 minutes at each site. The animals were placed in 70% ethanol in plastic jars and were later counted and identified by using microscope and literature (Enckell 1980; Fish & Fish 2011; Moen & Svensen 2008; Ursing 1971). The weather conditions (wind and
precipitation) along with the presence and height of waves were noted. Alga abundance and composition were noted at site and identified (Fish & Fish 2011; Svedberg & Kristiansen 2001), and categorized in numbers representing the estimated occurrence in the area. The study was performed once a month, starting in March and ending in July 2014 at following dates: 5/3, 3/4, 9/5, 2/6 and 8/7. The study occasions were adapted to have similar weather conditions i.e. no or very low amounts of precipitation and wind strength below 4 m/s.
Data analysis
A spectrophotometer analysis was conducted to determine the concentrations of total nitrogen (TN) and total phosphorus (TP). The water samples were kept frozen until the day of
preparation, which was one day prior to the spectrophotometer analysis. A digestion of the samples transformed all nitrogen and phosphorus in the water samples to total nitrogen and total phosphorus. Phenyl phosphate (PO4-P 100 mg/l) was used as reference for TP analysis, and glycine (8mg/l) for TN analysis. By using a pipette, 8 ml of each reference and water sample was added into test tubes, followed by 1.60 ml peroxide. In the samples for the TP analysis, 0.1 ml sulphuric acid was added as well. Following agitation, the samples were
placed in an autoclave during the night, reaching temperatures of 120°C. The following day spectrophotometer analysis proceeded according to the instructions of FIAstar pro 5000-reaction analyzer AN541 (for TP) and AN5202 (for TN) and data was processed with Sofia software.
The statistical analysis was conducted in SPSS Statistics (IBM 2011). Pearson’s correlation coefficient was used to detect correlations between the collected animals, nutrient
concentrations, algal species and distance from the stream.
Results
Abundance and distribution of invertebrates
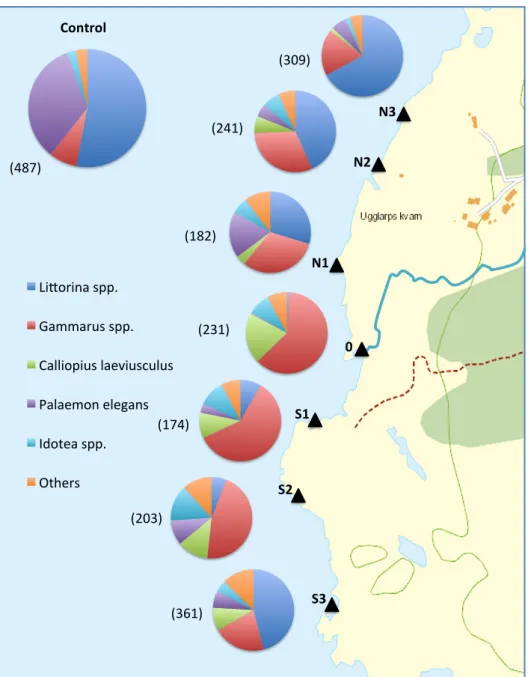
Figure 6 shows the abundance distribution of collected invertebrates. The distribution is based on total numbers of individuals. Individuals of genera Littorina, Gammarus, Calliopius,
Palaemon and Idotea were encountered in the majority of the locations.Littorina spp.
(primarily the species L. littorea and L. obtusata) were the dominant species in N3, N2, S3 and the control, thus abundance was higher at increased distance from the stream (r2 = 0.245, p = 0.001). In location 0, Littorina spp. abundance were limited compared to other locations.
Palaemon elegans was absent in location 0 and substantially more abundant in the control
compared to the other locations. The abundance of P. elegans correlated with distance from the stream (r2 = 0.191, p = 0.005).
Gammarus spp. were very abundant in all the locations except for the control, and the
dominant genera in location 0, S1 and S2. In location 0, Gammarus spp. were particularly abundant at one sampling occasion (June) where the number of collected individuals
exceeded 100. Except for this single sampling, specimens collected at this location were often below 20. Regarding genera Idotea, I. granulosa was distinctive more common than I.
baltica, and both species were less abundant in the locations far from the stream. This trend
was similar concerning Calliopius laeviusculus, which was frequent in location 0 while completely absent in the control.
The category “others” in figure 6 include species that were common but low in numbers, or species that were rarely encountered. Jaera albifrons was common but numbers of individuals were low. The highest abundance of J. albifrons was in location 0, while completely absent in the control. Mytilus edulis was also common, and marginally more abundant in the southern locations. Asterias rubens abundance was low, and only encountered in location N3, S3 and location C. Carcinus maenas was never present in the locations closest to the stream (location
S1# S2# N2# N1# 0# N3# S3# Li#orina(spp.( Gammarus(spp.( Calliopius(laeviusculus( Palaemon(elegans( Idotea(spp.( Others( Control#
Figure 6. The distribution of invertebrates collected in the locations. The diagrams show the distribution of total number of collected genera. The numbers in the parenthesis shows the total number of individuals collected at each site. Map source: VISS 2014-11-25.
(309) (241) (182) (231) (174) (203) (361) (487)
0, S1 and N1). Two freshwater species of order Trichoptera and family Corixidae was collected in location 0.
The highest numbers of individuals were collected in June. Some species were particularly related to the first months of the study: Lacuna vincta was completely absent in June and July.
Carcinus maenas showed the opposite trend by being absent in March and April and then
increasing in numbers during the following months. No other distinct trends in species abundance due to sampling month were detected.
There was a significant positive correlation between the distance from the stream and the number of individuals (r2 = 0.192, p = 0.005). The number of individuals increased with distance from the stream, except for location 0 (Fig. 6). The highest numbers of individuals were collected in the control.
Algae abundance
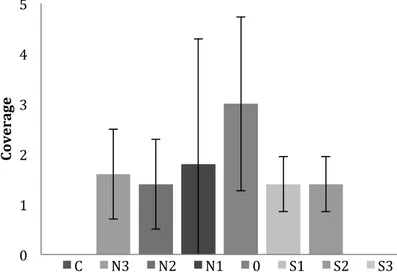
There was no evident alteration in fucoid algae coverage during the months of the study, while the presence of green algae (Ulva spp. and Cladophora spp.) and filamentous brown algae (Pilayella littoralis and Ectocarpus spp.) showed an increasing trend during the time period of the study by increasing in coverage each month. Green algae coverage was overall lower at further distance from the stream (r2 = 0.190, p = 0.05) (Fig. 7). Low abundance of green algae significantly correlated with high numbers of individuals of Littorina spp. (r2 = 0.135, p = 0.020). High abundance of green algae significantly correlated with high
Figure 7. Mean coverage and standard deviation of green algae (Ulva spp. and Cladophora spp.) in the locations during the time period of the study. The x-axis displays the locations. The y-axis displays numbers that represent total coverage, where above 4 represent a total cover of > 50%.
Abiotic conditions
The weather conditions were similar during each occasion: no or very low amounts of precipitation and wind strength below 4 m/s. Wave actions were very low or absent. The temperature in the water increased from 3.6°C in March to 21.9°C in July.
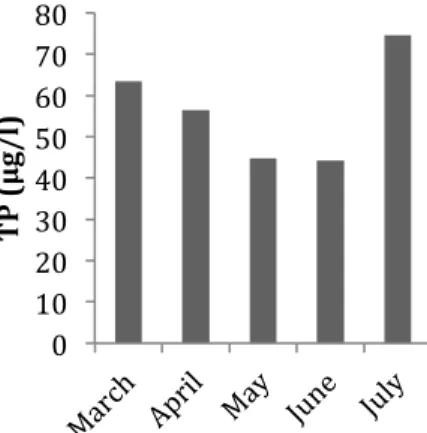
In Kvarnabäcken, the concentration of TN was lowest in April (2.88 mg/l) and peaked in May (6.75 mg/l) (Fig. 8), while the TP concentration was lowest in May (66.70 µg/l) and peaked in July (162.19 µg/l) (Fig. 9). 0 1 2 3 4 5 Co ve ra ge C N3 N2 N1 0 S1 S2 S3
Figure 8. The concentrations of TN in Kvarnabäcken during each month of sampling.
Figure 9. The concentrations of TP in Kvarnabäcken during each month of sampling.
The marine locations displayed varied concentrations of nutrients (Fig. 10 & 11). There was no significant correlation between the locations or distance from the stream and nutrient concentrations. The mean concentration of TN was highest in location 0 (2.60 ± 0.98 mg/l), and lowest in location N1 (0.769 ± 0.36 mg/l) (Fig. 10). In March, very high levels of TP were detected in location S1 (170.0 µg/l) and S2 (290.7 µg/l), which contributed to the high mean concentrations. When excluding these, the mean concentration in S1 was 17.4 ± 5.8 µg/l and in S2 19.3 ± 6.5 µg/l. The control (35.5 ± 20.0 µg/l) and location 0 (33.5 ±10.7 µg/l) displayed similar mean concentrations.
0 1 2 3 4 5 6 T N ( m g/ l) 0 10 20 30 40 50 60 70 80 TP ( μ g/ l) 0 50 100 150 200 TP ( μ g/ l) C N3 N2 N1 0 S1 S2 S3
Figure 10. The mean concentrations and standard deviation
of TN in each location. Figure 11. The mean concentrations and standard deviation of TP in each location.
0 0,5 1 1,5 2 2,5 3 3,5 4 T N ( m g/ l) C N3 N2 N1 0 S1 S2 S3
Mean salinity varied between 11.06 ± 2.38 g/l (in location C) to 11.91 ± 1.60 g/l (in location S2). The exception was location 0, where the salinity averaged 6.94 ± 4.69 g/l. The highest salinities were detected in March (approximately 14 g/l), although this could be due to calibration errors in the two different HANNA instruments used in the study. No significant correlations between salinity and other factors were detected.
Discussion
According to SEPA’s assessment report1 (SEPA 2000), the concentrations of TN (total nitrogen) and TP (total phosphorus) in Kvarnabäcken were classified as “high levels” and “very high levels”. Regarding the TN in May and the TP in July, these levels displayed “extremely high levels”. As previously mentioned, the course and the morphology of the stream make it highly susceptible to nutrient discharge, and is already stated eutrophic (VISS 2014). The nutrient concentrations most likely derive from the surrounding arable fields, since this is a common consequence of agriculture on adjacent waters (SEPA 2008a). It is
noteworthy that Kvarnabäcken has been subject of several measures to mitigate eutrophication (VISS 2014), but still display such high nutrient concentrations.
The TN concentrations in the marine locations were above average levels in coastal waters (Smith et al. 1999) and mean inshore waters of Kattegat (SMHI 2007). According to SEPA’s assessment report2 (SEPA 1999), the mean TN concentrations were considered as “very high”. Location 0 had substantially higher mean concentrations and since this was located in the immediate recipient area, discharge from the stream is the most probable cause for this. Regarding TP, the mean concentrations in the control and in location 0 were also considered as “very high”. This also applies to the peak of TP in location S1 and S2 during March, which was considerably higher than others. There is no apparent reason for those high
concentrations in S1 and S2, but errors in the analysis or an inconspicuous source of discharge
1The classification of nutrient concentrations in the SEPA assessment report (SEPA 2000) is based on lakes
during the period May-October.
2The classification of nutrient concentrations in the SEPA assessment report (SEPA 1999) is based on surface
in this area could be alternative explanations. When excluding these elevated levels, the concentrations were considered moderate. The mean concentrations in the other locations varied from being considered low to moderate (Bydén et al. 2003; SEPA 1999).
Although some locations displayed higher concentrations than others, no distinct gradient in nutrient concentrations were detected along the coastline. An issue concerning classification of nutrient concentrations in seawater is that values are based on surface water in the open sea, thus applying these on shallow coastal waters might be misleading. In comparison with the control, several of the locations actually had lower nutrient concentrations. Regarding mean TN concentrations, location 0, S1 and S2 were the only ones having higher than the control.
Furthermore, the control and location 0 displayed similar mean TP concentrations (35.5 ± 20.0 µg/l in the control and 33.5 ± 10.7 µg/l in location 0), both being high above moderate. This could be a consequence of the control being affected by nutrient discharge from an undetectable source. However, a more plausible explanation is that the whole area covered in this study has elevated nutrient concentrations, despite the discharge from Kvarnabäcken. This could cause an eutrophication gradient to be less pronounced.
In spite of considerable varied nutrient concentrations, other aspects of the results indicate a eutrophication gradient. First, green algae were more abundant in locations near the outlet. Green algae are known to increase rapidly in enhanced nutrient concentrations (Diaz et al. 2012; Kraufvelin 2007), and this was supported by a significant correlation between green algae and TN. The abundance of green algae in the locations adjacent to the stream could imply that the overall nutrient concentrations are higher than in the others.
However, algae abundance is regulated by other factors than nutrient concentrations. Although the locations prominently seem to have similar characteristics, inconspicuous abiotic aspects can have a great impact on rocky shores communities (Dobson & Frid 2009; Menge 2000). For instance, currents and wave actions can act as a disturbance and alter the distribution of species (Rossi et al. 2000). Currents can also transport nutrients, thus
regulating nutrient concentrations in the area (Menge 2000). Wave actions may also alter the presence of available growth surfaces (Kraufvelin 2007). At moderate exposure, fucoid algae
as a storm, fucoid algae may also detach, creating more available growth surfaces. If fucoid algae are already established, it is difficult for ephemeral algae to colonize (Bokn et al. 2002; Bokn et al. 2003), but the combination of enhanced nutrients and open spaces facilitates colonization of ephemeral algae (Kraufvelin 2007; Lotze et al. 1999). This study was
conducted at days where wind and wave actions were low, thus the actual extent of exposure at the locations may be unidentified.
Besides abiotic factors, herbivores may regulate algae communities through top-down control. Grazers may be capable of altering algae communities by preferring certain types, species and life stages of algae (Korpinen et al. 2008; Pavia et al. 1999). High densities of grazers can reduce both fucoid algae (Engkvist et al. 2000) and ephemeral algae (Lotze et al. 1999; Lotze et al. 2000; Korpinen et al. 2007). The number of invertebrate individuals increased with distance from the stream, and since the majority of collected specimens were grazers, the low abundance of green algae at the furthest locations from the stream could be due to the high number of grazers.
The alteration in number of individuals can be considered as the second indicator of an eutrophication gradient. Previous studies have found a variety of alterations in animal abundance due to nutrient enhancement, including an increase of individuals or biomass (Bokn et al. 2003; Daudi et al. 2012; Diaz et al. 2012; Korpinen et al. 2010). For example, grazer abundance may be four times higher in low nutrient concentrations compared to
enhanced nutrient concentrations (Hauxwell et al. 1998). The most contradicting aspect of this part of the result is that Littorina spp. were more abundant further from the stream.
Littorina spp. has otherwise shown to be a species that may benefit from eutrophication based
on its food preferences (Bokn et al. 2002; Diaz et al. 2012; Kraufvelin et al. 2002). Previous studies have demonstrated an increase of Littorina spp. in nutrient enhanced water as a
possible consequence of higher abundance of Ulva spp. (Diaz et al. 2012). Here, the trend was inverted, and high abundance in Littorina spp. was significantly correlated with low
abundance of green algae. However, as with algae communities, invertebrate abundance is also regulated by several other aspects (Råberg & Kautsky 2007). For example, abundance may be regulated by differences in wave exposure and the size of the algae (Korpinen et al. 2010; Menge 2000). Another species that has a tendency to increase in eutrophic waters is
Jaera spp. (Kraufvelin et al. 2002), which was more abundant in location 0 and absent in the
control location. This further supports the theory of an eutrophication gradient.
Palaemon elegans was very abundant in the control compared to other locations. Here, the
individuals of Gammarus spp. were relatively low, and Calliopius laeviusculus absent. P.
elegans is an omnivore and the diet consist primarily of detritus, but also ephemeral algae and Gammarus spp. (Janas & Barańska 2008). Thus, the low numbers of Gammarus spp. at the
control could be due to the high abundance of P. elegans. Since C. laeviusculus is an amphipod similar to Gammarus spp., the absence of C. laeviusculus could also be a consequence of P. elegans abundance.
P. elegans can have strong influence on communities through top-down control. Eriksson et
al. (2011) tested the effect of P. elegans on lower trophic levels. The results showed that P.
elegans could alter community composition by selective preying on Gammarus but not on the
gastropod Theodoxus fluviatilis. The predation of P. elegans reduced Gammarus abundance by up to 79%. As a consequence, algae community was affected, promoting red algae of genera Ceramium to increase in biomass due to alternated grazer pressure. The study also showed that Gammarus spp. was able to decrease macroalgal biomass by more than half compared to T. fluviatilis. This indicates that P. elegans may have an impact on macroalgal communities based on its prey preferences, and also shows the complexity of trophic cascades in macroalgal-invertebrate communities.
Fluctuations in salinity may also play a critical role in the abundance of invertebrates, since species obtain different degrees of tolerance (Dobson & Frid 2009). Although in this study, the salinity was relatively stable in the locations (average from 11.06 g/l to 11.91 g/l), except for location 0 (6.94 g/l). Two freshwater species of genera Trichoptera and Corixidae were collected in location 0, although it is uncertain whether they were recently flushed out from the stream, or inhabiting the area. Gammarus spp. was the dominant genera in this location, which may indicate high tolerance of fluctuations in salinity.
Asterias rubens and Carcinus maenas were completely absent in location 0. C. maenas is a
tolerant species, that can sustain fluctuations in salinity, thus the salinity does not explain the absence of C. maenas here. A. rubens are more susceptible to fluctuations in salinity and
cannot tolerate low salinities, which can explain why this species was only encountered in locations far from the stream (Fish & Fish 2011; Sarantchova 2001).
There were no distinct patterns in overall animal abundance due to month of the study, but highest numbers of individuals were collected in June. June was additionally the month were high numbers of Gammarus spp. was collected in location 0. The TN concentration in the stream peaked in May. If considering that enhanced nutrient may benefit invertebrate
reproduction (Hemmi & Jormalainen 2002), it is possible that the peak in individuals in June is a delayed response of the TN discharge in May.
Since this study was conducted under natural conditions, it is difficult to distinguish which factors that have the largest impact in regulating invertebrate abundance. In contrast to
mesocosm studies (where invertebrates are examined during controlled circumstances), minor undetected changes in the environment may have large influence on the composition of the fauna. Since the correlations showed relatively weak relationships, and that species
abundance may be regulated by several factors beside nutrient enhancement, the alterations of individuals and green algae in relation to the stream may not be a consequence of the stream discharge.
However, it still appears that at least location 0 was affected by the discharge. Location 0 differs considerably from the others; TN concentrations were higher, salinity was lower and green algae coverage increased. The invertebrate composition differed compared to the control: Littorina spp. abundance were very low and P. elegans completely absent. These results could indicate that the direct effects from a eutrophic stream discharge may not extend to more than approximately a 300 m area (the total distance between S1 and N1), which is similar to ranges seen when studying biological effects of sewage outfalls (Fairweather 1990). Nonetheless, the long-term effects of the continuous nutrient discharge to the area could be a considerable cause for the differences in community composition in the locations.
In conclusion
Based on SEPA assessment report (SEPA 1999) and previous reports regarding the situation of the coastal waters of Sweden (SEPA 2008a, 2008b), the whole area is suffering from
enhanced nutrient levels to some extent. When considering that many coastal areas are eutrophic, it is possible that a nutrient-induced eutrophication gradient might not be very distinct. Furthermore, it is difficult to distinguish the effects from other environmental factors. Nonetheless, the combination of the green algae abundance differing in the locations, and that the individuals increased with distance from the stream, indicates that locations near the stream are more affected. The discharge from the stream may not directly alter the species composition, but rather be considered as an additional driving factor among other components that are regulating invertebrate and algal communities.
Acknowledgments
I would like to thank my supervisor Lars-Erik Widahl for helping me with all aspects of this project. I would also like to acknowledge Per-Magnus Ehde for the guidance concerning the water analysis and Göran Sahlén for helping me with the statistics. I am grateful to everyone at Länsstyrelsen, VISS and SMHI that provided me with reports and information.
Furthermore, I would like to thank my family and friends for the support and practical assistance.
References
Andersson, L. & Rydberg, L. 1988. Trends in nutrient and oxygen conditions within the Kattegat: effects of local nutrient supply. Estuarine, Coastal and Shelf Science 26: 559-579.
Andersson, L. 1996. Trends in nutrient and oxygen concentrations in the Skagerrak-Kattegat. Journal of Sea Research 35: 63-71.
Andersson, S., Persson, M., Moksnes, P-O., Baden, S. 2009. The role of the amphipod Gammarus locusta as a grazer on macroalgae in Swedish seagrass meadows. Mar Biol 156: 969-981.
Baden, P. S., Loo, L-O., Pihl, L., Rosenberg, R. 1990. Effects of eutrophication on benthic communities including fish: Swedish west coast. Ambio 19: 113-122.
Bernes, C. 2005. Förändringar under ytan – Sveriges havsmiljö granskad på djupet. Monitor 19. SEPA. Värnamo: Fälth & Hässler. Pp. 61-72.
different life stages of Fucus vesiculosus in the Baltic Sea? – a conceptual model.
Hydrobiologia 514: 243-248.
Bergström, L., Berger, R., Kautsky, L. 2003. Negative direct effects of nutrient
enrichment on the establishment of Fucus vesiculosus in the Baltic Sea. European Journal
of Phycology 38: 41-46.
Bokn, L. T., Moy E. F., Christie, H., Engelbert, S., Karez, R., Kersting, K., Kraufvelin, P., Lindblad, C., Marba, N., Pedersen F. M., Sørensen, K. 2002. Are rocky shore ecosystems affected by nutrient-enriched seawater? Some preliminary results from a mesocosm experiment. Hydrobiologia 484: 167–175.
Bokn, L. T., Duarte, M. C., Pedersen, F. M., Marba, N., Moy E. F., Barrón, C., Bjerkeng, B., Borum, J., Christie, H., Engelbert, S., Fotel, L. F., Hoell, E. E., Karez, R., Kersting, K., Kraufvelin, P., Lindblad, C., Olsen, M., Sanderud, A K., Sommer, U., Sørensen, K. 2003. The response of experimental rocky shore communities to nutrient additions.
Ecosystems 6: 577-594.
Burkepile, E. D. & Hay, E. H. 2006. Herbivore vs. nutrient control of marine primary producers: context-dependent effects. Ecology 87: 3128-3139.
Bydén, S., Larsson, A-M., Olsson, M. 2003. Mäta vatten – undersökningar av sött och
salt vatten. 3d ed. Göteborgs universitet: Institutionen för miljövetenskap och kulturvård. Pp. 60-70.
Daudi, L. N., Lugomela, C., Uku, J. N., De Troch, M. 2012. Effect of nutrient enrichment on seagrass associated meiofauna in Tanzania. Marine Environmental Research 82: 49-58.
Diaz, R. E., Kraufvelin, P., Erlandsson, J. 2012. Combining gut fluorescence technique and spatial analysis to determine Littorina littorea grazing dynamics in nutrient-enriched and nutrient-unenriched littoral mesocosms. Mar Biol 159: 837-852.
Dobson, M. & Frid, C. 2009. Ecology of Aquatic Systems. 2nd edition. New York: Oxford University Press. Pp. 95-96, 119-136.
Enckell, P. 1980. Kräftdjur. Lund: Signum.
Engkvist, R., Malm, T., Tobiasson, S. 2000. Density dependent grazing effects of the isopod Idotea baltica Pallas on Fucus vesiculosus L in the Baltic Sea. Aquatic Ecology 34: 253-260.
Eriksson, K. B., Johansson G., Snoeijs, P. 1998. Long-term changes in the sublittoral zonation of brown algae in the southern Bothnian Sea. J.Phycol. 33: 241-249.
Eriksson, K. B., Johansson G., Snoeijs, P. 2002. Long-term changes in the macroalgal vegetation of the inner Gullmar fjord, Swedish Skagerrak coast. J.Phycol. 28: 284-296.
Eriksson, K. B., van Sluis, C., Sieben, K., Kautsky, L., Råberg, S. 2011. Omnivory and grazer functional composition moderate cascading trophic effects in experimental Fucus vesiculosus habitats. Mar Biol 158: 747-756.
Fairweather, G. P. 1990. Sewage and the biota on seashores: assessment of impact in relation to natural variability. Environmental Monitoring and Assessment 14: 197-210. Fish, J. D. & Fish, S. 2011. A student’s guide to the seashore. 3d ed. New york:
Cambridge University.
Hauxwell J., McClelland, J., Behr J. P., Valiela, I. 1998. Relative importance of grazing and nutrient controls of macroalgal biomass in three temperate shallow estuaries.
Estuaries 21: 347-360.
Havet 2013/2014 – om miljötillståndet i svenska havsområden.
Hemmi, A. & Jormalainen, V. 2002. Nutrient enhancement increases performance of marine herbivore via quality of its food alga. Ecology 83: 1052-1064.
Janas, U. & Barańska, A. 2008. What is the diet of Palaemon elegans Rathke, 1837 (Crustacea, Decapoda), a non-indigenous species in the Gulf of Gdańsk (southern Baltic Sea)? Oceanologia 50: 221-237.
Karlson, K., Rosenberg, R., Bonsdorff, E. 2002. Temporal and spatial large-scale effects of eutrophication and oxygen deficiency on benthic fauna in Scandinavian and Baltic waters – a review. Oceanography and Marine Biology: an Annual Review 40: 427-489. Korpinen, S., Jormalainen, V., Honkanen, T. 2007. Effects of nutrients, herbivory, and depth on the macroalgal community in the rocky sublittoral. Ecology 88: 839-852. Korpinen, S., Jormalainen, V., Ikonen, J. 2008. Selective consumption and facilitation by mesograzers in adult and colonizing macroalgal assemblages. Mar Biol 154: 787-794. Korpinen, S. & Jormalainen, V. 2008. Grazing and nutrients reduce recruitment success of
Fucus vesiculosus L. (Fucales: Phaeophyceae). Estuarine, Coastal and Shelf Science 78:
437-444.
Korpinen, S., Jormalainen, V., Pettay, E. 2010. Nutrient availability modifies species abundance and community structure of Fucus-associated littoral benthic fauna. Marine
Environmental Research 70: 283-292.
Kraufvelin, P., Christie, H., Olsen, M. 2002. Littoral macrofauna (secondary) responses to experimental nutrient addition to rocky shore mesocosms and a coastal lagoon.
Hydrobiologia 484: 149-166.
Kraufvelin, P. & Salovius, S. 2004. Animal diversity in Baltic rocky shore macroalgae: can Cladophora glomerata compensate for lost Fucus vesiculosus? Estuarine, Coastal and
rocky shore communities. Aquatic Botany 87: 262-274.
Kraufvelin, P., Salovius, S., Hartvig, C., Moy E. F., Karez, R., Pedersen F. M. 2006. Eutrophication-induced changes in benthic algae affect the behaviour and fitness of the marine amphipod Gammarus locusta. Aquatic Botany 84: 199-209.
Kraufvelin, P. & Salovius, S. 2014. The filamentous green alga Cladophora glomerata as a habitat for littoral macro-fauna in the Northern Baltic Sea. Ophelia 58: 65-78.
Krause-Jensen, D., Sagert, S., Schubert, H., Boström, C. 2008. Empirical relationships linking distribution and abundance of marine vegetation to eutrophication. Ecological
indicators 8: 515-529.
Lotze, H. K., Schramm, W., Schories, D., Worm, B. 1999. Control of macroalgal blooms at early development stages: Pilayella littoralis versus Enteromorpha spp. Oceologia 119: 46-54.
Lotze, H. K., Worm, B., Sommer, U. 2000. Propagule banks, herbivory and nutrient supply control population development and dominance patterns in macroalgal blooms.
Oikos 89: 46-58.
Martínez, B., Pato, S. L., Rico, M. J. 2012. Nutrient uptake and growth responses of three intertidal macroalgae with perennial, opportunistic and summer-annual strategies. Aquatic
Botany 96: 14-22.
Menge, A. B. 2000. Top-down and bottom-up community regulation in marine rocky intertidal habitats. Journal of Experimental Marine Biology and Ecology 250: 257-289. Moen, E. F. & Svensen, E. 2008. Djurliv i havet: nordeuropeisk marin fauna. Stockholm: Norstedts.
Pavia, H., Carr, H., Åberg, P. 1999. Habitat and feeding preferences of crustacean
mesoherbivores inhabiting the brown seaweed Ascophyllum nodosum (L.) Le Jol. And its epiphytic macralgae. Journal of Experimental Marine Biology and Ecology 236: 15-32. Pihl, L., Isaksson, I., Wennhage, H., Moksnes, P-O. 1995. Recent increase of filamentous algae in shallow Swedish bays: effects on the community structure of epibenthic fauna and fish. Netherlands journal of aquatic ecology 29: 349-358.
Rosenberg, R., Cato, I., Förlin, L., Grip, K., Rodhe, J. 1996. Marine environment quality assessment of the Skagerrak-Kattegat. Journal of Sea Research 25: 1-8.
Rosenberg, R., Elmgren, R., Fleischer, S., Jonsson, P., Persson, G., Dahlin, H. 1990. Marine eutrophication case studies in Sweden. Ambio 3: 102-108.
Rossi, S., Gili, M J., Hughes, R.G. 2000. The effects of exposure to wave action on the distribution and morphology of the epiphytic hydrozoans Clava multicornis and
Råberg, S. & Kautsky, L. 2007. A comparative biodiversity study of the associated fauna of perennial fucoids and filamentous algae. Estuarine, Coastal and Shelf Science 73: 249-258.
Sarantchova, L. O. 2001. Research into tolerance for the environment salinity in sea starfish Asterias rubens L. from populations of the White Sea and Barentz Sea. Journal of
Experimental Marine Biology and Ecology 264: 15-28.
SEPA. 1999. Bedömningsgrunder för miljökvalitet: Kust och hav. Report 4914. Uppsala: Naturvårdsverket. Pp. 18-27.
SEPA. 2000. Bedömningsgrunder för miljökvalitet: Sjöar och vattendrag. Report 4913. 2nd ed. Uppsala: Naturvårdsverket. Pp. 15-19.
SEPA. 2008a. Ingen övergödning. Underlagsrapport till fördjupad utvärdering av
miljömålsarbetet. Ny reviderad version. Report 5840. Pp. 26-29, 36-45.
SEPA. 2008b. Eutrophication of the seas along Sweden’s West Coast. Report 5898. Pp. 13-14, 19, 44-46.
SEPA. 2009. Uppföljning av effekten av anlagda våtmarker i jordbruksland. Belastning
av kväve och fosfor. Report 6309. Pp. 38-51.
SEPA. 2013. Miljömålen. Årlig uppföljning av Sveriges miljökvalitetsmål och etappmål
2013. Report 6557. Pp. 98-107.
SMED (Svenska MiljöEmissionsData). 2011. Beräkning av kväve- och fosforbelastning
på vatten och hav för uppföljning av miljökvalitetsmålet “Ingen övergödning”. Report 56.
Pp. 18-35 & Appendix 2.
SMHI. 2007. Swedish National Report on Eutrophication Status in the Katteat and the
Skagerrak. OSPAR assessment 2007. Oceanography report 36. Appendix 1.
SMHI. 2013. Årsrapport 2013 Hydrografi & Växtplankton. Hallands kustkontrollprogram. Report 2014-13. Pp. 9-15, 18-19.
Smith, V.H., Tilman, G.D., Nekola, J.C. 1999. Eutrophication: impacts of excess nutrient inputs on freshwater, marine, and terrestrial ecosystems. Environmental Pollution 100: 179-196.
Svedberg, U. & Kristiansen, A. 2001. Havets växter. Stockholm: Prisma.
Ursing, B. 1971. Ryggradslösa djur. Stockholm: P.A. Norstedt & Söners förlag. VISS 2014 – Vatteninformationssystem Sverige. Kvarnabäcken – SE630294-130664. http://viss.lansstyrelsen.se/Waters.aspx?waterEUID=SE630294-130664 [2014-11-08] Wallentius, I. 1984. Comparisons of nutrient uptake rates for Baltic macroalgae with different thallus morphologies. Marine Biology 80: 215-225.
Wikström, A. S. & Kautsky, L. 2007. Structure and diversity of invertebrate communities in the presence and absence of canopy-forming Fucus vesiculosus in the Baltic Sea.
Estuarine, Coastal and Shelf Science 72: 168-176.
Wirdheim, A. 1989. Vad händer med Västerhavet. Naturskyddsföreningen. Pp. 6-18. Worm, B. & Lotze, K. H. 2006. Effects of eutrophication, grazing, and algal blooms in rocky shores. Limnol. Oceanogr. 51: 569-579.
Besöksadress: Kristian IV:s väg 3 Postadress: Box 823, 301 18 Halmstad Felicia Ahlefeldt-Laurvig