The comparison of impact from capital
structure to corporate performance
be-tween Chinese and European listed
firms
Master’s thesis within International Financial Analysis
Author: Tianyu He
Tutor: Urban Österlund
Master’s Thesis
Title: The comparison of impact from capital structure to corporate per-formance between Chinese and European listed firms
Author: Tianyu He
Tutor: Urban Österlund
Date: 2013-08-15
Subject terms: capital structure, firm performance, effect, comparison, listed
companies
Abstract
Capital structure and companies’ performance are important to corporate finance. There-fore, firms take different strategies to adjust capital structure to get a better firm perfor-mance. However still the studies mostly conducted in one country setting or neglect the angle from listed companies across countries. This thesis encompasses 2 developed coun-tries (Germany and Sweden) and a developing country (China) to test the impact from cap-ital structure to firm performance of period 2003-2012 with more than 1200 listed compa-nies in Germany and Sweden and more than 1000 listed compacompa-nies in China. The result shows capital structure has a significant negative effect to firm performance in China, whe-reas, significant positive effect in 2 European countries before financial crisis happened in 2008. I also find institutional factors and economic crisis will affect this relationship too.
Acknowledgements
This thesis would not have been possible without supports from many people. The author would like to express thanks to all the people who helped to finish it.
The author gives sincerely thank to the supervisor Urban Österlund, for his helpful detailed comments and suggestions in improving the quality of this thesis. It is also important to thank for his motivation during the process and supportive ideas. This thesis has benefited from the supports of my family and many friends who gave me during the hard time. Especially I am grateful for Dezheng Wang for his assis-tance that guides insights to me, and supplies the data from CSMAR. Hang Liu, Tengfei Guo and Shuyi Wu provide me corresponding information. I appreciate Bingning Hong’s encourages all the time.
Contents
1
Introduction ... 1
1.1 Background ... 1
1.2 Background and Chinese institutional environment ... 3
1.3 Problem ... 5
1.4 Purpose and delimitations ... 6
1.5 Research approach and literature source ... 7
1.6 Disposition of thesis ... 8
2
Theory of capital structure and corporate performance ... 9
2.1 Capital structure ... 9
2.1.1 MM Theory ... 9
2.1.2 Development of MM theory ... 9
2.1.3 Trade-off theory ... 9
2.1.4 Pecking order theory ... 10
2.1.5 Agency cost theory ... 10
2.2 Theory of corporate performance ... 11
2.2.1 Basic definition about firm performance ... 11
2.2.2 The measurements of firm performance ... 11
2.3 Review of empirical studies of the relationship between capital structure and firm performance... 12
2.3.1 Empirical studies in western countries ... 12
2.3.2 Empirical studies in China ... 13
3
Research methodology ... 17
3.1 Sample set ... 17 3.2 Data description ... 17 3.2.1 Explained variables ... 17 3.2.2 Explanatory variables ... 18 3.2.3 Control variables ... 18 3.3 Regression models... 19 3.4 Research predictions ... 194
Empirical study and analysis ... 21
4.1 Comprehensive compare of Chinese and European regression result 2003-2011 ... 21
4.2 Analysis of Chinese regression result ... 24
4.2.1 Effects from 2003 to 2008 ... 26
4.2.2 Effects from 2009 to 2011 ... 27
4.3 Analysis of European regression result ... 27
4.3.1 Effects from 2005 to 2007 ... 29
4.3.2 Effects from 2008 to 2011 ... 30
5
Conclusion and suggestions for further researches ... 32
5.1 Conclusion ... 32
5.2 Suggestions for further studies ... 34
1 Introduction
Try to imagine two areas with differences in economy, culture, legal system, political insti-tution and beliefs, but both of them are promising economic entities in the world. Thou-sands of companies and firms are running in these two areas, how are their performance within all these different factors. In this thesis, I will focus on the relationship between firm performance and capital structure in two main economic areas-China and Euro zone. One is the biggest economic entity in the world, the other one is the biggest developing country. With the globalization of market economy constantly enhancement, world-wide market is gradually formed. In this process, mutual impact of economy is irresistible. Enterprises play important roles in modern society, firm performances decide a country’s or an area’s future. More and more researches have shown the vital relationship between capital structure and firm performance. On the one hand, Masulis (1983), Jordan, Lowe and Taylor (1998), Simely and Li (2000), Frank and Goyal (2003), and Deping Chen and Yongsheng Chen (2011) etc showed the positive correlation between firm performance and capital structure, which reflects the basic theory of capital structure. However on the other hand, Titman and Wessels (1998), Raghuram G. Rajan and Luigi Zingales (1995), Booth et al. (2001), Zhengfei Lu and Yu Xin (1998) etc explained they are negative correlated of them, which is totally different from knowledge of books. During the process, I am looking for if there is difference in two different markets, if the answer is yes, what are the most significant fea-tures could account for this otherness between the largest developing transforming econ-omy and the oldest and the most mature market economies. I will try to find out the an-swers in this thesis.
1.1Background
Corporate finance is a significant issue to a firm, especially to listed firms. It decides how firm get money they need to invest to other area, and the core of this issue is the capital structure. In 1958 then MM theory emerged until now, there are lots of researches which focus on the capital structure of corporate in world. These researches show conclusions both in theoretically study and practical data analysis. Most of the researches analyze the companies in USA and Europe.
With the rapidly developing speed of Asia’s economy, especially China is the engine of Asia’s economic. More and more people start to pay attention to this new place which could help companies to gain capital easily which leads to more studies concerning to this area which is full of opportunities. However, though China has made great progress in economy, and there are still spaces for Chinese market to improve both in theoretically and practically. As we all know that there are many ways to gain profits, for example, a firm could make investments through financing in stock market, enhancing sales or decrease the cost of products and so on. What arouse my curiosities are the international capital struc-ture researches which emerged in recent years that mainly focusing on the Asian-Pacific re-gion. Rataporn Deesomsak, Krishna Paudyal and Gioua Pescetto (2004) made a research about Asia-Pacific region; they found different investing environment will cause diverse capital structure, which also include firm-specific factors. They also found that financial cri-sis of 1997 will affect companies’ capital structure.
Because of different political institution and culture, the capital structure may have differ-ences with developed countries. William S. Sekely and J. Markham Collins (1988) get a conclusion that cultural difference will have some relations with significant country and re-duce the impact of industry influences. Furthermore, there may be some international
in-fluences by cultural patterns in some countries. Wald (1999) got the conclusion that the characteristics of firms that have no directly relationship with leverage across countries. He illustrated that institutional differences could cause differences in capital structure. His re-sults indicate that institutions significantly influence firm’s capital structure decision and monitoring problems, while existing in every country, which may create different conse-quences. Abe de Jong, Rezaul Kabir and Thuy Thu Nguyen (2008) tested 42 countries all over the world and firstly they found out the firm-specific determinants of leverage differ across countries, secondly, they showed there is an indirect impact because country-specific factors also influence the roles of firm-specific determinants of leverage although they con-curred with the conventional direct impact of country-specific factors on the capital struc-ture of firms.
According to the research by Demirguc-Kunt and Maksimovic (1999), they compared 19 developed countries and 11 developing countries, and they concluded that the institutional differences (such as legal systems, financial institutions, government subsidies, rate of infla-tion and the economy’s growth rate and so on) between these countries is one of the main reasons may cause different capital structures of using long-term debt among their compa-nies. Furthermore, they found the institutional factors may also affect the different firms’ leverage.
Jean J. Chen (2004) chose to research the determinants of capital structure of Chinese-listed companies based on the research Booth (2001) studied, he wanted to find out the features of capital structure in Chinese listed companies which influenced by different insti-tutional structure comparing with Europe countries or USA. The result he showed to us is there is a very big difference in capital structure between China and western mode which caused by institutional structure (such as legal system on governing companies’ operation, banking and securities markets, ownership concentration and corporate governance struc-ture of listed firms and financial constraints in banking sectors and so on).
In terms to the firm performance, there are many people tried to find out the affecting fac-tors from many aspects in many researches. Hansen and Wernerfelt (1989) collected 1000 firms representing both dominant and lesser member of their respective industries to test the factors to affect firm performance coming from economy and organization. The con-clusion firstly confirmed the importance of industry selection and position. Secondly, they find out administrative practice are important too. Moreover, the effects of economic and organizational are independent.
Hermalin and Weisbach (1991) tested 142 NYSE firms of the effects to firm performance from board composition and direct incentive, however, the result shows little relationship between each other. Agrawal and Knoeber (1996) applied data from 205 listed companies in USA and indicate compensation arising of board and ownership structure has a signifi-cant negative relation with subsequent firm operating and stock return performance. Bharadwaj and Konsynski (1999) compared the data during 1988 to 1993; they found in-formation technology investment had a significant positive relationship with firm perfor-mance (Tobin’s Q value).
Bauer, Guenster and Otten (2004) analyzed the relationship between different governance standards and firm performance (stock returns) included in the FTSE Eurotop 300 in 2001 and 2000. They found a stronger relationship was found the lower the governance stan-dards, the stronger the relationship between governance and firm value.
Although there are many researches about the influence to capital structure and firm per-formance by many factors, still there remain many questions to be answered. Opening new markets for listed companies in China or Europe is more frequent recently, which is impor-tant to know the capital structure in Europe and Chinese listed firms, what kind of capital structure will be helpful to their performance. With the thoughts in mind, the author presents the problem existing in the research and tries to explore them.
1.2Background and Chinese institutional environment
Cultural and institutional difference may affect a company’s capital structures and their per-formance in different area. Collins and Sekely (1983) showed us that there are significant differences in capital structure for a company in different countries; however, they didn’t find enough evidence to prove the impact in 1983.
After 30 years development, China’s economy has experienced an amazing change. Ac-cording to the latest data from Chinese government, China has become the second largest economic entity in the world, which is still smaller than the United State of America. As the reasons we all know that China has a different institutional system, Chinese economy has many features that are very different from the European countries. For example, the con-sumer spending mode, the habit of saving to residents. All of these could be concluded by the different culture concept, and these are the influence to individuals. On the other hand, Chinese companies also changed a lot in order to adapt themselves to the modern corpo-rate system. In this process, many corpocorpo-rate suffered failure and bankruptcy, this is because the lack of understanding of the modern corporate system. And now, there are more and more corporate growing healthily and becoming outstanding companies in their areas. As to the Chinese stock market, after many years developing, Zhijuan Chen (2006), Yichao Li and Zhensheng Jiang (2001) and Zuoping Xiao (2005) think it has preliminary reached weak-efficient market, which is very important for us to know the relationship between firms’ capital structure and performance.
However, after seeing the extraordinary success I also need to notice the Chinese firms’ growth feature. For the state-owned enterprises, Chinese government will always give vi-gorous support to most of state-owned enterprises, which made most of the enterprise have become monopoly enterprise in the related area. Although after China joined the WTO, Chinese government gave a promise to allow international competition with foreign companies, the WTO still gave China enough time for reintegration in order to enhance state-owned companies’ competition.
There are many enterprise have growing stronger enough in the whole world, for example, the four state-owned banks have been the world’s most profitable banks. They are ICBC (industrial and commercial bank of China), BOC (bank of China), CCB (China construc-tion bank) and ABC (Agricultural bank of China). And by the helping of government, Chi-na Mobile has been the most profitable telecom operator. According to the 2012 Forbes magazine of the world biggest public companies1, ICBC takes the lead, and the other 3
banks are No. 11, No. 2 and No. 8 separately. All the stories I mentioned above are repre-sentative to illustrate some of China’s state-owned enterprise development characteristic. Chinese government of course don’t neglect the importance of private enterprise, although they know state-owned corporate are more important to them. Chinese government
duced many policy-type (such as lightening the taxes burden and supplying greater financial access to sustain smaller enterprises and manufacturing sector) support to support the de-velopment of private enterprise. The State Council introduced nine measures in November 2011 to extend financial support to develop small enterprise, in the mean time, many local governments have taken corresponding measures to reduce and suspend taxes2.
The Chinese stock market is a new exchange market since November 26th 1990 in Shanghai
and Shenzhen respectively. By the end of 2012, the total number of listed companies in these two stock markets is 2494; Shanghai exchange market has 954 and Shenzhen ex-change market has 1540 listed companies. Chinese stock exex-change market has become the largest stock market in Asia after 23 years development. Table 1 shows some important da-ta in Chinese stock market from 2008 to 2012.
However, according to Jean J. Chen (2004) the different institutional environment in Chi-na, Chinese stock market has some funny distinctions comparing with foreign stock mar-kets, which is there are 5 types of shares- A shares, B shares, C shares, H shares and N shares.
Most of the investors are trading with A shares and B shares. A shares are designated for the domestic investors, and B shares are designated for the overseas investors. From March of 2001, the investors in China could also trade stocks with B shares too. Moreover, Shanghai and Shenzhen stock exchange have a daily price movement limit system with plus or minus 10% of the stock price.
Jean J. Chen (2004) also mentioned that Chinese financial sector is controlled by state, and the long-term debt which is provided by banks has been strictly controlled also. They also showed some legal loopholes, for example, the company law is ambiguous about the debt holders’ rights, which means the issues about private property rights have not solved yet. That is a huge difference from western firms and legal system, though I know Chinese cap-ital market is improving every day, I still have to admit the defects in Chinese market. All these features in China will lead listed companies to have a different capital structure com-pare with the foreign corporate.
According to many researches above, I might guess that if a foreign firm wants to enter Chinese market in order to get a positive competition with Chinese enterprise, facing to the distinctions of stock exchange market in China and Europe countries, such as legal affairs, capital system processes and rules, and the relationships between government and firms and so on. Many foreign companies have to adjust competitive strategy and their compa-nies’ capital structure.
Table 1
Summary for stock markets
Item 2008 2009 2010 2011 2012 Number of listed companies 1625 1718 2063 2342 2494 Number of listed stocks 1711 1804 2159 2428 2579
Total market capi-talization(100 mil-lion RMB) 121366 243939 265423 214758 230357 Negotiable market capitalization (100m RMB) 45214 151259 193110 164921 181658 Total tumover(100m RMB) 267113 535987 545634 421644 314667 Trading volume(100m) 24131.39 51106.99 42151.98 33957.00 N/A
Source: National Bureau of Statistics of China N/A: not available
1.3Problem
The Modigliani and Miller theory implies that capital structures are related to companies’ value, but the assumption was based on a perfect capital market. In the real world, compa-nies may choose different capital structure because of many factors, for example, institu-tional influence, the degree of freedom in a market, the conditions of economy and so on. They are critical to a company’s development.
Nowadays, more and more companies tend to issuing equity or debts to finance when they need to expand their firm size or reinvest to gain more profits. According to the MM theory, this kind of capital structure adjustment will have effects to enterprise’s value. However, the situations are much more complicated in the real competition world than in
the theory. China which is the new star of capital market for decades, and this market if full of opportunities and lower cost comparing to Europe. The European area is the traditional capital markets which have experienced hundreds years’ changes that make them relatively mature in legal system on governing companies’ operation, banking and securities markets, ownership concentration and corporate governance structure of listed firms and financial constraints in banking sectors and so on. Author is curious about the listed companies’ per-formance in different market when they need financing or expanding business size from capital market. In this thesis, I try to answer the questions as follows:
1. A: What are the different features between Chinese and foreign listed companies’ capi-tal structure (debts-level)?
B: How will the different features affect choices of firms for debts financing?
2 A: Are there negative or positive effects on the listed firm performance in two regions brought by capital structure?
B: If listed companies have two different effects, what kind of result will be caused? 3 A: Does Chinese institutional environment affect the domestic companies’ capital
structure?
B: How should European and Chinese listed companies consider the strategies when they entering Chinese and European market based on the data analyzing.
It is not difficult to measure the firm performance and capital structure; there are many dif-ferent variables in economics to refer to them. For example, rate on equity, Tobin’s Q val-ue, EVA and profitability to measure firm’s performance, and long-term debt ratio, short-term debts ratio, asset liability ratio, biggest shareholders of the enterprise and so on to measure capital structure.
The international study about the capital structure in different countries started from 1990s, and in this thesis, I am trying to find out how the capital structure affects the corporate performance in modern corporate finance.
All the reasons I mentioned above is to find out the detail factors in capital structure affect-ing the performance in these two areas. What is the difference among them?
1.4Purpose and delimitations
The purpose of this thesis is to explore the effect that capital structure lead to firm perfor-mance in Chinese and European listed companies, and then describe the difference among them, finally explains the reason what makes the difference.
The international studies about the capital structure in different countries started from 1990s, which are very popular in the end of last century. However, recent years, there are fewer studies appear regarding to this subject. After experiencing the financial crisis and European debts crisis to the whole world, are there any changes in this relationship com-paring with historical studies?
The reason why I choose listed companies is that, on one hand, listed companies have to release their financial information regularly; the data is more authentic and accurate, which is easier for me to understand.
On the other hand, the sources of capital of listed companies are capital market, which is different to non-listed companies. So the study of listed companies would be more
repre-sentatively. Most importantly is that, I could get more information in detail comparing to non-listed companies.
Because of the specialty of state-owned enterprise that government will back up these en-terprises, for the reason that if a country backup for a company, the rule of free competi-tion in capital market will be broken, which would lead to a distinct capital data relative to the private companies. The data from state-owned companies would have no persuasive-ness, and it might lead to an unknown result. In that scenario, the outcome of comparison may have inefficiency, so in this thesis, I will not choose state-owned enterprise.
Also I need to reject the financial companies for the balance sheet from financial compa-nies would have a different structure from the nonfinancial compacompa-nies, in this condition; I will also exclude the financial companies in the data sample.
Thirdly there is another feature that there might be some listed companies are loss for sev-eral successive years or some companies are nearly to go bankrupt. They are called ST stocks or *ST stocks. For the reason that there might be some special factors in these kinds of stocks, which means they are not representative; I won’t use data from them either. In the end, the final data sample will consists of different listed companies from Chinese market both in Shanghai stock exchange market and Shenzhen stock exchange market, nevertheless, the listed firms in Hong Kong market will not be used in the data collecting.
1.5Research approach and literature source
Firstly, corresponding background of relationship between capital structure and firm per-formance has been discussed in the chapter 1, whereas, the relationship I mentioned in chapter 1 is focus on the single relationship comes from macro environment (such as insti-tutional factors, economic crisis factors and the differences among unbalanced economic entities and so on). What I am curious is the listed enterprise under the conditions com-bines all these 3 factors together, that is, China and some countries in Europe.
To explore the different relationship between firm performance and capital structure should combine with the theory and data analysis. So regarding theory’s development should be in traduced in chapter 2 to find out whether the application of theory could re-flect the reality world, and what aspects in theory affect the current world. International empirical studies will be discussed and made into table format, especially I will focus on the most popular area in capital structures; debts level to total asset and equities value in the stock market, for these factors may cause distinct financing patterns. The relative literatures will be found on Google scholar, Jönköping university library, and Chinese national know-ledge infrastructure3.
Data collection is very important for this thesis, however listed companies have to public their information and data. This means I will grab listed companies’ data from European stock market (German stock market and Swedish stock market) and Chinese stock market to compare and analyze these companies’ composition of debts structure and find out the distinct influencing factors. And the corresponding period will be involved to compare the relationship between capital structure and firm performance from two databases, one is Chinese CSMAR solution database (China Stock Market and Accounting Research Data-base), where provides all Chinese listed companies’ data; the other one is Amadeus
base where has European listed companies’ data. Since that there are little researches to compare this relationship recently, I will choose data from 2003 to 2011 to test whether there are changes in latest 10-year period through comparing with international historical empirical researches. I will also choose some variables to measure firm performance and capital structure with some control variables (such as the most popular area in capital struc-tures; debts level to total asset and equities value in the stock market) to remove the effect brought from other factors to prepare for the empirical analysis in the next chapter.
In order to compare the effect factors (institutional effect, economic crisis factors); a sepa-rate analysis will be introduced in analysis (For example, two period’s regression result be-fore and after financial crisis). During the process, I am looking for if there is otherness in two different markets, if there is, what are the most significant features that could account for this otherness between the largest developing and transforming economy and the oldest and the most mature market economies.
Conclusion and suggestion will be included after the regression result in the empirical study.
1.6Disposition of thesis
This thesis will include 5 chapters. In chapter 1, I will introduce the background of the cap-ital structures previous research. In the mean time, I will also talk about the problem I may occur, and raise some questions I want to figure them out. Then I need to make a purpose during this thesis. In this chapter I will also talk about the background of Chinese institu-tional environment. The application of capital structure theory and firm performance theory will be discussed in chapter 2, I am going to review the empirical study in Chinese and foreign scholars, and get to know the relationship between capital structure and firm performance from multi-angle of view also. In chapter 3, I will talk about the methods to analyze capital structure and their performance in China’s and European listed companies and data description and collecting will be introduced in this chapter. In chapter 4, descrip-tive statistics, empirical study and analysis among two markets will be discussed in chapter 4. In the last chapter 5, a conclusion and suggestions will be given; moreover, further re-search will be involved if I have to.
2Theory of capital structure and corporate performance
2.1Capital structure
2.1.1MM Theory
The research of capital structure started from 1950s, Modigliani and Miller (1958) told in the landmark thesis in 1958 that they assume a company’s investment policy is set in a per-fect market, for example, there are no taxes, efficient market and so on, and then the com-pany’s value will not be affected by the extent of debt. In the other word, the basis of the theory of capital structure is Modigliani and Miller theory. MM assume that if there is no tax in a perfect market, the “proposition 1” states that a firm cannot change the total value of its securities just by splitting its cash flows into different streams, in other words, the firm’s value is determined by its real assets, not by the debts or equity they issued, which means capital structure is irrelevant as long as the firm’s investment decisions are taken as given. The MM’s proposition 2 is the expected rate of return a firm expects to receive on their equity increases as a firm’s debt-equity ratio increases. This MM theory was addressed in 1958, which aroused many people who are interested in capital structure to study it. Many researches and thesis theories are based on the MM theory.
2.1.2 Development of MM theory
With the developing of capital market, more and more defects were proved in the original MM theory. Soon Modigliani and Miller published a new thesis in 1963; they realized taxes may have an important effect on capital structure, so they imported corporate income tax into MM theory. The new theory indicates that liabilities could help corporate to increase their value because of the tax shield, which means that the best capital structure should be 100% debts.
In 1977, Miller made another change of MM theory; he mentioned the influence by indi-vidual income tax. So this time, he put corporate tax and indiindi-vidual income tax into the theory. The conclusion is that capital structure has no effect on the value of the company or the cost of capital.
2.1.3Trade-off theory
An empirical study made by EH Kim (1978) showed the choice of capital structure. In this study, he showed moderate debts could increase companies’ value by tax shield. But once debts exceed a limit, the cost of bankrupt would balance out the tax shield benefits, which would lead to the decreasing of corporate value. In the mean time, Brennan and Schwartz (1978) also made research about this question; they explained that there would be two ways to affect the value of companies by issuing debts. One is by issuing debts could increase the tax savings if the firms survives; another one is reducing the probability of firms’ sur-vival. The optimal capital structure of a company would be when the marginal bankrupt cost is equal to marginal revenue of tax shield.
Trade-off theory indicates two features in debts financing, one is profitability, and one is the risk. This theory supplies a probability that a firm might get optimal capital structure, which is an improvement of capital structure.
2.1.4Pecking order theory
When a company did their business well, it always chooses to expand its business or require more capital invest more industries. What is important to expand business is capital. Capital could be divided with debt and equity. Every coin has two sides, it is same with debt. The advantage is with high debt, companies can have tax exemption also the holders of debt could get a fix revenue, and there is no need for shareholders to take out their profit to pay debt holders. It is a win-win mode. While the disadvantage of high debt is the higher debt a firm have, the higher risk a firm has to face to, which means the higher odds the firm is going to bankrupt then there is an economy hard time happens.
According to MM theory, a powerful company should have a high rate of debt. However, in the real world, most powerful companies don’t have high rates of debt. So Myers and Majluf (1984) tried to explain this problem, they proposed Pecking order theory based on many researches’ conclusions in 1984.
When firms decide to do a new investment, firms tend to internal financing. Because if a firm decides to issue equity to finance, the outsider investor would choose to believe that this company is lack of capital, which would result in a negative situation that the stock price dropping. Furthermore, the cost of external financing is relatively high, so firms are more likely to keep assets like internal financing, less risky debts and risky equity as a se-quentially selection.
In 1991 and 2003 Harris, Raviv (1991) and Myers (2003) they published two surveys based on MM theory, which are the famous competitive models of capital structure: the static tradeoff model and the pecking order hypothesis.
Harris and Raviv (1991) mentioned that the optimal capital structure does exist. If a com-pany set a target debt level and moving towards it, the firm’s optimal capital structure will be considered by managers about personal taxes, bankrupt cost and agency cost and so on. On the other hand, Myer’s pecking order hypothesis (2003) indicates that because there is no strong form of efficient market, which means there must have asymmetric information problem between insider and outsider investors, which lead to the optimal target debt Ratio doesn’t exist.
Although it is important to test which hypothesis is more convincing to explain the financ-ing of a company, however, until now there is no strong evident to prove which one is a suitable theory. Although Shyam-Sunder and Myers (1999) claimed that by using time-series explanatory power tested by statistical he proved the pecking order model is more convincing comparing with tradeoff model, there were also theses refuted their standpoints by many scholars, such as Chirinko and Singha (2000), Fama and French (2002), Booth, Aivazian, Demirguc-Kunt and Maksimovic (2001).
2.1.5Agency cost theory
Jensen and Meckling (1976) expounded the definition of agency cost in 1976; they ex-plained the influence to capital structure by agency issues. They think there are two kinds of interest conflicts, one is when outside shareholders exist in a firm, and it would lead to a different goal between principal and agency. Because of the asymmetric information and uncertain of investment environment, principal needs a system to monitor agency to do reasonable decisions in order to fulfill principal’s interest. The other conflict is the principal and agency has different option on a risky investment decision due to inequality of risk and profitability. In order to prevent this situation, principal would always choose to append
additional clause in contract or take measures to monitor agency, which will definitely in-crease the relevant cost. In this theory, the optimal capital structure is minimizing the agen-cy cost.
In conclusion, there is no accurate answer for the optimal capital structure. Trade-off theory and pecking order theory have a relatively neutral standpoint to debts-level in capital structure comparing with MM theory. They believe debts have advantages and disadvan-tages, moreover, trade-off theory confirmed the existence of optimal capital structure; agency cost theory thinks a high debts-level will increase monitoring cost which is not good for the firm’s profitability.
2.2Theory of corporate performance
2.2.1Basic definition about firm performance
Chinese and foreign researchers have different opinions about performance according to some theses. For Chinese scholar, Guobing Yang and Chunfang Li (2001) presented their idea on corporate performance; they think firm performance should be evaluated of a firm by asset operating, finance benefit, the preservation and increase of capital value in a cer-tain period.
Slywotzky, Morrison and Weber (2001) said operations situation, revenue growth and cus-tomer relationships are the three important indexes to measure firm performance. Fisher (1997) and Simchi-Leviet (2003) think the firms need considering the lead time to balance operating costs and service level performance to meet customers’ needs. After incorporat-ing the standpoint of Malhotra (2005), Groves and Valsaamakis (1998), Kalwani and Nara-vandas (1995) and Moorman (1995), firms performance should also be measured by mar-ket-focused performance, customers relationships and revenue growth.
From all point of views from many scholars the factors above are used to evaluate firm performance. However, among these indexes, operating performance is the most signifi-cant index to appraise firm performance, and it’s also the index that listed companies are trying to make this index become good.
2.2.2The measurements of firm performance A. Univariate effectiveness
Univariate effectiveness measures are the most popular indexes using into research, includ-ing Tobin’s Q value, EVA (economic value added), return on assets, rate of income on in-vestment, net profit margin and so on.
For that Tobin’s Q has taken time value of money into firm performance, which solves the problem that was pointed out by Benston (1985) there are deviations when they use aver-age accounting return to measure corporate performance, because the financial statement they use always the historical data, they cannot explain firms’ present or future value. Eva is also a commonly used index to measure corporate performance. Eva is used to compare net operating revenue with the same capital that investors used in other risky area. Univariate effectiveness measures cannot reflect other aspect during the company’s operat-ing; they only explain single area which is a kind of defect of this index.
B. Multivariate effectiveness
Zhijuan Chen (2006) mentioned Multivariate effectiveness Measures is used to cover the shortage comes from Univariate effectiveness measures. Firstly, it can measure many as-pects in firm performance. Secondly, using this index could avoid errors caused by subjec-tive judgment. Basically, there are two types index. One is The Balanced-scorecard; this in-dex includes financial indicators and non-financial indicators. BSC connects the perfor-mance from department, firm and the whole industry, which could help people to analyze data more objectively.
Analytic Hierarchy Process (AHP) is a theory of decision-making process with multi-criteria and multi-objective. It could simplify the complicated factors, which can help people to do comprehensive analysis.
Maybe because of the debates, many empirical researches about capital structure emerged in recent years; many of them start to focus on developing countries. In this thesis, I will explore the otherness of capital structure and firm performance between European and Chinese companies.
2.3Review of empirical studies of the relationship between capital
struc-ture and firm performance
2.3.1Empirical studies in western countries
In the past empirical researches, most of them were proved the positive correlation in firm performance and capital structure.
Masulis (1983) made a test to find out the relationship between the firm performance and debts level based on current corporate finance theories. He got the conclusion that there was a positive correlation in these two factors, and he also found out that if the debts level lies in 23% to 45% out of the company value, the influence will be obvious. Furthermore, the research also showed the positive correlation between stock price and financial leverage. Jordan, Lowe and Taylor (1998) compared the financial data of small firms in UK with questionnaires about the strategies when these firms made financial decisions. Results showed the positive correlation between tax rate, capital intensity, operating risk, and prof-itability with debt levels; and negative correlation between turnover sizes with debt levels. Simely and Li (2000) made an empirical study for corporate performance, capital structure and environment dynamic. The result indicates that the higher of financial ratio, the better the firm performance would be.
Frank and Goyal (2003) tested data of non-financial firms in USA within the period from 1950 to 2000; they think there was a positive correlation between book value of financial leverage ratio and firm performance.
Maloney, Mccormick and Mitchell (1993) tested the merger happened in 1962 to 1982 and the purchase in 1982 to 1986 between firms, they found out agency cost would affect firms’ capital structure; furthermore, they also got the result that returns will be greater with the higher leverage of the acquirer.
In the thesis from Titman and Wessels (1998), they explored the determinants of capital structure within 469 listed companies in America stock market with period of 1972 to 1982. However, in their conclusion explained there was a negative correlation between firm’s
profitability and debts level. Raghuram G. Rajan and Luigi Zingales (1995) they compared aggregate level, firm leverage is similar in the G-7 countries. And the result shows the nega-tive correlation between firm profitability and performance, and this relationship would be more obviously if the firm size gets bigger.
Booth et al. (2001) studied whether capital structure theory is portable across with different institutional structures countries, he proved it is similar that same variables will affect both in developing countries and in developed countries. But there are some national factors may influence some areas, for example inflation rate and speed of GDP growth and so on. The negative correlation was proved among firm’s profitable and total debt-ratio in most of these developing countries.
Chathoth and Olsen (2007) tested simultaneous impact on environment, firm strategy, and capital structure on firm performance by using US restaurant industry data. They got the conclusion that asset-liability ration and firm performance is negative correlated.
2.3.2Empirical studies in China
As we all know that the capital structure theory originated from western countries accom-pany with the free capital market competition mechanism, which result in the situation that western capital markets are way ahead of China. Fortunately for us is that more and more scholars pay attention to this area.
Zhengfei Lu and Yu Xin (1998) got the conclusion through comparing 35 listed companies in Shanghai Stock Market of the machinery and transportation equipment industry. Firstly, the firms’ profitability and long-term debt ratio are negative correlated. Moreover, there is no sufficient evidence to explain the relationship between the firm sizes, firm growth with capital structure.
Yichao Li and Zhensheng Jiang (2001) used Tobin’s Q value and asset-liability ratio to compare firm performance and capital structure. They chose 31 companies which have listed before 1992 with the period 1992 to 1999, but negative correlation was still proved. Negative correlation of firms’ Tobin’s Q value and debts-level could also be found in the thesis from Yi Pi (2004) and so on. Deming Zeng, Rong Zhou and Liyong Chen (2004) proved negative relationships in their thesis on return on asset, return on investments and debts-level.
Tingqiu Cao, Wenxiang Sun and Jianxia Yu (2004) use SPSS software to analyze 1494 ob-servations of 498 listed companies from Shanghai stock market and Shenzhen stock market within 1999 to 2001, they use P value (combines return of equity, return on asset and other values to describe firm performance.) They found there is negative correlation between debts-level and P value. However, proportion of the largest shareholder and negotiable share ratio lead to different relationships to different kind of firms.
Zhibiao Liu etc. (2003) combined industrial economics and capital structure, in their thesis, debts-level and products competitiveness are positive correlated, in the mean time, earning ratio per share was negative correlated with asset-liability ratio.
Jingda Wang and Jingwen Zhao (2004) used panel data to analyzed the impact factor of debts-level within 208 listed companies from 1997 to 2001, the result explains negative cor-related between profitability, corporate risk and debts-level, and positive correlation could be explored in firm sizes, corporate growth speed and debts-level.
Zuoping Xiao (2005) tested 204 non-financial listed companies from 1995 to 2002, the sult showed obviously negative correlation between asset-liability ratio and firm rate of re-turn on equity (ROE) again.
Guihai Huang and Frank M. Song (2006) tested 1200 Chinese listed companies to docu-ment their capital structures; while they found out that there is no obvious impact to state-owned enterprise of capital structure, however, leverage in Chinese firms increases with firm size and fixed assets, and decreases with profitability, non-debt tax shields. Chinese companies think more on long-term tax effect, and they always have lower long-term debts compare with foreign companies.
Zhaoguo Zhang, Weifeng He and Zhigang Liang (2007) compared the difference between state-owned and private companies with the period of 2000 to 2004. They found propor-tions of biggest shareholders and retained profits ratio are positive correlated with Tobin’s Q value, whereas current-liability ratio, long-term loan ratio and asset-liability ratio have significant negative correlation with Tobin’s Q value. In general the difference of capital structure lead to private firms has better performance then state-owned firms.
Ying Mao and Hong Zhao (2010) picked 648 listed companies in many industries from Shanghai Stock Market in 2004 to 2006 by using EVA appraisal method; the negative cor-relation was shown between EVA (net operating profit after tax) and asset-liability ratio, long-term loan ratio and short-term loan ratio except water, electricity and coal supply in-dustry.
Not all the thesis has negative correlation, Xixi Hong and Yifeng Shen (2000) made an em-pirical research of 121 industrial listed companies from Shanghai Stock Market, which indi-cates there is positive correlation between firms’ debts-level and profitability. Deping Chen and Yongsheng Chen (2011) found firm ownership concentration is positive correlated with rate on equity (ROE).
Table 2: Historical empirical researches (positive effects)
Correlation Authors Publishing
year Conclusion Positive correlation of firm performance and capital structure.
Masulis R W 1983 There was a positive correlation between firm performance and debts-level
Maloney,Mccormi
ck& Mitchell 1993 They got result that returns will be greater with the higher leverage of the acquirer. Jordan, Lowe and
Taylor 1998 Results showed the positive correlation between profitability with debts-levels Simely and Li 2000 The result indicates that the higher of financial
ratio, the better the firm performance would be Xixi Hong and
Yifeng Shen 2000 There is positive correlation between firms’ debts-level and profitability. Frank and Goyal 2003 There was a positive correlation between book
value of financial leverage ratio and firm performance.
Deping Chen and
I could easily find out that the diversity is very distinct in China and Western countries. Most conclusion of the foreign studies show similarity with capital theory, however, appar-ent contrasts are happening in Chinese capital market. It shows us that I still need to find out the reason to explain by different methods and data. In this thesis, I will try to looking for the secrets insider them.
I summarize the historical empirical studies in table 2 and table 3 for a clear overview. In table 2, we could see that most of the western researches get the conclusion that capital structure always has positive effects on firm performance, which reflects the capital struc-ture theory that debts-level is good for firms’ value.
In the analysis section, I will compare with these positive conclusions in my regression re-sult.
Table 3 shows the negative relationship between capital structure and firm performance, however, it contrasts with table 2 that these negative effects mostly are got from the Chi-nese researches in terms to the ChiChi-nese listed companies’ situation. The comparison shows significant difference among the listed companies in China and Europe. Also the conclu-sions in table 3 will be combined in the regression result analysis.
Table 3: Historical empirical researches (negative effects)
Correlation Authors Publishing
year Conclusion Negative correlation of firm performance and capital structure. Raghuram G. Rajan and Luigi
Zingales
1995 The result shows the negative correlation between profitability and debt-level, and this relationship
would be more obviously if the firm size gets bigger.
Titman and
Wessels 1998 There was a negative correlation between firm’s profitability and debts level Zhengfei Lu and
Yu Xin 1998 Firms’ profitability and long-term debt ratio are negative correlated. Yichao Li and
Zhensheng Jiang 2001 Negative correlation was proved between tobin’s Q value and asset liability ratio. Booth L,
Aivazian V, Demirguc‐Kunt
A, et al
2001 The negative correlation was proved among firm’s profitable and total debt-ratio in most of these
developing countries. Zhibiao Liu,
Fuxiu Jiang and Erpo Lu
2003 Earning ratio per share was negative correlated with asset-liability ratio.
Tingqiu Cao, Wenxiang Sun and Jianxia Yu
2004 There is negative correlation between debts-level and P value (combines return of equity, return on
asset and other values to describe firm performance.).
Jingda Wang and 2004 The result explains negative correlated between profitability, corporate risk and debts-level, and
Jingwen Zhao positive correlation could be explored in firm sizes, corporate growth speed and debts-level. Deming Zeng,
Rong Zhou and Liyong Chen
2004 Negative relationships was proved in their thesis on return on asset, return on investments and
debts-level.
Yi Pi 2004 Negative correlation of firms’ Tobin’s Q value and debts-level.
Zuoping Xiao 2005 The result showed obviously negative correlation between asset-liability ratio and firm rate of return
on equity. Guihai Huang
and Frank M. Song
2006 Leverage in Chinese firms increases with firm size and fixed assets, and decreases with profitability. Chathoth and
Olsen 2007 They got the conclusion that asset-liability ration and firm performance is negative correlated. Zhaoguo Zhang,
Weifeng He and Zhigang Liang
2007 They found proportions of biggest shareholders and retained profits ratio are positive correlated
with Tobin’s Q value, whereas current-liability ratio, long-term loan ratio and asset-liability ratio
have significant negative correlation with Q. Ying Mao and
Hong Zhao 2010 The negative correlation was shown between EVA (net operating profit after tax) and asset-liability ratio, long-term loan ratio and short-term loan
ratio in most industries.
According to the empirical researches, many people use Tobin’s Q value and debt-level as variables to measure firm performance and capital structure. In this thesis, I will analyze da-ta through Tobin’s Q value, debts-level too, with control variables as firm size, sales growth, asset growth and liquidity index to find out the relationship between firm performance and capital structure in two areas.
3Research methodology
3.1Sample set
This thesis encompasses 2 developed countries and a developing country in total for the period 2003-2012(because Amadeus database lack listed companies’ data from 2003 to 2004, I could only use data 2005 to 2011. However, the data I collect of Chinese listed companies from Chinese database are integrated.). These 3 countries are China, Sweden and Germany. The reason I choose Germany and Sweden is: firstly, these two countries behaves very good in decades, they are representative of Europe economy. Secondly, they are developed countries, their capital market have been developed over centuries. Moreo-ver, the governments of Sweden and Germany don’t often interrupt capital market, they advocate free market economy, and comply with the principles of market selection. In this condition, economy environment would be more reasonable, although, there may be some exploitable defects during the economy running. It is also necessary to declare that, the company management system would be more perfect after centuries’ development in these two countries. They behave more skilled on the use of market instruments comparing with the management of Chinese companies. Furthermore, I also take the fact into account that the performance among these countries during the international financial crisis and Euro-pean debt crisis. According to the result, I think Germany and Nordic countries are good examples, so I choose one of the Nordic countries. At last, there are many countries that their economy (GDP) is very good, but because of the reasons including working attitude, whether or not join the Euro zone and so on. I will not use the data from these countries. For example: Great Britain.
In this thesis, I collect 1212 listed firms in Germany and Sweden in total with the period of 2003 to 2011 from Amadeus database (some data cannot be found from 2003 and 2004). For the fast development in Chinese capital market, many companies stepped into stock market every year, which made a different number of listed companies in my sample. In Chinese listed companies sample, there 899 listed firm in 2003, 2004 and 2005, 940 firms in 2006, 1043 in 2007, 1065 in 2008, 1175 in 2009, 1481 in 2010 and 1786 listed companies in 2011. All the data was from Chinese CSMAR solution database. All types of listed compa-nies would be available; no matter they are big or small, and 1212 listed compacompa-nies from Sweden and Germany for 9 years.
3.2Data description
According to the questions raised in the beginning and the goals in this thesis, the variables I choose will be representative. Therefore, I could compare the results more clearly, and these variables could be observed their interactions more directly.
3.2.1Explained variables
Tobin’s Q value (Q)
Tobin’s Q theory is developed by Tobin (1999); it measures how the stock market eva-luates the firms. KH Chung and SW Pruitt (1994) pointed out that it is a good value to ob-serve firm’s performance. Because Tobin’s Q cannot be found in some database (especially in European database) or in the firms’ annual reports, I have to use equations to calculate them out. (See equation 3.1)
Chuang and Pruitt (1994) said in their thesis that if the Q value is between 0 and 1, then the firm is correctly valued. If the Q is bigger than 1, this indicates there might be other factors
influence the value of the firm. However, these factors are hard to detect in the annual re-port.
Tobin′s Q =Equity market value +Liabilities market val ue
Equity book value +Liability book value (Equation 3.1)
However, there are only data from 2005 to 2011 in Amadeus, which is a pity that I have to reduce my analyzing period. In the CSMAR solution database, I could easily get listed companies’ Tobin’s Q values in 9 years.
3.2.2Explanatory variables
Debts-level (LEV)
Debts-level is a ratio of total debt to total assets, it is a significant value to describe firm’s capital structure situation in many theses. The essence of capital structure is the variable like short-term debts, long-term debts etc, which are used to financing by firms. It means I could use Debt-level or debt-equity ratio to explain a firm’s capital structure. In this thesis, I choose to use debt-level as the value to explain listed firms’ capital structure. However, this value cannot get from Amadeus database either. In order to get the Asset-liability ratio (Debt-level), I adopt the widely used equation to calculate them out (See equation 3.3). As we all know that total debt should be long-term debt plus current liability.
LEV = total debt
total assets (Equation 3.3)
3.2.3Control variables
Although these variables are not used to measure firm performance or capital structure, they do have relationship with them, which could make different result without considering these variables. In order to make the analysis more reasonable, I will add these variables in-to the whole model.
A. Firm size (Size)
Firm size is the natural logarithm of total assets (See equation 3.4). The reason why I loga-rithm of total asset is that, firstly, it doesn’t change the monotonicity; it still could reflect the change trend of the original variables. Secondly, the slope after taking logarithm could directly reflect the growth speed of variables. Fixed cost should be considered into the firms’ capital structure adjustment, and it will produce diverse effect to big and small com-panies. In the competitive market, different firm sizes would have diverse competitiveness in various industries. Some firms in IT industry, the smaller the company is, the better the performance would be. However, for the companies like retail industry, big firm size will help them to develop both in logistics and selling. To a great extend, firm size decides the firm performance, moreover, because of the different firm size, the capital structure may not similar with each other. How the firm size affects firm performance and capital struc-ture? I will show the results in the empirical study.
Firm size = ln(total assets) (Equation 3.4)
B. Asset growth
General speaking that a healthy developing firm will have a steady asset growth ratio, the higher of asset growth ratio to a firm indicates the faster speed of expansion of business scale. This value reflects the operating situation directly or indirectly (See equation 3.5).
Asset growth ratio =total asset end of the year −total asset beginning of the year
total asset end of last year (Equation 3.5)
C. Sales growth
Sales growth ratio is a value to measure firm’s growth condition and development ability (See equation 3.6). Higher ratio is good for firm performance. Sales growth may have influ-ence to firm performance, in order to minimize the influinflu-ence; I took sales growth as con-trol variable.
Sales growth ratio =sa les end of the year −sales beginning of the year
sales end of last year (Equation 3.6)
D. Liquidity index (Liquidity)
Liquidity index is a ratio of cash flow to total assets. (See equation 3.7) Cash flow is impor-tant to enterprise operation, and it will affect the firm performance. So I need to eliminate the interference during the analysis.
Liquidity index = cash flow
total asset (Equation 3.7)
3.3Regression models
After discussing the variables and the time period, I will introduce the regression model in my thesis.
Qi = β0+ β1Levit + β2Sizeit+ β3Assetgrowthit + β4Salesgrowthit + β5Liquidit +
εit (3.8)
Where i denotes the cross-section dimension and t indicated the time dimension, which is time-series cross sectional data here, εit is disturbance item and βi is the coefficient of each
variable. The model is used to describe the relationship between capital structure and firm performance.
Although, there are many ways to achieve this purpose, I will choose ordinary least square method (OLS) statistic regression and descriptive statistics to analyze by the software of Eviews 7.0 and Stata 12.0 instead of interview analysis; this method is easy to find out the effect to firm performance through regression coefficient.
3.4Research predictions
I have some predictions about my regression result based on the model aimed at data anal-ysis made in 3.3 and historical researches as follows:
1. Capital structure (debts-level) may have a negative effect on firm performance in China (Tobin’s Q value) in the beginning, and a positive effect on European listed companies. Firm performance is a very important index to measure the quality of a corporate. Un-der the condition of asymmetric information, a good performance company will have a high ratio of debts-level in order to show difference with bad performance corporate, moreover, bad performance corporate will not choose to have a high debts-level, for it will bring them high risk.
2. After a long time developing in China’s capital market, the relationship of capital struc-ture and firm performance should change to positive effects instead of negative effects. 3. The debts-level should have a continuing increasing in Chinese listed companies from
2003 to 2011, and the debts-level in European listed companies should keep a still level within 2005 to 2011.
4Empirical study and analysis
In this section, I will analyze the regression results of the listed companies’ data from three countries. The analysis will be divided into 3 parts. Part one is the overview of descriptive statistics and regression result of Chinese and European companies. Annual results and de-scriptive statistics in details will be discussed in part 2 and part 3 separately. LEV means the debts-level, size refers to firm size, LIQUID means liquidity index and C indicates the in-tercept of β0 in the model.
4.1Comprehensive compare of Chinese and European regression result
2003-2011
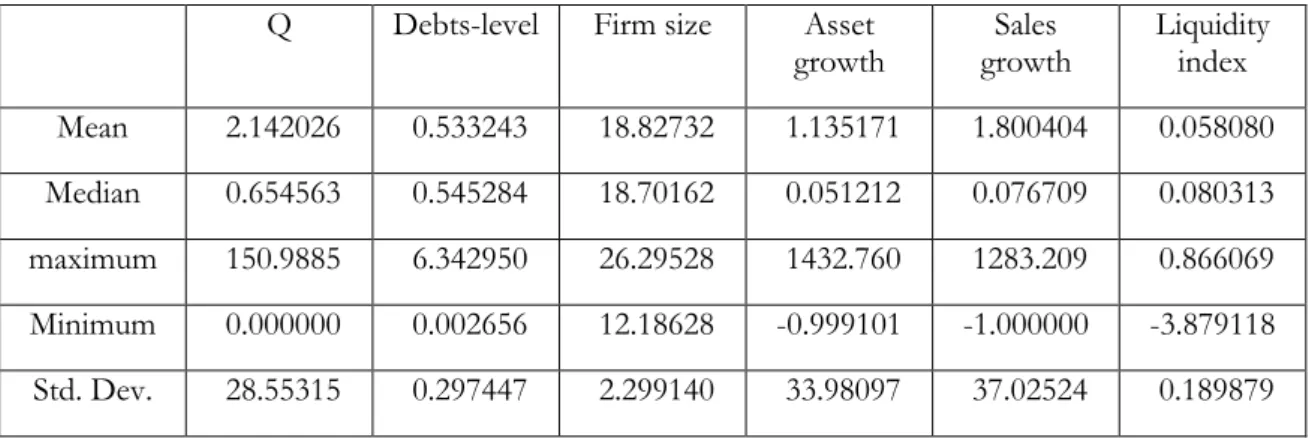
Table 4 and table 5 show the descriptive statistics of Chinese and European (Germany and Sweden) listed companies during 9 and 7 years separately, it is clearly that the mean value of Tobin’s Q is 1.51 in China and 2.14 in Europe two countries. This suggests the firm per-formance in Europe is better than Chinese listed companies overall. The Q value is 20 times between maximum and minimum value, however it is much larger in European companies (max value 150.9885, min value 0.), which explains the firm performance in two regions has a big gap especially in Europe. As to the capital structure of debts-level, Euro-pean companies is higher than Chinese companies in general, they have a mean value of 53.32%, whereas 45.86% was reflected in Chinese companies. Raghuram G. Rajan and Luigi Zingales (1995) shows that debts-level in America, Japan, Germany, France, Italy, Great Britain and Canada are 58%, 69%, 73%, 71%, 70%, 54% and 56% respectively, and they are all greater than 50% level. The research from Booth et al. (2001) shows the debts-level in developing countries of Brazil, Mexico, Malaysia, and Zimbabwe are 30%, 35%, 43% and 42% respectively, they are all less than 50% level. This situation is similar like Chinese debts-level. Debts-level indicates the unbalanced developing of Chinese capital market, where has a quickly development of stock market, and bond market keep a slow speed of developing. Zuoping Xiao (2005) also mentioned small number of Chinese investing or-ganizations; Chinese creditors’ interests cannot be protected with a high cost of legal sys-tem and overvalued of stock price in general which make more companies tend to equity finance are the factors caused by a low level of debts-level. In terms to firm size and li-quidity index, similar situation could be found in two regions, where Chinese companies have a little higher value in firm size. European companies have a much higher mean value of asset growth and sales growth, and they are 1.14 and 1.8 which are 5 and 3 times respec-tively to Chinese companies, it indicates European companies have a healthier and faster speed of growth contrasting to Chinese companies.
Table 4: Descriptive statistics in China 2003-2011 (Number of observations is 10054.) Q Debts-level Firm size Asset
growth growth Sales Liquidity index Mean 1.513167 0.458566 21.52210 0.241429 0.582748 0.050655 Median 1.179162 0.474366 21.40518 0.127149 0.119445 0.050037 maximum 21.83288 0.995922 26.94946 7.609056 99.57936 1.069040 Minimum 0.250091 0.007080 17.53674 -0.784853 -3.406524 -0.565469
Table 5: Descriptive statistics in European 2005-2011 Q Debts-level Firm size Asset
growth growth Sales Liquidity index Mean 2.142026 0.533243 18.82732 1.135171 1.800404 0.058080 Median 0.654563 0.545284 18.70162 0.051212 0.076709 0.080313 maximum 150.9885 6.342950 26.29528 1432.760 1283.209 0.866069 Minimum 0.000000 0.002656 12.18628 -0.999101 -1.000000 -3.879118 Std. Dev. 28.55315 0.297447 2.299140 33.98097 37.02524 0.189879 Number of observations is 3349.
During 2003 to 2011, there were a continually increasing number of suitable observing stocks because of the fast development of Chinese capital market. In this regression, there are 10053 observations, and number of sample is 110054. As to the European regression, there are 3349 observations, and the number of sample is 13429.
Table 6: Regression result in China 2003-2011
Variable Coefficient Std. Error t-statistic Prob.
LEV -1.281314 0.058033 -22.07895 0.0000 SIZE -0.146352 0.010512 -13.92232 0.0000 ASSET GROWTH -0.071067 0.021783 -3.262416 0.0011 SALES GROWTH 0.003776 0.003141 1.202284 0.2293 LIQUID 1.552408 0.119496 12.99128 0.0000 C 5.186861 0.216628 23.94365 0.0000 Number of observations is 10054.
I have discussed about that Tobin’s Q value indicates firm performance and debts-level (Asset-liability ratio) is used to describe firm’s capital structure. From a whole period view in 9 years I get the Chinese companies’ regression result is showed in table 6; it basically re-flects the expectation of most previous Chinese researches. As the coefficient is -1.2813, which means debt-level has negative effect on Tobin’s Q. 1% increasing on leverage will lead to a 1.28% decreasing of Q value. As the probability is equal to 0 which is smaller than critical value of 10%, in the mean time, t-statistic is -22.079, and this explains a significantly negative correlation between capital structure and firm performance. The outcome also confirms the conclusions in empirical studies from Guihua Huang & Frank Song (2006),
Chao Chen & Yulei Rao (2003), Dongzhi Yu (2003) and most regression results of Chinese listed companies. However, the negative relationship is different from my prediction of model, although China’s capital market has developed for decades, the relationship be-tween capital structure and firm performance still doesn’t fit the assumption.
Besides the debts-level, firm size and asset growth also significant negatively affects with Q value, although this relationship is not too strong. It is still different from my imagination. Only sales growth and liquidity index shows positive relationship with Q value, if liquidity index booms 1%, the Q value will increase 1.5524%. However the correlation is not signif-icant on sales growth because of the probability is bigger than 0.1.
This result tells us that most Chinese listed companies tend not to finance through issuing debts, because it is no good for firm performance if a company issues debts to finance in Chinese domestic investing environment. Moreover, most Chinese listed companies’ per-formance depends on the cash flow, the higher proportion of cash flow, the better benefits they will have.
Table 7: Regression result in Europe 2005-2011
Variable Coefficient Std. Error t-statistic Prob.
LEV 2.695043 1.810857 1.488270 0.1368 SIZE -1.495631 0.226352 -6.607553 0.0000 ASSET GROWTH 0.001357 0.021326 0.063633 0.9493 SALES GROWTH -0.002493 0.019569 -0.127375 0.8987 LIQUID 7.633934 2.835378 2.692387 0.0071 C 28.42320 4.100060 6.932385 0.0000 Number of observations is 3349.
In terms of the listed companies in Sweden and Germany, the result seems more reasona-ble than it in China, although there is an absence of 2-year data.
From the table 7, the empirical evidence shows the coefficient of debts-level (LEV) ratio is 2.695, and every 1% growing of LEV will drive 2.695% growth of Tobin’s Q value. How-ever, 0.1368 of p value which is bigger than 0.1 and 1.4883 of t-statistic value indicates non-significant effect could be explained between LEV and Q value; in that case, firm per-formance has no significant relationship with capital structure during 2005 to 2011. Al-though the positive correlation outcome is similar with AN Berger & E Bonaccorsi (2006) that higher leverage is helpful to increase the firm value and it was proved by RM Simerly and Li (2000) as I mentioned too, theoretically, they should be significantly positive corre-lated. The reason caused by the non-significantly p value is because of the impact from fi-nancial crisis in my opinion; I will also test the effects before and after fifi-nancial crisis in Chinese and European companies later.