http://www.diva-portal.org
Preprint
This is the submitted version of a paper published in Journal of Empirical Software Engineering.
Citation for the original published paper (version of record):
Alegroth, E., Feldt, R., Ryrholm, L. (2015)
Visual GUI testing in practice: challenges, problemsand limitations.
Journal of Empirical Software Engineering, 20(3): 694-744
http://dx.doi.org/10.1007/s10664-013-9293-5
Access to the published version may require subscription.
N.B. When citing this work, cite the original published paper.
Permanent link to this version:
Noname manuscript No. (will be inserted by the editor)
Visual GUI Testing in Practice: Challenges, Problems and Limitations
Emil Al´egroth · Robert Feldt · Lisa Ryrholm
Received: date / Accepted: date
Abstract In today’s software development industry, high-level tests such as Graphical User Interface (GUI) based system and acceptance tests are mostly performed with manual practices that are often costly, tedious and error prone. Test automation has been proposed to solve these problems but most automation techniques approach testing from a lower level of system abstraction. Their suitability for high-level tests has therefore been questioned. High-level test automation techniques such as Record and Replay exist, but studies suggest that these techniques suffer from limitations, e.g. sensitivity to GUI layout or code changes, system implementation dependencies, etc.
Visual GUI Testing (VGT) is an emerging technique in industrial practice with perceived higher flexi-bility and robustness to certain GUI changes than previous high-level (GUI) test automation techniques. The core of VGT is image recognition which is applied to analyze and interact with the bitmap layer of a system’s front end. By coupling image recognition with test scripts, VGT tools can emulate end user behavior on almost any GUI-based system, regardless of implementation language, operating system or platform. However, VGT is not without its own challenges, problems and limitations (CPLs) but, like for many other automated test techniques, there is a lack of empirically-based knowledge of these CPLs and how they impact industrial applicability. Crucially, there is also a lack of information on the cost of applying this type of test automation in industry.
This manuscript reports an empirical, multi-unit case study performed at two Swedish companies that develop safety-critical software. It studies their transition from manual system test cases into tests auto-mated with VGT. In total, four different test suites that together include more than 300 high-level system test cases were automated for two multi-million lines of code systems. The results show that the transitioned test cases could find defects in the tested systems and that all applicable test cases could be automated. However, during these transition projects a number of hurdles had to be addressed; a total of 58 different CPLs were identified and then categorized into 26 types. We present these CPL types and an analysis of the implications for the transition to and use of VGT in industrial software development practice. In addition, four high-level solutions are presented that were identified during the study, which would address about half of the identified CPLs.
Furthermore, collected metrics on cost and return on investment of the VGT transition are reported together with information about the VGT suites’ defect finding ability. Nine of the identified defects are reported, 5 of which were unknown to testers with extensive experience from using the manual test suites. The main conclusion from this study is that even though there are many challenges related to the transition and usage of VGT, the technique is still valuable, flexible and considered cost-effective by the industrial practitioners. The presented CPLs also provide decision support in the use and advancement of VGT and potentially other automated testing techniques similar to VGT, e.g. Record and Replay.
Keywords Visual GUI Testing · Industrial case study · Challenges, Problems and Limitations · System and acceptance test automation · Development cost
Emil Algroth
Department of Computer Science and Engineering
Chalmers University of Technology & University of Gothenburg SE-412 96 Gothenburg, Sweden
Tel.: +46703-338022
1 Introduction
Currently available automation techniques for high-level testing, i.e. GUI-based system and acceptance test-ing, leave more to be desired in terms of cost efficiency and flexibility, leaving a need for more empirical re-search into test automation [Rafi et al(2012)Rafi, Moses, Petersen, and Mantyla,Guti´errez et al(2006)Guti´errez, Escalona, Mej´ıas, and Torres,Berner et al(2005)Berner, Weber, and Keller,Grechanik et al(2009a)Grechanik, Xie, and Fu,Horowitz and Singhera(1993),Sj¨osten-Andersson and Pareto(2006),Zaraket et al(2012)Zaraket, Masri, Adam, Hammoud, Hamzeh, Farhat, Khamissi, and Noujaim, Finsterwalder(2001)]. These reported drawbacks with current automation techniques is one factor why manual testing is persistently used in indus-trial practice even though it is considered costly, tedious and error prone [Grechanik et al(2009c)Grechanik, Xie, and Fu, Grechanik et al(2009a)Grechanik, Xie, and Fu, Finsterwalder(2001), Leitner et al(2007)Leitner, Ciupa, Meyer, and Howard,Memon(2002),Dustin et al(1999)Dustin, Rashka, and Paul,Cadar et al(2011)Cadar, Godefroid, Khurshid, Pasareanu, Sen, Tillmann, and Visser].
Manual testing has long been the main approach for testing and quality assurance in software industry and in recent years there has been a renewed interest in approaches such as exploratory testing that focus on the creativity and experience of the tester [Itkonen and Rautiainen(2005a)]. The more traditional manual tests are often pre-defined sets of steps performed on a high level of system abstraction to verify or validate system conformance to its requirement specification, i.e. system tests, or that the system behaves as ex-pected in its intended domain, i.e. acceptance tests [Miller and Collins(2001), Hsia et al(1997)Hsia, Kung, and Sell, Hsia et al(1994)Hsia, Gao, Samuel, Kung, Toyoshima, and Chen, Myers et al(2011)Myers, San-dler, and Badgett]. However, software is prone to change and therefore requires regression testing [Onoma et al(1998)Onoma, Tsai, Poonawala, and Suganuma, Rothermel et al(2001)Rothermel, Untch, Chu, and Harrold], which can lead to excessive costs since testers continuously need to re-test. Manually having to repeatedly follow the same test descriptions and look for the same problems is also tedious and error prone. To mitigate these problems, whilst retaining or increasing the end quality of the software being tested, automated testing has been proposed as a key solution [Dustin et al(1999)Dustin, Rashka, and Paul]. Many automated test techniques approach testing from lower levels of system abstraction, e.g. unit tests [Olan(2003), Gamma and Beck(1999),Cheon and Leavens(2006)], which make them a powerful tool for finding component and function level defects. However, the use of these techniques for high-level testing has been questioned since empirical evidence suggests that high-level tests based on low-level test techniques become complex, costly and hard to maintain [Berner et al(2005)Berner, Weber, and Keller,Grechanik et al(2009a)Grechanik, Xie, and Fu].
Thus, a considerable body of work has been devoted to high-level test automation, resulting in techniques such as coordinate- and widget/component-based Record and Replay with a plethora of tools such as Selenium [Holmes and Kellogg(2006)], JFCUnit [Hackner and Memon(2008)], TestComplete [Vizulis and Diebelis(2012)], etc. The tools record the coordinates or properties of GUI-components during manual user interaction with the system’s GUI. These recordings can then be played back to emulate user interaction and assert system correctness automatically during regression testing. However, empirical studies have identified limitations with these techniques. They are typically sensitivity to GUI layout or code change and the tools are dependent on the specifics of the system implementation, etc., which negatively affect the techniques’ applicability and raises the cost of maintaining the tests [Horowitz and Singhera(1993), Sj¨osten-Andersson and Pareto(2006), Grechanik et al(2009b)Grechanik, Xie, and Fu, Berner et al(2005)Berner, Weber, and Keller].
Visual GUI Testing is an emerging technique in industrial practice that combines scripting with image recognition in open source tools such as Sikuli [Yeh et al(2009)Yeh, Chang, and Miller], and commercial tools such as JAutomate [Alegroth et al(2013b)Alegroth, Nass, and Olsson]. Image recognition provides support for emulating user interaction with the bitmap components, e.g. images and buttons, shown to the user on the computer monitor and can therefore enable testing of GUI-based systems, regardless of their implementation, operating system or even platform. Empirical research has shown the technique’s industrial applicability for high-level test automation with equal or even better defect finding ability than its manual counterparts [B¨orjesson and Feldt(2012), Alegroth et al(2013a)Alegroth, Feldt, and Olsson]. However, VGT is not without its challenges, problems or limitations (CPLs), such as CPLs related to tool immaturity, image recognition volatility and limitations in use for highly animated GUIs. These CPLs have not been sufficiently explored in existing research and it is thus hard to give a balanced description of VGT to industrial practitioners as well as advice and help them in successfully applying the technique. Furthermore, we make no distinction between the three CPL subtypes in this paper, i.e. between challenges, problems and limitations, since a challenge in one context could be a problem in another. As such, we define a CPL as a challenge, problem or limitation that hinders the transition to or usage of VGT in a given context
but where no distinction is made between the three CPL subtypes since their impact in different contexts will vary.
In this paper we present an empirical study performed at two different companies within the Swedish defense and security systems corporation Saab, in which two teams transitioned existing, manual system test cases to VGT test scripts. The two projects were independent from each other and in two different sites, one driven by a researcher and the other by industrial practitioners, yet both projects provided cor-roborating results. However, due to differences between the study contexts, this manuscript will report both corroborated, generalized, results and context dependent results. Context dependent results are reported together with the factors that affect their generalizability.
During the study, a total of 58 CPLs were identified that were categorized into 26 unique CPL types that affect either the transition to or usage of VGT in industrial practice. These CPL types have implications for the industrial applicability of VGT but also other automated test techniques, e.g. adding frustration, confusion and cost to the transition and usage of the techniques. Consequently, the results of this study contribute to the general body of knowledge on automated testing, which is currently lacking empirical evidence regarding CPLs [Rafi et al(2012)Rafi, Moses, Petersen, and Mantyla]. We also present several CPL types that are present for other test techniques, e.g. how to synchronize scripts and the SUT, common to Record and Replay tools, misalignment between system implementation and specification which affects all testing, etc.
In addition, several solutions were identified during the study that solve most of the identified CPL types. However, since most of these solutions were ad hoc, and the focus of this work is on the VGT CPLs, only four general solutions will be presented. These solutions solve roughly half of the identified CPL types and provide guidance to industrial practitioners that intend to evaluate or use the technique.
Furthermore, quantitative information regarding the VGT suites’ defect finding ability, the VGT suites’ development costs and the projects’ evaluated return on investment are presented. This information can provide decision support for industrial practitioners regarding the potential value and cost of transitioning their manual testing to VGT. Based on these results we draw a conclusion regarding the CPLs implications on the cost-effectiveness, value and applicability of VGT for high-level test automation in industry.
We also present, based on results from literature, that not only are the identified CPLs and solutions to said CPLs general for other VGT tools, but other test techniques as well. Thus providing a more general contribution of empirical results to the software engineering body of knowledge.
To summarize, the specific contributions of this work for test researchers and industrial practitioners are:
– Detailed descriptions of the challenges, problems and limitations (CPLs) that impact either the transi-tion to, or usage of, VGT in industry.
– Descriptions of identified practices, from the industrial projects, which solve or mitigate CPLs that impact the transition to, or usage of, VGT in industry.
– Quantitative information on the defect finding ability of the developed VGT suites compared to the manual test suites that were used as specification for the automated tests.
– Detailed information on the cost of transition, usage and return on investment of the VGT suites in comparison to the cost of manual test suite execution.
The next section, Section 2, presents a background to manual testing and GUI-based testing as well as related work on previously used GUI-based test techniques and VGT. Sections 4 presents the results from the study, including identified VGT related CPLs, solutions to said CPLs, VGT bug finding ability, metrics on the cost of transitioning to VGT and ROI metrics. Section 5, presents a discussion regarding the results, future work, as well as the threats to validity of the study. Finally Section 7 will conclude the paper.
2 Background and Related work
The purpose of high-level testing, e.g. system and acceptance testing, is to verify and/or validate sys-tem conformance to a set of measurable objectives for the syssys-tem, i.e. the syssys-tem’s requirements [Myers et al(2011)Myers, Sandler, and Badgett]. These tests are generally performed on a higher-level of system abstraction since their goal is to test the system in its entirety, which also makes them hard to automate, generally requiring large and complex test cases. Tests that are particularly hard to automate are non-functional/quality requirements (NFR) conformance tests for NFRs such as usability, user experience, etc. The reason is because NFRs differ from the functional requirements since they encompass the system in its entirety, i.e. they depend on the properties of a larger subset, or even all, of the functional components.
Hence, for a non-functional/quality requirement to be fulfilled, all, or most, of the components of the sys-tem have to adhere to that requirement, which is verified either during syssys-tem or acceptance testing of the system. Both system and acceptance tests are, in general, based around scenarios [Regnell and Rune-son(1998), Memon et al(2003)Memon, Banerjee, and Nagarajan], but with the distinction that system tests only aim to verify the functionality of the system. In contrast, acceptance tests aim to validate the system-based on end user scenarios, i.e. how the system will be used in its intended domain. Note that we use the word scenario loosely in this context, i.e. not just documented scenarios, e.g. use cases, but ad hoc scenarios as well. These tests should, according to [Miller and Collins(2001),Hsia et al(1997)Hsia, Kung, and Sell,Hsia et al(1994)Hsia, Gao, Samuel, Kung, Toyoshima, and Chen,Myers et al(2011)Myers, Sandler, and Badgett], be performed regularly on the system under test (SUT), preferably using automated testing. Automated testing is proposed because both manual system and acceptance testing are suggested to be costly, tedious and error-prone [Grechanik et al(2009c)Grechanik, Xie, and Fu, Grechanik et al(2009a)Grechanik, Xie, and Fu, Finsterwalder(2001), Leitner et al(2007)Leitner, Ciupa, Meyer, and Howard, Memon(2002), Dustin et al(1999)Dustin, Rashka, and Paul]. Therefore, a considerable amount of research has been devoted to high-level test automation techniques, which has resulted in both frameworks and tools, including graphical user interface (GUI) based interaction tools [Lowell and Stell-Smith(2003), Andersson and Bache(2004)].
GUI-based test automation has received a lot of academic attention, with research into both high-level functional requirement and NFR conformance testing, as shown by Adamoli et al. [Adamoli et al(2011)Adamoli, Zaparanuks, Jovic, and Hauswirth]. In their work on automated performance testing they identified 50 ar-ticles related to automated GUI testing using different techniques. One of the most common techniques they identified was capture/Record and Replay (R&R) [Adamoli et al(2011)Adamoli, Zaparanuks, Jovic, and Hauswirth, Andersson and Bache(2004), Memon(2002)]. R&R is a two step approach, where user in-put, e.g. mouse and keyboard interaction performed on the SUT, are first captured in a recording, e.g. a script. In the second step, the recording is replayed to automatically interact with the SUT to assert correctness during regression testing. However, different R&R techniques capture recordings on differ-ent levels of system abstraction, i.e. from a GUI compondiffer-ent level to the actual GUI bitmap level shown to the user on the computer’s monitor. The GUI bitmap level R&R techniques drive the test scenar-ios by replaying interactions at exact coordinates on the monitor, i.e. where the GUI interactions were performed by the user during recording. However, the assertions are generally performed on lower levels of system abstraction, i.e. component level, but some tools also support bitmap comparisons. In contrast, widget/component-based R&R techniques are performed completely on a GUI component level, i.e. by cap-turing properties of the GUI-components during recording and using these properties, in combination with direct interaction with the GUI components, e.g. invoking clicks, to perform interaction during playback. However, both of these techniques suffer from different limitations that affect their robustness, usability, cost, but foremost their maintainability, suggested by empirical evidence related to the technique [Memon and Soffa(2003),Zaraket et al(2012)Zaraket, Masri, Adam, Hammoud, Hamzeh, Farhat, Khamissi, and Nou-jaim, Finsterwalder(2001), Li and Wu(2004), Grechanik et al(2009b)Grechanik, Xie, and Fu, Horowitz and Singhera(1993)]. The coordinate-based R&R techniques are sensitive to GUI layout change [Memon(2002)], e.g. changing the GUI layout will cause the script to fail, whilst being robust to changes in the code of the tested system. Widget/component-based R&R techniques are instead sensitive to API or code structure change, whilst being robust to GUI layout change [Sj¨osten-Andersson and Pareto(2006)]. In addition, the technique can pass test cases that a human user would fail, e.g. if a widget blocks another widget, the use of direct component interaction still allows the tool to interact with the hidden widget. Furthermore, because direct component interaction is used, the technique requires more direct access to the SUT, for instance through hooks added into the SUT or access to its GUI library, e.g. Java Swing, PyGTK, Eclipse RCP, etc., which limits the tools’ applicability. In addition, these tools can generally only interact with one GUI library at a time and also require special interaction code to be developed to interact with custom GUI components. Some exceptions exist, e.g. TestComplete [smartbear(2013)], which supports many different programming languages, or even interaction with the Windows operating system, but not other operating systems, e.g. MacOS. Hence, even though previous techniques have properties that support their use for high-level testing, they still suffer from limitations that perceivably limit their use for systems written in different programming languages, distributed systems, and cloud-based systems where access to the backend is limited. Thus, indicating that there is a need for more research into high-level test automation.
Visual GUI Testing is an emerging technique in industrial practice that uses tools with image recognition capabilities to interact with the bitmap layer of a system, i.e. what is shown to the user on the computer’s monitor. Several VGT tools are available to the market, including both open source, e.g. Sikuli [Chang et al(2010)Chang, Yeh, and Miller], and commercial, e.g. JAutomate [Alegroth et al(2013b)Alegroth, Nass, and Olsson], but still the technique is only sparsely used in industry. VGT is performed by either manual
development, or recording, of scripts that define the intended interaction with the SUT, usually defined as scenarios, which also include images of the bitmap-components the tools should interact with, e.g. buttons. During script execution, the images are matched, using image recognition, against the SUT’s GUI and if a match is found an interaction is performed. This capability is also used to assert system correctness by comparing expected visual output with actual visual output from the SUT. Hence, VGT uses image recognition both to drive the script execution and assert correctness compared to previous techniques where image recognition was only used in some tools for assertions. Furthermore, VGT is a blackbox technique, meaning that it does not require any knowledge of the backend and can therefore interact with any system, regardless of implementation language or development platform, e.g. desktop (Windows, MacOS, Linux, etc.), mobile (iPhone, Android, etc.), web (Javascript, HTML, XML, etc.).
In our previous work [B¨orjesson and Feldt(2012)], we performed an empirical, comparative, study with two VGT tools to identify initial support for the technique’s industrial applicability. The tools, Sikuli and CommercialTool1, were compared based on their static properties as well as their ability to automate industrial test cases for a safety-critical air traffic management system. 10 percent of the tested system’s manual test cases were automated with both tools, which showed that there was no statistical significant difference between the tools and that both tools were fully capable of performing the automation with equal defect finding ability as the manual test cases. However, the study was performed by academic experts in VGT and therefore a second study was performed, driven by industrial practitioners in an industrial project [Alegroth et al(2013a)Alegroth, Feldt, and Olsson]. Results of the second study showed that VGT is also applicable when performed in a real project environment when used by industrial practitioners under real-world time and cost constraints. Thus, providing further support that VGT is applicable in industry.
The study presented in this paper builds on our previous work but with another focus. Whilst the previous works have focused on the applicability of VGT, with successful and corroborating results that such is the case, this study focuses on the challenges, problems and limitations of VGT. Thus, information that is currently missing in the academic body of knowledge [Rafi et al(2012)Rafi, Moses, Petersen, and Mantyla]. Hence, this work aims to provide a more balanced view of the benefits and drawbacks of the technique based on empirically collected information. As such, providing both researchers and industrial practitioners with insights as to what hurdles they should focus on in research or expect when transitioning to VGT in practice. Furthermore, we also present the adaptations and architectural solutions that were taken in order for the companies to be successful in their VGT transition. Thus, contributing to research application rather than fundamental research of the technique and its tools. In addition, since the observed CPLs and solutions to said CPLs are identified to be generic for contexts other than VGT, our results and conclusions also provide a more general contribution to the academic body of knowledge regarding automated testing.
A general conception within the software engineering community is that automated testing is key to solving all of industry’s test-related problems. However, Rafi et al. [Rafi et al(2012)Rafi, Moses, Petersen, and Mantyla] that performed a systematic literature review regarding the benefits and limitations of au-tomated testing, as well as an industrial survey on the subject, found little support for this claim. In their work, they scanned 24,706 academic reports but only found 25 reports with empirical evidence of the benefits and limitations of automated testing. Additionally, they found that most empirical work focus on benefits of automation rather than the limitations. Furthermore, the survey they conducted showed that 80 percent of the industrial participants, 115 participants in total, were opposed to fully automating all testing. In addition, they found that the industrial practitioners experienced a lack of tool support for automated testing, e.g. the tools are not applicable in their context, have high learning curves, etc. Consequently, their work shows that there are gaps in the academic body of knowledge regarding empirical work focusing on the benefits and in particular the limitations of automated testing as well as the actual needs for test automation in industry. A gap that this work helps to bridge by explicitly reporting on the challenges, problems and limitations related to high-level test automation using VGT.
3 Industrial case study
The empirical study presented in this manuscript consisted of two VGT transition projects. VGT tran-sition/automation is in this study defined as the practice or process of manually writing or recording a VGT test script that automatically performs GUI-based interactions and assertions on the system under test equivalent to a manual test case for said system under test. As such, a VGT (test) script is defined
as a programming artifact with coded interactions and GUI bitmaps that can be executed to autonomously stimulate a system under test through its GUI for test or automation purposes.
The first VGT transition project was performed at the company Saab AB, in the Swedish city of Gothen-burg, building upon our previous work [B¨orjesson and Feldt(2012)]. The VGT transition was performed by a research team member with no prior knowledge of Saab or VGT but with frequent support from the research team. Focus was therefore on the applicability of VGT to automate a complete manual test suite for an industrial system and the challenges, problems and limitations (CPLs) of said VGT transition. Applicability is in this context defined as how well and at what cost a technique/process/practice can be implemented in a given context to provide benefit. As such, Visual GUI Testing is highly applicable in a context where it requires only small and cheap changes to implement and it gives quick return on invest-ment, whilst it has low applicability in a context where requires large and costly changes to implement with slow return on investment
The second VGT transition project was performed in another Saab company within the Saab corpo-ration, in the Swedish city of J¨arf¨alla, and had two focuses. First, to evaluate if VGT could be applied in practice in an industrial project, results presented in [Alegroth et al(2013a)Alegroth, Feldt, and Olsson]. Second, to evaluate the CPLs experienced by industrial practitioners during VGT transition in this context. As such, the second project was driven by industrial practitioners with minimal support of the research team.
The two projects complement each other by providing information of scientific rigor from the first project and information from the practical usage of VGT from the second project. Thus, this study contributes to the academic body of knowledge with the results from two empirical holistic case studies [Runeson and H¨ost(2009)] from two different companies2, in the continuation of this manuscript referred to as Case 1, the study in Gothenburg, and Case 2, the study in J¨arf¨alla. The two case studies were conducted in parallel, but with different research units of analysis [Runeson and H¨ost(2009)]. In Case 1 the unit of analysis was the VGT transition of one complete manual system test suite of a safety-critical air traffic management system, performed by experts from academia. In Case 2, the unit of analysis was instead the success or failure of the VGT transition project when performed in a practical context by industrial practitioners under real-world time and cost constraints. Consequently, Case 1 provided more detailed information about the VGT transition, whilst Case 2 provided information from a VGT transition project performed by industrial practitioners under practical conditions.
In the following subsections we first present the industrial projects and their context followed by two sections that give a more in depth view of the companies and how the projects were performed. Finally, in the fourth subsection, we will present the test suite architecture that was used in both companies.
3.1 Industrial projects and Research Design
Both VGT transition projects were conducted in industry with two mature industrial software prod-ucts/systems. In Case 1, the VGT scripts were developed from a scenario-based test suite intended to be performed manually by testers on a distributed, safety-critical, air traffic management system. The sys-tem consisted of an excess of 1 million lines of code developed in several programming languages with the bulk of it written in C# and XML. XML was used to configure the system for different customer needs. Configuration included, but was not limited to, changing the layout of the graphical user interface (GUI), data interface timeouts, the simulator environments, etc.
Furthermore, the system’s GUI was shallow, meaning that it consisted of a set of GUI components that were continuously shown to the user with the property that interaction with a specific component did not obstruct or deny interaction with any other component in the GUI. An example of another application, that should be known to the reader, with this GUI property is a calculator application. As such, the GUI view was flat but the system’s backend functionality was advanced, i.e. airstrip and airport radar control. The GUI was also distributed across two separate, physical monitors connected to two computers and one server over a local area network. This system attribute required special consideration during the study that will be described in Section 3.2. In the development environment both parts of the GUI were controlled using a mouse and keyboard. However, after deployment at a customer one of the GUI’s was instead controlled using a touchscreen monitor. The touchscreen monitor put specific requirements on the size and look and feel of the GUI components.
2 Even though the companies are part of the same corporation they have no contact in practice and can be considered
The system has been developed in both plan-driven and iterative development projects that started with requirements acquisition activities, followed by development activities and finally testing activities. For each activity, a set of artifacts were developed, such as requirements specifications, design documents, user guides, test documentation, etc. However, for the study, the only document of interest was the system’s test description that specifies the manual test cases used for system testing. This system testing is typically performed once or twice every development iteration at the company, i.e. once or twice every six months. During such a system test, all test cases in the test description are performed and any behavioral deviations noted. The test cases were defined as scenarios that were documented in tables where each row defines input and expect output for each test step. Because the system’s GUI was distributed, most test cases also required the tester to physically move from one computer monitor to the other. A more detailed description of the test specification can be found in Section 3.4.
Furthermore, the system was developed in compliance with RTCA DO-278 quality assurance standard for airplane and air traffic management software. RTCA DO-278 compliance is required by the system’s customers that consist of domestic public and military airports as well as international public airports. The standard defines a set of test quality objectives that all test practices/techniques, the company use, must adhere to, including VGT.
Most of the company’s developers hold masters of science and technology degrees and have, on average, three to five years of industrial experience as developers, testers and/or project managers. Furthermore, the company does not have dedicated testers, instead all testing is performed by the developers. The company has a hierarchal, yet flexible, organization, situated in two Swedish sites: Gothenburg and V¨axsj¨o.
In Case 2 the VGT transition was performed for a battlefield control system that was both safety-and mission-critical. The system was distributed across several computers safety-and tested with test cases that required interaction with several physical computers, which as stated required further consideration that will be explained in Section 3.2.
Due to the limited involvement of the research team in Case 2, but primarily for confidentiality reasons, less can be disclosed about the system’s details. The product is however mature, i.e. it has been developed, maintained and deployed for many years, and is similar in terms of complexity and criticality as the system in Case 1. The system is used for military control and its main feature is to allow military commanders to track the movement of friendly and enemy forces on the battlefield. This feature is accomplished through a sophisticated map engine that allows the commander to drag and drop units onto the screen but also scroll around and scale the map for battlefield awareness and overview. Hence, the system is GUI-driven but with a deeper GUI than in Case 1. The deeper GUI means that interaction with a specific component from the set of all GUI components in the system can obstruct or deny interaction with another component on the GUI. An example of such an application, which should be familiar to the reader, is a webpage with several pages. Hence, the system has several views that, at least partly, cover each other. In the test environment manual interaction with the system is performed using a mouse and keyboard but when deployed, as for the system in Case 1, the system is controlled through a touchscreen monitor.
Development of the system was, at the time of the study, performed using an iterative process with regular manual testing performed by dedicated testers. However, the tested system did not adhere to any specific quality assurance standard. The look and feel of the system’s GUI was however specified by a military standard with specific regulations on button sizes and positioning to maximize its usability in a mobile environment, i.e. in a vehicle moving across rough terrain. Finally, the product’s main customer is a Swedish military contractor.
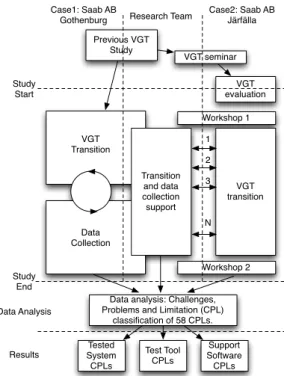
Figure 1 visualizes the research process and the three parallel tracks that were performed by the re-searchers in Case 1, practitioners in Case 2 and the support and data acquisition performed by the research team. The information acquisition and support activities were continuous in Case 1 with members of the research team at Saab daily during the project. The VGT transition was performed by one member of the research team, supported by the other researchers and developers at the company when needed. Information was acquired according to a structured process that will be described in section 3.2.
In Case 2, personal support was only given during two full-day workshops on site whilst all other support activities were conducted over email or telephone. The workshops performed in Case 2 were also the main source of data acquisition from the company. In the first workshop, information such as what type of system they were working with, what the Sikuli test architecture would look like, etc., was acquired. In relation to the second workshop, two semi-structured, one hour, interviews were also held with the industrial practitioners to validate previously acquired information through triangulation. Consequently, the data acquisition in Case 2 was divided into three distinct phases, introduction (Workshop 1, in phase 1), data acquisition and implementation support through remote communication (Phase 2) and finally a retrospective analysis (Workshop 2, phase 3).
Previous VGT Study VGT evaluation Workshop 1 Workshop 2 VGT transition Transition and data collection support VGT seminar 1 2 3 N Study Start Case1: Saab AB
Gothenburg Research Team
Case2: Saab AB Järfälla VGT Transition Data Collection Study End
Data analysis: Challenges, Problems and Limitation (CPL)
classification of 58 CPLs. Tested System CPLs Test Tool CPLs Support Software CPLs Data Analysis Results
Fig. 1 Visualization of the research process showing three (vertical) tracks. Track 1 (leftmost) contains activities performed in Case 1 and prior work at Saab AB in Gothenburg. Track 2 (middle) the activities of the research team and Track 3 (rightmost) the activities of Saab AB in J¨arf¨alla. Boxes that cross over the dotted lines were performed by the research team and the respective company.
After the completion of Case 1 and Case 2, all acquired information was analyzed to identify the CPLs. The input for the analysis was the detailed documentation of observations, the interview transcripts and the email correspondence from Case 2. When a potential CPL was identified through qualitative document analysis of the input information, its characteristics were compared to previously identified CPLs and if the new CPL was found to be unique the CPL would be abstracted and counted. The initial analysis found 58 CPLs. However, many of the CPLs had such similar characteristics that they could be grouped together into types, resulting in a reduction from the 58 identified CPLs to 26 unique types with one to seven CPLs in each type. In order to mitigate bias, this analysis was performed by a member of the research team that had not taken part in the VGT transition. Additionally, to mitigate bias and faulty assumptions made by the analyst, the 26 CPL types were discussed and validated with the participants of the study, i.e. the research team member from Case 1 and the industrial practitioners from Case 2, to ensure that the CPLs had been correctly identified. These CPL types were created to raise the abstraction level of some of the CPLs by removing or merging their characteristics and thereby make them more generalizable for other contexts. Some of the characteristics that were analyzed were,
– Origin or cause of the CPL (VGT tool IDE, the image recognition, the manual test specification, etc.). – Where it was observed (Case 1, Case 2 or both).
– Commonality to other CPLs (Iterative analysis of above characteristics). – Impact on transition or usage of VGT (Criticality of the CPL).
– CPL solution (Solved during the project, feasible to solve in theory, not solvable) – Etc.
The two projects were performed mutually exclusively from one another, meaning that the researcher performing the VGT transition in Case 1 had no contact with the industrial practitioners in Case 2. All communication in Case 2 was performed by the other research team members. Thereby ensuring that corroborating evidence or information from one of the projects was not influenced by the other project.
After identification, the CPLs were categorized into four tiers, with the 58 individual CPL observations on the lowest level of abstraction, i.e. Tier 4. The Tier 4 CPLs were then divided into 26 unique CPL types, Tier 3, that were then collected into eight types on a higher level of abstraction, Tier 2 CPLs, which could be grouped even further into three top tier CPL types, i.e. Tier 1 CPLs. Furthermore, the Tier 3 CPLs were analyzed to identify which were the most prominent CPLs in the projects. Prominence was evaluated based on occurrence in both projects, as well as more subjective measures, e.g. perceived negative impact
on the transition or usage of VGT, added frustration to the VGT transition, and perceived external validity. Additionally, the characteristics listed above were also taken into consideration.
Furthermore, this analysis revealed four high-level solutions that could be derived from the specific solutions that had been identified during the two projects. These four identified solutions are estimated to solve 50 percent of the identified CPLs and are presented in Section 4.5. The retaining 50 percent of the CPLs were either not solved or solved using ad hoc practices and solutions that were only applicable for specific CPLs. For instance, the VGT tool only supported a US keyboard which made it impossible to input special characters from the Swedish alphabet. This was solved by entering the ascii codes for said letters instead. Thus, solving the problem, but it could not solve any other CPL and it was only used in Case 1.
Project cost and return on investment was also evaluated during the study by collecting quantitative metrics from both cases. In Case 1 the metrics were recorded in detail during the VGT transition. However, in Case 2 they were obtained primarily post project completion, i.e. during the interviews in Phase 3 of the study. In order to mitigate estimation bias the reported values were triangulated through the interview transcripts and previously collected data from Case 2. All information analysis was performed by a member of the research team that did not take part in the VGT transition project in Case 1 to mitigate bias in the results. It should be noted that due to the differences between the contexts of the two cases, many of the quantitative data points are context dependent and therefore only limited generalization can be done of said data, see Section 4.6. Finally, all conclusions drawn from the analyzed information were reviewed and validated by the study participants to eliminate bias introduced during the analysis.
3.2 Detailed data collection in Case 1
The VGT transition in Case 1 started with an analysis of the automated test scripts that were devel-oped in our previous work at Saab in Gothenburg to identify what should/could be reused [B¨orjesson and Feldt(2012)]. A thorough document analysis of the system under tests (SUT) manual test suite was also per-formed to evaluate if the previously developed VGT test scripts were still applicable. The document analysis was necessary because the version of the SUT differed from the system that had been used in [B¨orjesson and Feldt(2012)]. In addition, the document analysis was required for the research team member performing the VGT transition to get familiar with the SUT and our previous work. Because the VGT transition was performed at the company, any questions that the research team member had could quickly be resolved by asking a developer at the company, consulting the SUT documentation or asking one of the other research team members. The research team member who performed the VGT transition held a post-graduate degree in computer science but had no previous industrial experience.
Furthermore, to ensure information quality the research team defined a thorough documentation process at this stage of the project. The process defined a set of quantitative and qualitative metrics and practices how these metrics should be collected for each developed VGT script and/or the VGT test suite. These metrics included, but were not limited to, development time of each test step and the entire test case, execution time of the test case, lines of code for each test step and the entire test case, CPLs found during development, etc. Specifically, the information collection focused on sources and causes of CPLs that affected the VGT transition, e.g. was the CPL related to the script, a GUI component, the VGT tool or the system. Practically, the data collection was done on printed forms or Excel sheets. All information was later transferred to Excel to simplify the analysis.
Even though the version of the SUT differed from the one used in our previous work, the core function-ality of the new version was the same as the old, i.e. airport landing and air traffic management. The main difference was that the new version only had one control position, whilst the old system had three, each with different capabilities for different operators. Consequently, the new version had limited functionality and analysis of the manual tests therefore showed that only 33 out of the 50 manual test cases, mentioned in [B¨orjesson and Feldt(2012)], were applicable. However, all of these 33, applicable, test cases could be automated and thereby constituted a complete test suite of Sikuli scripts for that particular version of the system.
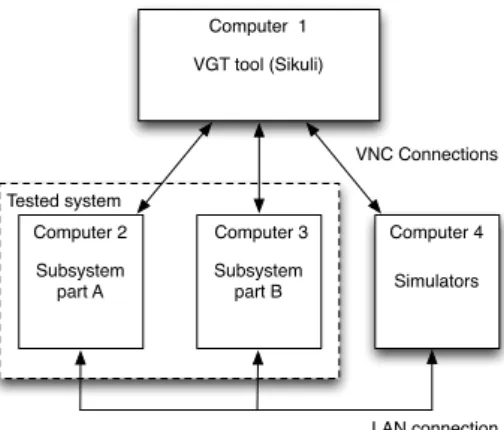
As stated, the SUT was distributed over three computers, connected to one another over a local area network (LAN), which required the human tester to physically move around during manual system testing. In order to give Sikuli this capability, the tool was paired with a third part virtual network connection (VNC) software that provides support for remote computer control by streaming the target computers desktop to the viewing computer. VNC servers were added to the three computers of the system and connected, over LAN, to a fourth computer with a VNC viewer application that the Sikuli scripts were executed against.
VGT tool (Sikuli) Subsystem part A Subsystem part B Simulators VNC Connections Computer 1
Computer 2 Computer 3 Computer 4 Tested system
LAN connection
Fig. 2 The setup of the tested system, including all computers that were connected in a local area network (LAN), accessed by Sikuli using VNC.
Consequently, the Sikuli scripts were executed remotely. In the continuation of this manuscript these four computers will be referred to as the test system which has been visualized in Figure 2.
Once the test system had been setup, an architecture was developed for the VGT test suite. The VGT scripts were implemented one at a time using the manual test cases as specifications. Thus, ensuring that each VGT script was a 1-to-1 mapped representation of the manual test case with equivalent GUI interactions and assertions. This VGT transition was possible because the test steps in the manual test cases were defined in sequential scenarios. The VGT suite architecture and script development will be presented in detail in Section 3.4 33 manual test case descriptions where transitioned into VGT during the study, resulting in 33 equivalent automated VGT scripts. Several of these manual test scenarios were however applied to all components of the GUI, e.g. the same test scenario was applied on several different buttons to verify their functional conformance to their specification. Thus making the actual number of tests cases greater than the number of test case descriptions.
During the VGT transition, the test scripts were executed after each test step had been developed and verified against the results of corresponding manual test step. The automated test steps were implemented as individual Python methods that were called in sequential order to perform the test scenario. This imple-mentation approach made the scripts modular and allowed test steps to be reused. Modularity was one of the keywords for the VGT transition to ensure reusability and maintainability of the scripts. Modulariza-tion made it possible to run the Python methods out of order, thereby shortening script verificaModulariza-tion cost, since the entire test script did not have to be re-executed every time new functionality had been added or changed. Maintainability was also achieved since the Python methods are interchangeable and can simply be replaced if the scenario or functionality of the system under test is changed.
A second keyword for the VGT transition was robustness. Robustness was achieved by implementing the scripts with three levels of failure redundancy for critical functions. The redundancy was put in place to mitigate catastrophic failure either due to image recognition failure, script failure, test system failure or defect detection in the tested system. This redundancy mainly consisted of several levels of exception handling that was implemented using Python.
As a final step of the VGT transition process, after a test script had completed, and successfully executed against the tested system, it was integrated into the VGT suite. In situations where erroneous test script behavior was identified post-integration into the VGT suite, the test script(s) were corrected and validated during execution of the entire VGT suite, i.e. execution of all the test cases in sequence. The validation process was rigorous and performed by comparing the outcome of each automated test step with the outcome of corresponding manual test step. This process was time consuming but required to ensure VGT script quality.
3.3 Detailed data collection in Case 2
Case 2 was driven by industrial practitioners and started with a three week long evaluation of VGT as a technique. Three tools were evaluated during this period, i.e. Sikuli [Yeh et al(2009)Yeh, Chang, and Miller], eggPlant [TestPlant(2013)] and Squish [froglogic(2013)], to identify the most suitable tool to fulfill
the company’s needs3. After the evaluation, Sikuli [Yeh et al(2009)Yeh, Chang, and Miller] was identified as the most suitable alternative for the transition. Further information regarding the VGT tool selection can be found in [Alegroth et al(2013a)Alegroth, Feldt, and Olsson].
The industrial practitioners held postgraduate degrees and had several years, i.e. 1-3 years per person, of industrial experience in testing among them. The majority of the VGT transition was performed by two testers. However, towards the end of the project a third tester joined the team but this person’s contributions to the project was considered negligible.
Similarly to the transition in Case 1, the industrial practitioners in Case 2 used their manual test cases as specifications for the automated test cases. However, since the testers possessed expert domain knowledge, not every test case was implemented as a 1-to-1 mapping to a manual test case. The deviations from the 1-to-1 mappings were required since the manual tests, defined as use cases, were not mutually exclusive from one another. This lack of mutual exclusion originated from the depth of GUI, i.e. its many views, which for some tests required certain use cases to be executed in order to put the system in a specific state for the assertion in a subsequent use case. Therefore some of the use cases that were used often were grouped together into a single script that could be called to setup the system in a given state before continuing the execution with more independent use cases. However, the manual test case architecture in Case 2 was perceived to provide the VGT suite with a higher degree of flexibility and reusability than the manual test architecture used in Case 1. The reason was because the test cases consisted of small interchangeable pieces, i.e. the use cases, which made the creation of new test cases very quick and simple. The manual test suites that were automated consisted of several hundred individual use cases that were transitioned into an estimated 300 automated test cases. An exact number cannot be given because of the flexible coupling between use cases that made it possible to create many test cases from just a few scripts.
Similar to the VGT suite developed in Case 1, the developed VGT suite in Case 2 was based around a main script that imported individual test cases and executed these according to a predefined order that was specified by the user. The order of test case execution could also be saved in the script. Thus, very little effort was required to setup and run the test suite.
To acquire information during the study, an information acquisition process was proposed to the indus-trial practitioners for the collection of quantitative and qualitative metrics. However, because Case 2 was performed during an actual development project in industry, the process could not be followed consistently due to time and cost constraints. Thus, lowering the quality of the collected information. This lack of in-formation quality was compensated with triangulation and the interviews that were held in relation to the second workshop. The information collected by the industrial practitioners was conveyed in a continuous manner to the research team, as shown in Figure 1, through e-mail and over telephone.
3.4 The VGT suites
In this study we do not consider the developed VGT suites, or their architecture, part of the main contribu-tions of the work since the main focus of the study was on the challenges, problems and limitacontribu-tions (CPLs) that were identified during VGT transition and usage. However, to provide background and replicability of the study the following section will describe the developed VGT suites in more detail.
The input for the VGT transition were the scenario-based test case specifications that were used for manual system testing in Case 1 and 2. In Case 1 the test specification constituted a complete test suite with 67 manual test cases that were defined in table form. Each table constituted a test case scenario where each row was a test step of the scenario. The columns in turn defined the input and expected output. A test step was considered successful if the observed output was equal to the expected output. Further, if all test steps were successful in a test scenario then the test case was successful. The minimum number of steps (rows) in a test case was 1, the average was 7.88, median 6 and the maximum was 22. However, it should be noted that the number of manual test steps was not indicative of the effort required to run the scripts manually or to automate the tests since the level of detail in the natural language descriptions often differed. As such, a script with only a few steps could take longer to automate than a test case with many steps because these few steps defined many interactions with the SUT, whilst scripts with many steps often defined one interaction per step. These deviations originated from the test scripts being written by different people at different points in time. The tables were defined in a 126 page long Word document.
In Case 2 the test specification consisted of small use cases. Small in this context means only one or two human interactions with the system per use case. The use cases were defined as a custom sequence diagram notation with a bubble(s) showing what input the tester should give to the system on the left,
UC 1 UC 2 UC 3B UC 3A UC 3C UC 3AA UC 4 UC 3A User System Place Tank-symbol
to map symbol Tank-appears on map UC 3B User System Place Car-symbol
to map symbol Car-appears on map
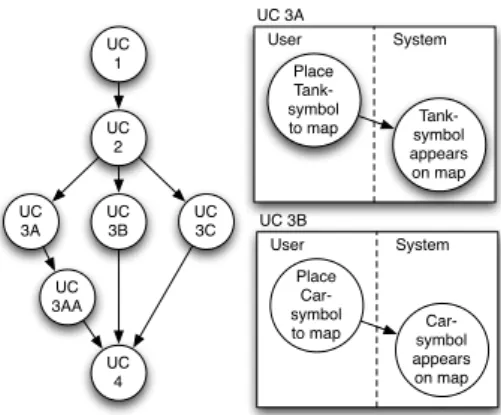
Fig. 3 Conceptual example of a test case scenario design, used in Case 2, based on loosely linked use cases (to the right). In the example the test scenario (to the left) contains three unique test-paths, i.e. test cases, that were, prior to the VGT transition, executed manually. UC - Use case.
and system’s expected response in a bubble(s) to the right. However, these uses cases only defined the test steps. These use cases, examples shown in the right of Figure 3, were then tied together on a meta-level to form test scenarios, as shown in the left of Figure 3. Figure 3, on the left, exemplifies a test chain used in Case 2 which is made up from three different test flows, or scenarios. These scenarios all start with use case 1 and 2, i.e. UC 1 and UC 2, and are then followed by one out of three exchangeable use cases, i.e. UC 3A, 3B or 3C (Middle of Figure 3). However, the manual test structure in Case 2 also allowed test scenarios to be of unequal length, exemplified with UC 3AA, bottom left of Figure 3. The three different test chains are then joined again, and completed, by UC 4 (Bottom of Figure 3). This architecture allowed the testers to switch use cases within the graph and thereby create different test scenarios. A test scenario was successful if all expected outputs, from all uses cases in said scenario, were observed. Each interaction or observed result, i.e. bubble in the sequences, was defined in one to two sentences of natural language.
The VGT suites developed in Case 1 and Case 2 were similar in terms of architecture and were both built in Sikuli script, which is based on Python. Sikuli has support for writing individual VGT based component tests and includes special assertion methods for this type of testing, referred to in the tool as “unit tests” on GUI level. However, Sikuli does not have support for creating test suites of several individual unit tests. As such, to develop an entire test suite using Sikuli’s standard functionality, all test cases have to be grouped into one file. However, this has negative effects on the reusability, maintainability, usability, etc., of the tests.
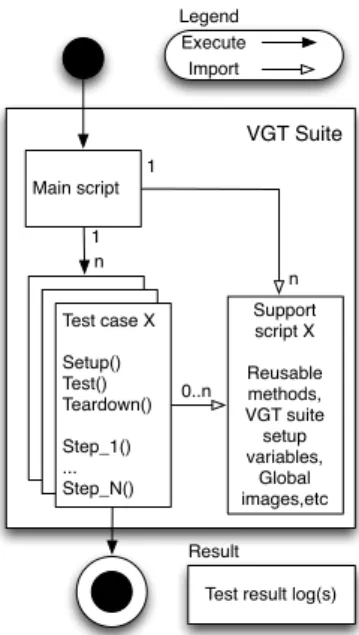
Custom test suite solutions were therefore developed in both Case 1 and Case 2 by using Python’s object orientation and its ability to import scripts into other scripts. Both VGT suites consisted of a main script that imported the individual test cases and executed these according to an order specified in a list in the main script. This list, or lists, could easily be defined manually or be generated at runtime to, for instance, randomize the order of the test case execution. Thus, the individual test cases were coupled using the main script. However, neither data-driven nor keyword-driven testing was used even though the tests could be refactored to support these properties. The general architecture for the two VGT suites is visualized in Figure 4. As can be seen in the figure, each script was given a setup method, a test method, containing the test steps of each test case, and a teardown method. Consequently, the VGT scripts followed the same framework as typically used for automated unit tests, e.g. JUnit [Cheon and Leavens(2006)]. This pattern was supported by creating a skeleton script that was reused as the basis for all test cases.
In addition, user defined methods, variables to setup the VGT suite, etc., were extracted from the in-dividual scripts and put in a set of support scripts that were then imported to the main script and/or the test scripts that required them. Each test step was also defined as an individual method to increase mod-ularity. The modular, and hierarchal, architecture helped shorten development time by simplifying reuse, but also improved maintainability of the scripts since all components were easily accessible. Modularization also improved robustness since it became easy to encapsulate all method calls to test steps with exception handling. Thus, if a test step failed, the exception could be handled both locally in the individual scripts or on a global level in the main script.
All assertions were conducted through visual comparison between expected and actual output from the SUT’s GUI using Sikuli’s image recognition capability. This was achieved using branch statements that were defined as: if expected graphical output, then report pass and continue to the next test step, else report fail and rerun the assertion. The reason why the assertion was rerun if it failed was to verify that
Main script Test case X Setup() Test() Teardown() Step_1() ... Step_N() VGT Suite Support script X Reusable methods, VGT suite setup variables, Global images,etc Execute Import Legend 1 n 0..n n 1
Test result log(s) Result
Fig. 4 The architecture of the VGT suites developed in Case 1 and Case 2. Each test script included a setup, a test and a teardown method. The test method in turn called the individual test step methods, thus separating the test step execution order from the actual test step implementation. This design perceivably improved maintainability and reusability of the test cases.
the cause of the failure was a fault in the SUT rather than a false positive caused by, for instance, failed image recognition. In Case 1, in addition to the above functionality, a second failed assertion resulted in the SUT being rerolled to a known state and the entire test case being rerun. If the same test step would fail again, the entire system would be restarted and the test case rerun a third time. This redundancy was implemented in order to with absolute certainty identify the cause of a failure. In Case 2 the only action that was taken after a failed assertion was to rerun the assertion.
Another difference between the VGT suite developed in Case 1 compared to Case 2 was how test result output was generated. In Case 1, the output was generated as textual log files using a custom solution that was spread across the main script and the individual test scripts. The solution documented the results of individual test steps but also summarized the results from each test case. In addition, the output included video recordings of failed script executions, created using the third party recording software Camtasia.
In Case 2, the output was produced using an open source Python library that formatted the output from the test scripts into an HTML file with similar graphical format to the output from automated unit tests, e.g. JUnit [Cheon and Leavens(2006)]. However, Case 2’s VGT suite did not record video clips of failed test scenarios, instead it took screenshots of the tested system’s faulty state when a test case failed. The screenshots were taken using a Java library that was called from the Python scripts.
The reason for adding screenshots and video recordings to the VGT suites’ output was to provide the SUT’s developers with more information to simplify defect identification and recreation. This functionality also helped the VGT script developers to distinguish defects in the SUT from defects in the VGT suite itself.
It should be noted that the VGT suite architecture presented in this manuscript is generally appli-cable but not necessary in most other tools than Sikuli [Yeh et al(2009)Yeh, Chang, and Miller]. The reason is because most VGT tools, e.g. JAutomate [Alegroth et al(2013b)Alegroth, Nass, and Olsson] and EggPlant [TestPlant(2013)], have built in support for test suite creation and maintenance. As such, these tools also have built in failure mitigation and exception handling support. However, for individual test cases, we propose a general practice of using the setup, test and teardown design as described by unit test frameworks. This pattern encourages modularity and effectively separates the tests preconditions, tests and postconditions.
As stated, the test cases were implemented as 1-to-1 mappings of the manual test cases using a struc-tured process where each test step was implemented and verified against the manual test case outcome. Furthermore, if a test script failed during test execution the failure would be evaluated to verify that it was caused by a SUT defect, i.e. evaluation of the assertion to verify its outcome. In Case 1 this practice was considered sufficient for verification since the system did not evolve during the course of the project. However, since the VGT suite was being developed in a real project in Case 2, all test cases and assertions
were verified with even intervals through complete executions of the manual test suite. This practice verified that no test cases that should have failed were reported as successful. However, due to cost constraints, only the standard test case execution order from test case 1 to n was evaluated. Thus, it is possible, but unlikely, that there could have been assertions that failed to report defective SUT behavior. However, it is unlikely that assertions that should have failed instead succeeded because of the sensitivity of the image recognition that is more prone to failure than to succeeding when the expected output is not present on the screen. However, since this behavior cannot be ruled out, a theoretical mitigation practice is to also verify succeeding test scripts randomly post development.
4 Results and Analysis
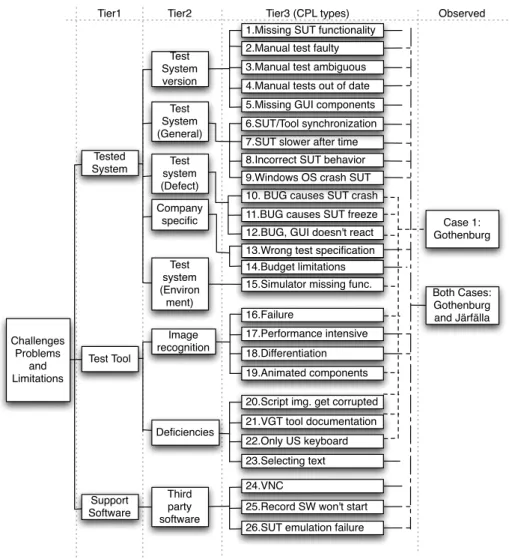
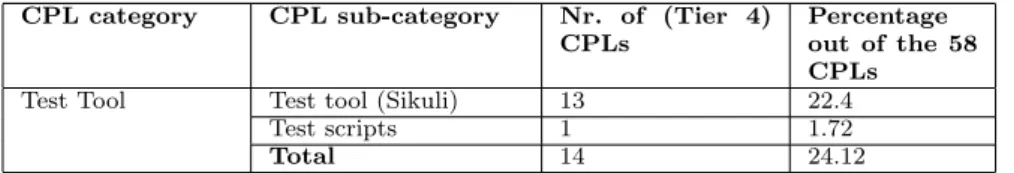
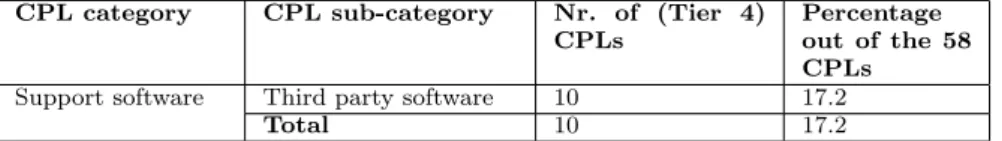
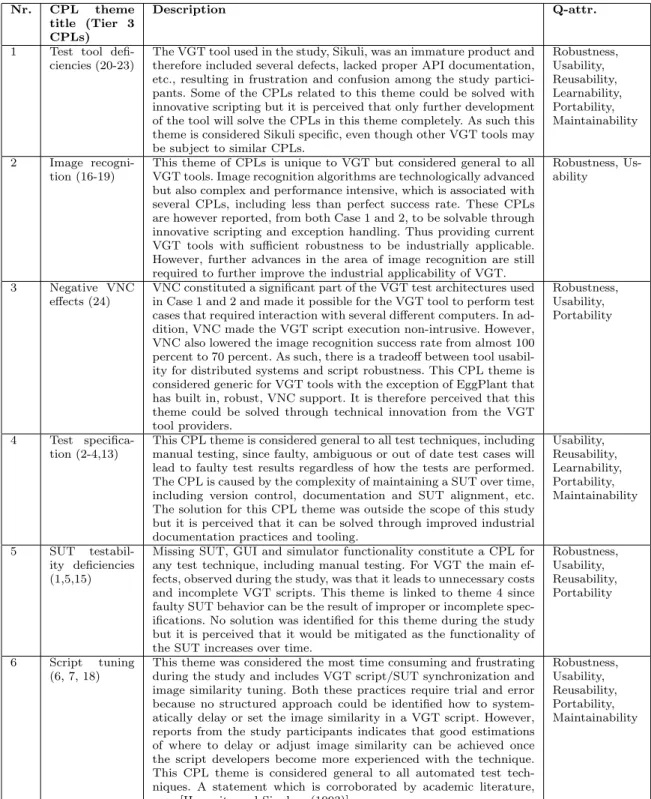
This section will present the main contributions of this work including the Challenges, Problems and Limitations (CPLs) related to the transition to and usage of VGT, potential solutions to these CPLs and results regarding the bug-finding ability and ROI of the VGT transition. The Tier 3 CPLs (The 26 CPL types) are presented in the following subsections according to the order of the Tier 2 CPL types as they are presented in Figure 5. In addition, each Tier 3 CPL has been marked in the text with the number proceeding its name in Figure 5, i.e. CPL type x is marked as (x) in the text. Furthermore, in order to provide the reader with an overview of the distribution of the 58 CPLs (Tier 4), each subsection is proceeded with a table how many CPLs there were of each type.
Since the number of CPLs and types of CPLs are extensive we have summarized the main results for each type and provide a summary in Section 4.4, including a table listing the most prominent CPLs, Table 5. The summary section also analyses if the identified CPLs have been found, or are likely to hold, also for alternative test techniques. Table 6 summarizes the outcome of this analysis.
The result section then continues with a description of the identified solutions to CPLs in Section 4.5. These solutions have also been summarized in Table 7. This is followed by results regarding the bug finding ability of the VGT test suites and quantitative results on the development time, execution time, etc., and the evaluated return on investment of the VGT transition, summarized in Table 8. These results are presented together with a discussion regarding the impact of the results for industry and a theoretical model for the ROI in a general VGT transition project, presented in Figure 8.
4.1 Test system version CPLs (Tier 1)
The Tier 1 CPL type related to the tested system (SUT) was split into five Tier 2 CPL types, as shown in Figure 5. These Tier 2 CPL types are related to the version of the SUT, the general SUT, defects in the SUT, the company or the SUT’s simulators. The following subsections will describe the CPL types related to these categories.
4.1.1 Test system version (Tier 2)
Complex systems with several versions and/or variants are associated with test related CPLs that affect all types of testing, including VGT. For instance, these system’s require appropriate version control to ensure alignment between code and system specifications, e.g. test specifications. This CPL was observed in Case 1 where the SUT was a demo build of the product, intended for customer demonstrations rather than customer delivery. As such, the SUT did not include all the functionality of the product (1), had a faulty test specification (2), etc. The SUT was used during the project because of resource constraints (14), i.e. whilst the product SUT required 12 computers, including three servers, the demo system required only three computers in total. Thus, lowering the costs for setting up the SUT and the VGT transition project overall. Resource/budget constraints is a common CPL in implementation and improvement projects in the industrial context which limits the amount of evaluation and implementation that can be done.
The lack of documentation for the SUT in Case 1 required the research team to use a test specification for another version of the system which was not aligned with the SUT’s functionality (2, 13). In addition, the research team member who performed the VGT transition in Case 1 lacked domain knowledge which made it difficult to evaluate which manual test cases were applicable before the starting a new script. As such, several scripts were already partially implemented before it was identified that they could not be completed. Thus, adding unnecessary costs to the transition project. Note that the cause of this CPL was the lack of SUT functionality (1) rather than limitations in the VGT tool.
13.Wrong test specification Challenges Problems and Limitations Tested System Test Tool Support Software Test System version Test System (General) Test system (Defect) Company specific Test system (Environ ment) Image recognition Deficiencies Third party software
5.Missing GUI components 1.Missing SUT functionality
10. BUG causes SUT crash 4.Manual tests out of date
11.BUG causes SUT freeze 12.BUG, GUI doesn't react 3.Manual test ambiguous 2.Manual test faulty
8.Incorrect SUT behavior
16.Failure
21.VGT tool documentation 19.Animated components 20.Script img. get corrupted 17.Performance intensive
23.Selecting text 24.VNC
25.Record SW won't start 26.SUT emulation failure 18.Differentiation 22.Only US keyboard Case 1: Gothenburg Both Cases: Gothenburg and Järfälla
Tier1 Tier2 Tier3 (CPL types) Observed
7.SUT slower after time
14.Budget limitations 15.Simulator missing func. 6.SUT/Tool synchronization
9.Windows OS crash SUT
Fig. 5 A hierarchal tree diagram over the Challenges, Problems and Limitations (CPLs), Tiers 1-3, that were identified in Case 1 and Case 2. SUT - System under test, VNC - Virtual Network Connection, GUI - Graphical User Interface, OS - Operating system, SW - Software, Func. - Functionality.
In addition, several of the manual test cases tested the SUT’s functionality incorrectly (2) or were out of date (4) and no longer valid because of changes to the SUT. Other tests were ambiguous (3) or aimed at testing functionality that had been removed (2). These test cases were reported to the company and were considered a positive side effect of the VGT transition. Thus, this CPL relates to the complexity of keeping test specifications up to date (4) as a mature system evolves into versions/variants over time. Consequently, it is important to evaluate the manual test suite before VGT transition to ensure that the test cases are applicable. Failure to do so will result in additional cost and erroneous automated test cases that in the worst case can lead to SUT defects propagating post customer delivery.
However, identifying if a manual test specification is faulty requires domain and SUT knowledge, which, as previously stated, the research team member performing the VGT transition lacked. This lack of domain knowledge resulted in additional cost to the project because the company’s developers had to be consulted to, for instance, interpret ambiguous manual test cases, explain SUT functionality, etc. As such, it is perceived that VGT transition will be more effective if it is performed by a domain and/or SUT expert. A statement that is corroborated by the practitioners in Case 2 who reported that they had not found any test case that they could not automate.
In our previous work [B¨orjesson(2010)] we automated manual test cases for a version of the system with 50 manual test cases. However, for the main branch version of the system there were 67 manual test cases, of which only 33 were applicable on the version of the SUT used in Case 1. Hence, restricting the usability and portability of the developed VGT test suite for other versions or variants of the SUT.
Lack of functionality that prohibited automation of more manual test cases were, but not limited to, the SUT version’s lack of operator roles (1), missing GUI components (5), missing radar functionality (1),
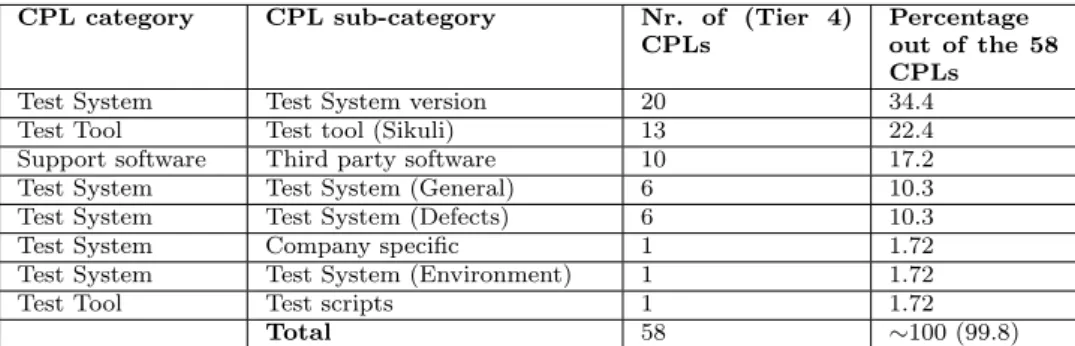
CPL category CPL sub-category Nr. of (Tier 4) CPLs
Percentage out of the 58 CPLs
Test System Test System version 20 34.4
Test System (General) 6 10.3
Test System (Defects) 6 10.3
Test Company specific 1 1.72
Test System (Environ-ment)
1 1.72
Total 37 58.44
Table 1 Summary, and distribution, of problems, challenges and limitations (CPLs) related to the tested system out of the 58 CPLs that were found in total.
Img. Rec. 1 VGT tool System under test (SUT) Img. Rec. 2 Img. Rec. 3 State 0 State 1 State 2 Time T0 T1 T1 < Tx < T2 T2 Input 1 Input 2
Fig. 6 Visualization of the CPL that the VGT tools’ image recognition algorithms requires less time to find a match on the SUT’s GUI than the time required for the SUT to transition from one state to another. Img. Rec. - Image recognition.
missing simulator support, etc (1). This lack of functionality also made it impossible to run the manual test cases. This missing functionality had purposely been omitted to scale down the amount of required hardware to run the SUT and make it transportable for demonstration at conferences, workshops, etc. As a consequence, the developed VGT suite could only partially test other versions or variants of the SUT. However, for the manual test cases that were applicable the study participants in both Case 1 and 2 reported that they did not find any test case operations that they could not automate using the VGT tool.
In summary,
– Misalignment between system implementation and test specifications leads to partially completed test cases, faulty test results and additional transition cost.
– Missing system functionality leads to only partially completed test cases. 4.1.2 Test system (General) (Tier 2)
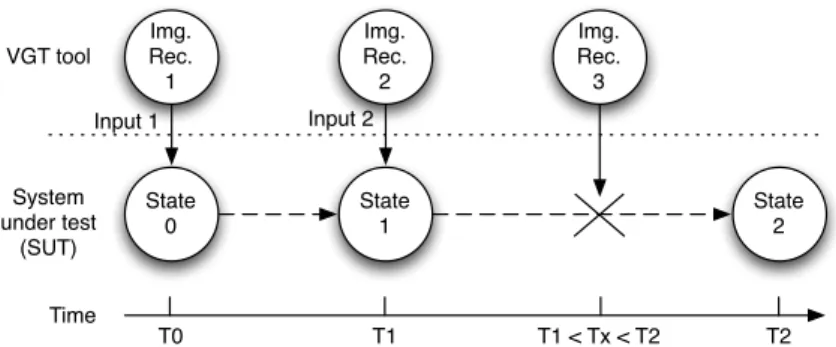
One of the CPLs that was reported to cause the most frustration during the study was that the VGT script execution had to be synchronized with the SUT’s execution (6). This CPL has been visualized in Figure 6. In the figure, the VGT tool’s image recognition is successful at time T0 and input is sent to the SUT which triggers a transition from State 0 to State 1. At time T1 the image recognition is once again successful because it occurs after the SUT has reached a stable state, State 1. However, at time Tx the image recognition fails because the SUT is currently transitioning from State 1 to State 2 where the sought GUI component is not yet visible on the SUT’s GUI. Thus causing a script failure.
This is a common scenario during VGT script development and requires the image recognition at Tx to be delayed until the SUT has reached the stable state in State 2. There are two approaches to add delays in, to the best of our knowledge, all VGT tools (6). The first approach is to delay the script dynamically until a sought GUI component is visible and the SUT is perceived to have reached a stable state. The second approach is statically wait for n number seconds before proceeding with the script execution. Dynamic delays are more robust to SUT performance change but can fail because they rely on the VGT tool’s image recognition algorithm. In contrast the static delay is completely robust but slows down script execution since the static delay has to be based on worst case SUT state transition time.
However, even though delays improve VGT scripts robustness, they also add maintenance costs since they require realignment over time to match the SUT’s performance (6,7). Dynamic delays also require the sought GUI component (bitmap) to be updated over time. The practitioners in Case 2 reported that adding