THESIS
ANALYSIS OF BALL CORPORATION’S FAIRFIELD CAN MANUFACTURING PLANT
AND THE POTENTIAL FOR INDUSTRIAL WASTEWATER RECYCLING
Submitted by Timothy G. Medearis
Department of Civil and Environmental Engineering
In partial fulfillment of the requirements For the Degree of Master of Science
Colorado State University Fort Collins, Colorado
Summer 2016
Master’s Committee:
Advisor: Kenneth Carlson Kimberly Catton
Copyright by Timothy G. Medearis 2016 All Rights Reserved
ii ABSTRACT
ANALYSIS OF BALL CORPORATION’S FAIRFIELD CAN MANUFACTURING PLANT AND THE POTENTIAL FOR INDUSTRIAL WASTEWATER RECYCLING
Ball Corporation is an American manufacturing company based in Broomfield, CO, which is best known for its work in the aluminum can and packaging industry. Ball Corporation has a vision of becoming a more sustainable and environmentally responsible manufacturer around the globe. With this in mind, Ball Corporation approached Colorado State University in the spring of 2015 with a request to conduct a study on the feasibility of conserving water use in its manufacturing plants.
This study is the result of that initial request. Ball Corporation’s can manufacturing plant in Fairfield, California was studied in three different phases. The first phase involved a water audit of the Fairfield plant. The can washers at the plant produce 80% of the plants wastewater and were quickly identified as the primary opportunity for recycling. City of Fairfield municipal water quality was characterized and set as the target water quality for the treatment and recycling process. By comparing the effluent industrial wastewater quality to the city’s municipal water quality, macro parameters of most concern such as suspended solids, total organic carbon (TOC), and dissolved solids were determined. Effluent water from the plant averaged a turbidity of 23 NTUs, a conductivity of 6.46 mS/µm, and a TOC of 105 mg/L, while the municipal water quality reported 0.065 NTUs, 0.346 mS/µm, and 2 mg/L of TOC.
The second phase of the study involved the actual bench scale testing of treatment processes at CSU. From June 2015 to March 2016, ten different grab samples of industrial
iii
wastewater from the Fairfield plant were sent to CSU. These samples were treated through coagulation, filtration, granular activated carbon, and reverse osmosis processes. The main results suggested that chemical coagulation was effective in removing some suspended solids, but not TOC. Electrocoagulation showed more promise in removing TOC. Ultrafiltration was very effective at eliminating suspended solids, but was unable to reduce TOC. TOC
concentrations remained high after 0.05 µm ultrafiltration and even after 1 kDa filtration. Granular activated carbon (GAC) was able to reduce and completely remove 100% of TOC concentration with high enough doses. This reduction of TOC, was helpful in reverse osmosis. Reduction in TOC with GAC proved to increase flux across the membranes and produce a more pure permeate. After bench testing, a full treatment train of electrocoagulation, ultrafiltration, GAC, and reverse osmosis was proposed. This treatment train produced water quality with a turbidity of 0 NTU, conductivity of 0.32 mS/µm, and a TOC of 0 mg/L. This matches the municipal water quality goal.
The third phase of the project involved a cost analysis of the proposed treatment train. WaterTectonics, a water treatment company out of Everett, WA, assisted CSU in providing pilot scale treatment options for Ball to consider. A 20 GPM treatment train consisting of
electrocoagulation, ultrafiltration, GAC, and reverse osmosis was compared to an identical treatment train without the electrocoagulation step. The price difference for Ball to consider between the two pilots was $30,000.
iv
TABLE OF CONTENTS
ABSTRACT ... ii
LIST OF TABLES ... vi
LIST OF FIGURES ... vii
1. Introduction ...1
2. Literature Review...4
2.1. Ball Corporation and Water Demand ...4
2.2. Overview of Industrial Wastewater Treatment and Recycling Projects ...6
2.3. Review of Treatment Technologies ...11
2.3.1. Electrocoagulation ...11
2.3.2. Dissolved Air Flotation ...13
2.3.3. Ultrafiltration ...14
2.3.4. Granular Activated Carbon ...16
2.3.5. Reverse Osmosis ...18
2.4. Purpose & Objectives ...20
3. Phase I: Fairfield Water Audit ...22
3.1. Objectives of Water Audit ...22
3.2. Fairfield, CA – Metal Beverage Packaging Division Plant ...22
3.3. General Water Audit of Plant ...23
3.4. Washer Audit of Plant ...25
3.5. Water Quality Data ...27
3.6. Discharge Water Quality Requirements ...30
3.7. Treatment and Recycling Goals ...31
3.8. Proposed Process Analysis ...32
4. Phase II: Bench Scale Testing...36
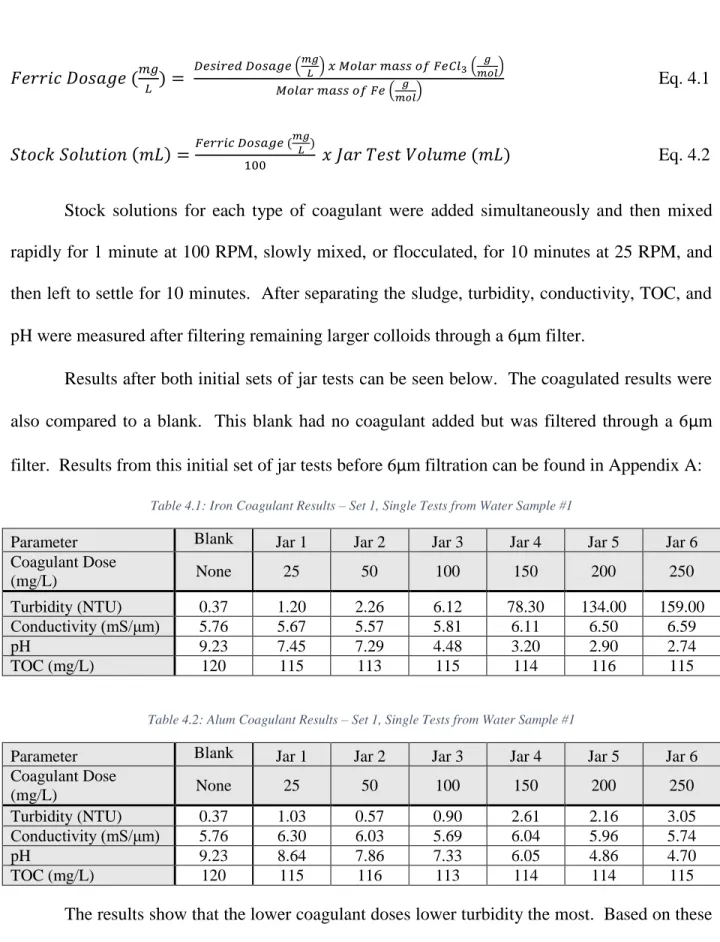
4.1. Coagulation ...36
4.1.1. Chemical Coagulants – Procedures and Results ...36
4.1.2. Electrocoagulation – Procedures and Results ...38
v
4.2. Ultrafiltration ...43
4.2.1. Small Scale Ultrafiltration – Procedures and Results ...43
4.2.2. Large Scale Ultrafiltration – Procedures and Results ...46
4.2.3. Ultrafiltration – Discussion of Results ...48
4.3. Granular Activated Carbon ...51
4.3.1. GAC – Isotherms and Small Scale Testing...51
4.3.2. GAC – Large Scale Testing and Results...54
4.3.3. GAC – Discussion of Results ...55
4.4. Reverse Osmosis ...58
4.4.1. Reverse Osmosis – Modeling and Small Scale Testing...58
4.4.2. Reverse Osmosis – Large Scale Testing ...60
4.4.3. Reverse Osmosis – Results and Discussion ...62
4.5. Full Treatment Train Comparison ...66
5. Phase III: Cost Analysis ...69
5.1. Phase III Approach ...69
6. Conclusion and Recommendation to Ball Corporation ...72
6.1. Conclusion and Recommendation ...72
6.2. Opportunities for Future Work ...72
7. References ...74
Appendix A: Coagulation ...76
Appendix B: Ultrafiltration ...79
Appendix C: Granular Activated Carbon ...82
vi
LIST OF TABLES
Table 2.1: Reported Studies with GAC Filter Bed as Pretreatment from Monnot ...18
Table 3.1: Line 1 and Line 2 Specifications – 12oz Cans ...26
Table 3.2: Line 3 Specifications – 12oz Cans...26
Table 3.3: Water Quality Results – From Multiple Sources and Labs ...29
Table 3.4: Change in Water Quality, Influent to Effluent ...29
Table 3.5: Local Contaminant Limits as Reported by City of Fairfield ...30
Table 3.6: Suggested Treatment Processes and Testing ...32
Table 4.1: Iron Coagulant Results – Set 1 ...37
Table 4.2: Alum Coagulant Results – Set 1 ...37
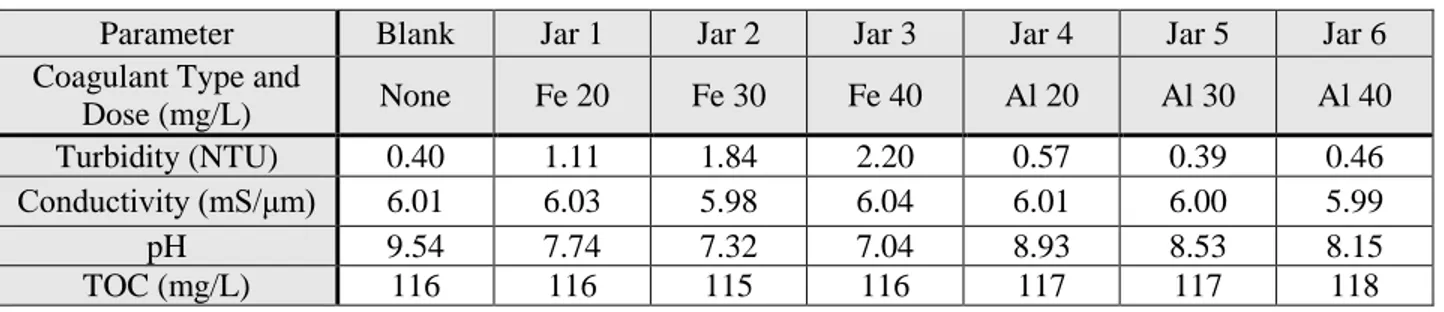
Table 4.3: Iron and Alum Coagulant Results – Set 2 ...38
Table 4.4: Initial Large EC Trial – 1x Dose ...40
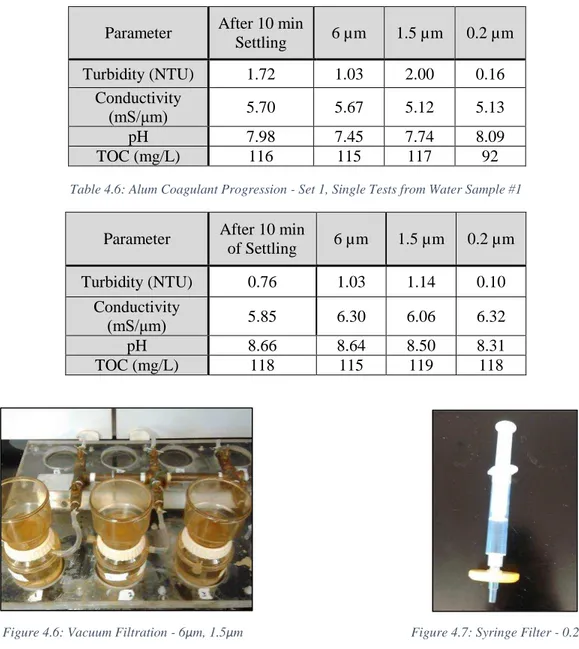
Table 4.5: Iron Coagulant Progression – Set 1 ...44
Table 4.6: Alum Coagulant Progression – Set 1 ...44
Table 4.7: Stirred Cell Results – Set 1 ...45
Table 4.8: After 6µm and 50kDa Ultrafiltration – Set 2 ...46
Table 4.9: Large Scale UF Unit Results ...47
Table 4.10: GAC Optimal Dose Test – Initial Characteristics ...52
Table 4.11: Optimal Dose Results – Alum 30 mg/L ...53
Table 4.12: Optimal Dose Results – Iron 20 mg/L ...53
Table 4.13: Optimal Dose Results – EC (1x) ...53
Table 4.14: Tested Membranes and Feed Pressures ...59
Table 4.15: Reverse Osmosis – 25 Hour Fouling Test ...62
Table 4.16: Reverse Osmosis Fouling Trial – Ion Results ...65
Table 4.17: Train 1 (With Electrocoagulation) – Results ...67
Table 4.18: Train 2 (No Electrocoagulation) – Results ...68
Table 5.1: Train 1 – WaterTectonics Cost Proposal (With EC) ...70
Table 5.2: Train 2 – WaterTectonics Cost Proposal (Without EC) ...71
vii
Table A.2: Alum Coagulation Results ...77
Table A.3: Iron Coagulation Results ...77
Table A.4: After EC and 8µm Filtration Results ...77
Table A.5: After EC, 8µm, and 0.22µm Filtration Results ...77
Table B.1: Iron Coagulation after 6µm Filtration ...79
Table B.2: Iron Coagulation after 1.5µm Filtration ...79
Table B.3: Iron Coagulation after 0.2µm Filtration ...79
Table B.4: Alum Coagulation after 6µm Filtration ...80
Table B.5: Alum Coagulation after 1.5µm Filtration ...80
Table B.6: Alum Coagulation after 0.2µm Filtration ...80
Table B.7: List of Dissolved Substances Tested by ALS Laboratories ...81
Table C.1: Contact Test Results in mg/L of TOC ...82
Table C.2: GAC Exhaustion Curve Results ...83
Table C.3: GAC Isotherm Data – Electrocoagulation ...84
Table C.4: GAC Isotherm Data – Iron Coagulation (20 mg/L) ...84
Table C.5: GAC Isotherm Data – Alum Coagulation (30 mg/L) ...84
Table D.1: WinFlows Input Data for TDS Concentrations ...86
Table D.2: Small Scale Reverse Osmosis Trials – Electrocoagulation ...89
Table D.3: Small Scale Reverse Osmosis Trials – Iron Coagulation (20 mg/L) ...90
viii
LIST OF FIGURES
Figure 2.1: Electrocoagulation Process – Copyright WaterTectonics ...13
Figure 2.2: Typical DAF System from Ross ...14
Figure 2.3: GE Hollow Fiber Membranes from GE Water ...15
Figure 2.4: WinFlows Main Interface from GE Water ...19
Figure 3.1: General Fairfield Plant Water Flow Schematic for Entire Plant ...24
Figure 3.2: Fairfield Washer Water Flow Schematic – Lines/Washers 1-3 ...27
Figure 3.3: Amicon Stirred Cell Ultrafiltration Unit ...34
Figure 3.4: Millipore 1 kDa Filter...34
Figure 3.5: B-KERTM 2 Liter Mixing Jar ...35
Figure 3.6: Jar Test Mixer ...35
Figure 3.7: SartoriusTM Vivaflow 50 ...35
Figure 3.8: SterlitechTM SEPA CF Filter ...35
Figure 4.1: EC Control Unit ...39
Figure 4.2: EC Cell ...39
Figure 4.3: Chemical Coagulants – pH ...41
Figure 4.4: Electrocoagulation and Ultrafiltration – TOC Reduction ...41
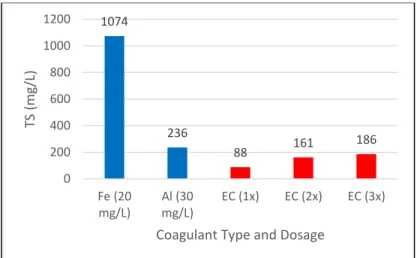
Figure 4.5: Sludge Production – Total Solids Comparison (mg/L) ...42
Figure 4.6: Vacuum Filtration - 6µm, 1.5µm ...44
Figure 4.7: Syringe Filter - 0.2µm ...44
Figure 4.8: Large UF Unit and Diagram ...47
Figure 4.9: Chemical Coagulant Turbidity Progression – Set 1, 25 mg/L Doses ...48
Figure 4.10: Conductivity Progression - Set 1 ...49
Figure 4.11: pH Progression - Set 1 ...50
Figure 4.12: Optimal Contact Time Results ...52
Figure 4.13: GAC Exhaustion Test - Small Column ...54
Figure 4.14: 1” Diameter Column ...54
Figure 4.15: 3” Diameter GAC Column ...55
ix
Figure 4.17: GAC Jar Tests - pH vs. Dose ...57
Figure 4.18: GAC Jar Tests - Conductivity vs. Dose ...57
Figure 4.19: Reverse Osmosis – GE-AG WinFlow Results ...59
Figure 4.20: Large Scale Reverse Osmosis – SEPA Cell ...61
Figure 4.21: Small Scale Reverse Osmosis – TDS Comparison ...63
Figure 4.22: Small Scale Reverse Osmosis – Permeate TOC Comparison ...64
Figure 4.23: Small Scale Reverse Osmosis – Flux Comparison ...64
Figure A.1: WaterTectonics Electrocoagulation Calculator Spreadsheet ...78
Figure D.1: WinFlows Model Screen Shot – Influent Water Data Interface ...87
Figure D.2: WinFlows Model Screen Shot – Membrane GE-AK Results ...88
Figure D.3: WinFlows Model Screen Shot – Membrane GE-CE Results ...88
1
CHAPTER 1: INTRODUCTION
Corporations and large firms have recently begun to place added importance on aspects such as sustainability, low carbon footprints, and efficient energy use. Key results from a 2009 survey of corporate energy strategies found that corporations are targeting average energy savings of 20% (Prindle, 2009). By treating electricity use as a crucial means of production that can be made more efficient, corporations are not only saving money by cutting energy requirements, but also achieving favorable public relations. Leaders in sustainability and energy use are often also leaders in their industry. This trend of efficient electricity usage will soon be reflected in the area of water demand. As readily available water becomes less accessible, it’s value will increase. Corporations will give more focus to integrated, efficient water use in order to become leaders in sustainable water in their respective markets.
Treating and recycling water for reuse on site rather than discharging wastewater to the public wastewater treatment plant is one way in which corporations and manufacturers can become more efficient in their water use. Understanding the advantages and disadvantages of water reuse is crucial for a business to make a sound financial decision. By treating and recycling water on site, manufacturing plants are less exposed to drought-induced water restriction laws, have direct control over influent water quality, and can cut their water use and wastewater disposal costs (National Research Council, 2012). These benefits can be especially valuable as conventional water resources become more limited and water demand increases. Onsite treatment and reuse may be expensive, but the additional benefits outweigh the costs in many dry, populous, or water restricted areas around the world (National Research Council, 2012).
2
One of these dry and populous areas where industrial water reuse is a viable option is northern California. The historic California drought of 2015 brought about unprecedented water restrictions that threatened the survival of many businesses dependent on large amounts of municipal water. At this same time, Colorado State University professor Dr. Ken Carlson was approached by Ball Corporation executives to perform a study on the feasibility of treating and recycling wastewater effluent from their manufacturing plants. Ball Corporation produces over 50% of the aluminum cans worldwide and uses large amounts of water in the can manufacturing process to wash the cans. Initially, the proposal by Dr. Ken Carlson and Dr. Sybil Sharvelle was intended for the can manufacturing plant in Golden, CO, as per Ball Corporation’s request. However, because of the water crisis in California, the study was moved to the can manufacturing plant in Fairfield, CA. This thesis summarizes the research conducted from Ball Corporation’s Fairfield manufacturing plant.
The work presented in this thesis has been done in coordination with Ball Corporation. The bulk of the research was conducted during the summer and fall of 2015 and presented to Ball Corporation as described in the initial proposal. The initial proposal divided the research into three phases: a water audit of the Fairfield plant, bench scale testing of water treatment technologies at Colorado State University’s environmental engineering labs, and a cost proposal. These three phases are the main chapters of the report. Also included in this thesis is a literature review to provide context, a discussion of future work, and finally an appendix to show all raw data.
The remainder of this thesis can be broken down into the following chapters:
Chapter 2 consists of a literature review of published literature involving current water demand issues, industrial water reuse, and treatment technologies evaluated in this study. The
3
treatment technologies discussed in the literature review correspond to the technologies evaluated in the experimental phase of the study. Purpose and objectives of the thesis are stated at the conclusion of Chapter 2 and show how this study fits with the previous research.
Chapter 3 describes Phase I: Fairfield Water Audit. This water audit shows the initial conditions of the Fairfield can manufacturing plant including wastewater quantities and qualities. It also suggests treatment technologies that were tested in Phase II of the research.
Chapter 4 focuses on Phase II: Bench Scale Results. Water quality results obtained through bench scale modeling at CSU’s environmental engineering labs show the effectiveness of many different types of processes suggested in Phase I. Each treatment technology is evaluated thoroughly and advantages and disadvantages of each are discussed.
Chapter 5 presents the brief Phase III: Cost Proposals. Pilot scale cost proposals for water recycling at the Fairfield plant are compared and a recommendation to Ball Corporation is given.
Chapter 6 discusses a final conclusion and proposes future work for the study. Other tested results and fact sheets are included in the final appendices.
4
CHAPTER 2: LITERATURE REVIEW
2.1. Ball Corporation and Water Demand
The five Ball brothers founded Ball in 1880 and since then Ball Corporation has grown to become a company of over 14,500 employees (About Ball, 2016). The brothers first began by making wood-jacketed tin cans for products like paint and kerosene, but since their beginning Ball Corporation has engaged in over 45 different industries (About Ball, 2016). Today, Ball Corporation is best known for their aerospace and technologies program. Yet it’s their aluminum can manufacturing for soda and beer companies, like Coca-Cola and Anheuser Busch InBev, which provides much of their yearly revenue. According to Ball Coporation’s 2013 Overview report, global can manufacturing accounted for 74% of the company’s total sales and 77% of its comparable earnings. Ball Corporation also intends to grow its can manufacturing capacity by merging with its competitor Rexam PLC. IBISWorld, a comprehensive collection of industry market research and ratings, shows that Ball Corporation already holds the highest market share in the metal can & container manufacturing industry in the US at 23.7% and looks to gain another 6.6% by acquiring Rexam. Internationally, the merger would combine the top two beverage can manufactures with the combined company having 60% of the beverage can market in North America, 69% in Europe, and 74% in Brazil (Eagle, 2015). This rapid business growth is one of many reasons Ball Corporation is pursuing more sustainable and efficient water options in its manufacturing process.
The manufacturing of aluminum cans is a highly automated, process with multiple steps. Heavy, mostly recycled, aluminum coils are unrolled, cut, and stretched to form the cylindrical base shape for the can. The cans are then trimmed to a uniform height and washed thoroughly
5
for disinfection and quality. After washing, the inside of the cans are coated to protect product integrity from the acidic beverage conditions and labeled. More size adjustments are also made to the cans, and they are all checked for pinholes or other imperfections. Finally, the cans are shipped to beverage makers to be filled and capped. In all, the Ball can manufacturing process is twenty individual steps long. The washing step, step six of twenty, is by far the most water intensive step and this study’s main focus.
The water use in the can manufacturing process is a crucial component in ensuring can quality and consistency. Water resources, however, face tighter restrictions, higher demands, and greater future shortages than at any other time in history. The recent California drought brought about unprecedented water restrictions including a statewide 25% reduction in potable urban water usage, strong lawn conversion incentives, and prohibition of public street median irrigation (Exec. Order No. B-29-15, 2015). Water demand also continues to grow exponentially. According to the United Nations World Water Development Report 2015, water demand is expected to increase by 55% by 2050. Water stressed areas of the world such as southwestern United States, Middle East, China, and India contain some of the fastest growing populations. And unfortunately, the solution to this problem will likely not be to simply exploit conventional water resources. The same UN World Water Report also states that 20% of the world’s aquifers are already over-exploited. This includes California’s Central Valley aquifer, which according to USGS data, has lost 74 billion cubic meters of water since 1960. Once water from these aquifers is used up, it could be gone forever since it often takes thousands of years for surface water to recharge aquifers.
Even with these growing water stressors, Ball Corporation rarely is unable to secure consistent, high quality tap water in the United States and other developed nations. However,
6
water rights issues and water reliability worries have become concerns for Ball in less developed countries. In addition, droughts in developed nations, such as the drought in California, threaten to result in water restrictions. If their manufacturing plant in Fairfield, CA, was required to cut water use by 50%, production would likely drop by 50%. For a company highly invested in an industry where the profit margins are small, any cut in water use could be devastating. Ball Corporation understands their dependence on high quality, reliable tap water and realizes the opportunity on-site water treatment and recycling could bring to their business.
Many businesses and corporations today monitor their energy efficiency and generate positive public relations through zero carbon footprint or “green” initiatives. Few companies, however, value water the same way they value energy. On-site water treatment and recycling could propel Ball Corporation as an instant leader in responsible water management. It also fits very well into Ball Corporation’s new company vision. Ball’s most recent initiative, the Drive for 10 vision, strives to balance economic, environmental, and social impacts for greater long-term success. By pursuing more advanced water solutions like treating and recycling their industrial water use, Ball Corporation leverages their know-how and technological expertise to provide a competitive advantage.
2.2. Overview of Industrial Wastewater Treatment and Recycling Projects
In the Federal Water Pollution Control Act Amendments of 1972, industry was required to achieve the goal of zero discharge by 1985. This was an incredibly lofty goal, which has not nearly been satisfied today, but it set into motion the incentive for industries to reuse/recycle their wastewaters. Reclaimed or recycled water use on a volume basis is expected to grow at an estimated 15% per year in the United States with applications ranging from irrigation of golf courses to groundwater recharge (Miller 66, 2006). Today, only 7.4% of wastewater is
7
reclaimed and reused, which suggests enormous potential for growth in this field (Miller 66, 2006). Early applications of water reuse involved irrigation of golf courses and landscapes because these operations were more economically feasible. Beginning applications of water reuse in the United States occurred in California, Florida, and even at Grand Canyon National Park. These reuse applications all involved treating general wastewater to a basic, less expensive level and using it in ways that minimize human contact. However, as treatment technologies have improved and become less expensive, specific industrial wastestreams have become more economically feasible for advanced treatment and reuse. Water reuse becomes more practical when social benefits, local economic development, watershed benefits, and public health improvements are taken into account (Miller 68, 2006). Multiple case studies on specific industrial wastewaters and their reuse exist and are summarized in the following paragraphs. This should provide some context to the Ball reuse project and this thesis.
In Jamnagar, India, one of the world’s largest oil refinery’s utilizes water treatment and reuse. The refinery itself has a capacity of 1.2 million barrels per day, which contributes an average of 48,000 m3/day of wastewater to the reclamation facility (Lahnsteiner, 2005). The reclamation facility segregates wastewater into four identical wastestreams. Two streams are designed for low total dissolved solids concentration (LTDS) and are treated to an effluent quality adequate for reuse in cooling water, fire water, and irrigation. Another stream, the high total dissolved solids stream (HTDS) is composed of process and oily wastewaters and is treated to a level adequate for re-use as partial make up in a sea water cooling tower (Waterleau, 2016). The general treatment process consists of oil removal through an API-separator and dissolved air flotation, biological treatment (biotowers with plastic packings and activated sludge process), tertiary filtration (dual media filters), and polishing with granular activated carbon (Lahnsteiner,
8
2005). The combination of these processes results in treated waters with below 5 mg/L total suspended solids, 50 mg/L COD (chemical oxygen demand), 5 mg/L oil and grease, and a pH range of 6-8. Operating costs for this plant amount to $0.36/m3 with a third of the costs coming from capital expenses. This total cost is more economical and environmentally sustainable than the alternative: seawater desalination (Lahnsteiner, 2005).
Another industry which has employed water reuse is the textile industry. Large amounts of water are used throughout many textile operations including the production of dyes, fabric preparation, and washing of the fabric after each step. According to the United States EPA, a textile unit producing 9,000 kg/day of fabric consumes 36,000 liters of water (Shaikh, 2009). Not only does the textile industry consume large quantities of water, but valuable and persistent chemical products are discharged at a high rate. Recycling strategies can not only conserve water, but also help in the recovery of valuable chemical products. Schoeberl, Brik, Braun, and Fuchs published a case study in 2004 which developed a recycling concept for a specific textile processing case (the specific company/textile mill was left confidential).
In this case study, the standard of treatment for the effluent wastewater was a water quality to be reused directly into the textile industry process. In order to achieve this, a multi-stage process requiring combinations of biological and physicochemical techniques was applied. Effluent water treated from the textile mill was taken both from the final outfall where all the wastestreams were combined and from the washing process, where a specific waste stream could be isolated. Treating the water solely from the final outfall was more desirable, but more costly. The washing process waste stream, although easier to treat, contained significant amounts of oily substances. The main processes evaluated in this case study to treat both types of effluent water were membrane bioreactors (MBRs), oxidative processes, and ultrafiltration and nanofiltration
9
units. For the end-of-pipe effluent water, a combination of the MBR and nanofiltration process was determined to be most effective. The MBR reduced COD significantly (75-91%), but required nanofiltration to fully remove color and conductivity to adequate levels. For the washing water effluent, ultrafiltration tests were performed and rejection of COD and lipophilic substances were monitored. Rejection of COD was consistently above 75% and removal rate of lipophilic substances was even greater at above 83%. In conclusion, MBR treatment, nanofiltration, and ultrafiltration were all beneficial methods in treating industrial wastewater from textile processes.
The third and final example for industrial reuse is from the hydraulic fracturing industry. Hydraulic fracturing is the process of pumping millions of liters of water, sand, and other chemicals underground into tight shale rock formations in order to release the oil and gas to the surface. Hydraulic fracturing produces large amounts of wastewater, known as produced water, which traditionally has been disposed of in deep injection wells. However, as water treatment technologies become more affordable, disposal wells fill up, and regulations increase, produced water has been treated and reused more frequently.
How the produced water is treated and reused depends on the shale being fractured and quality of the produced water. For example, according to the EPA’s 2011 Technical Workshops for the Hydraulic Fracturing Study proceedings, the Chesapeake Energy Corporation hydraulically fractures four different types of shales, with four different water qualities, requiring four different levels of treatment for reuse (Mantell 53, 2011). Depending on the type of reuse, Chesapeake Energy Corporation can decide to use conventional treatment (flocculation, coagulation, sedimentation, filtration, lime softening) or pair conventional treatment with more
10
advanced treatment technologies (reverse osmosis, thermal distillation, evaporation) to achieve a more pure water quality.
Generally, reuse of produced water involves the recycling of produced water to fracture more shale plays. In these cases, it is often necessary to only remove the suspended solids from the produced water in order to recycle it. Talisman Energy USA Inc. claims to have successfully operated using blended frac solutions of produced water where the only treatment applied was physical settling. In their case study published by the EPA, all particles greater than 30 micron were settled out of the produced water solution based on Stoke’s law. A blended frac solution of approximately 50,000 mg/L TDS was used from this treated water with no apparent negative impacts on the formation of gas production (Minnich 62, 2011). If certain ions like barium, calcium, magnesium, and strontium do create scaling or hardness problems, sodium sulfate, soda ash, and lime are required to remove these metals (Minnich 61, 2011).
Though energy companies have largely been hesitant to used recycled frac waters with such high TDS concentrations, the cost effectiveness compared to using treated produced water which matches fresh water quality is drastic. Removal of TDS is a very energy intensive process, especially for produced waters that can have TDS concentrations as high as 260,000 mg/L. Still, if produced water is to be reused for any other purpose other than reuse in hydraulic fracturing, more rigorous treatment is required. In the Barnett shale play, mechanical vapor recompression thermal distillation process is the most capable alternative as it can handle a wide range of brines (10,000 mg/L – 120,000 mg/L TDS) while achieving over 70% efficiency in water recovery. Reverse osmosis is also another viable option. Reverse osmosis has achieved 60% recovery for TDS concentrations below 40,000 mg/L TDS (Hayes 70, 2011).
11
Using these case studies from various industries, certain water treatment technologies and methods were identified for further research. Feasibly to Ball Corporation’s case and accessibility to bench scale treatment methods influenced which treatment methods were selected for further research. The following section of the literature review focuses on the technologies researched, tested, and proposed to Ball Corporation during the course of the study.
2.3. Review of Treatment Technologies
After reviewing the literature and analyzing other industrial wastewater reuse case studies, different water treatment technologies were researched individually to determine the best options for Ball wastewater in Fairfield, CA. Of the researched options, five technologies are present in the final treatment train in some capacity. These five technologies are electrocoagulation, dissolved air flotation, ultrafiltration, granular activated carbon, and reverse osmosis. The following section of the literature review presents the research collected on these five technologies.
2.3.1 Electrocoagulation
Electrocoagulation is an electrochemical method of treating polluted water whereby sacrificial anodes corrode to release active coagulant precursors (usually aluminum or iron cations) into solution (Holt, 2004). This alternative to traditional chemical dosing of coagulants has been used in water treatment since 1887 (Vik 1355, 1984). Today, electrocoagulation is typically used in small wastewater treatment operations due to availability of chemical coagulants. It has been successfully applied to municipal wastewater operations, however, in the past. In 1911, electrolytic wastewater treatment plants were used in Santa Monica, CA, and were praised for their relative lack of odor and high quality effluent (Vik 1355, 1984).
12
Electrocoagulation follows the same principles of treatment as chemical coagulation with ferric chloride or alum, but does so through electrolysis. Instead of chemical coagulants such as ferric chloride (FeCl3) or aluminum sulfate (Al2(SO4)3) disassociating in water to form the
aqueous coagulating agents, Fe3+ and Al3+ are directly corroded off the sacrificial anode. At the same time, the cathode produces small amounts of hydrogen gas through hydrolysis that occurs due to the electric current. As wastewater flows past the anode and cathode plates, it mixes with the dissolved coagulant and flocculation begins. The dosage of coagulant added can be controlled according to Faraday’s law. Coagulant dosage can be increased by raising the electric current density or adjusting the time the sacrificial anode is in contact with the wastewater, by either slowing the flow rate or increasing the batch time (Vik 1356, 1984).
Electrocoagulation is different from chemical coagulation in a number of ways. It provides the advantage of less chemical handling, which Ball Corporation found very beneficial. Depending on the size of the electrodes used as well, replacement generally occurs on a yearly basis (Vik 1360, 1984). Electrocoagulation does increase electricity usage compared to chemical coagulants, but this added cost is likely recovered through a decrease in sludge production and disposal. Because iron or aluminum cations are directly produced without the addition of their anions, fewer solids are formed but the same coagulation process is achieved. In theory, operation and maintenance of the system should be simpler and require less technical expertise and oversight than chemical coagulant addition.
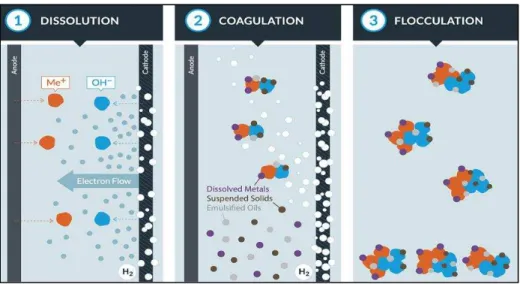
WaterTectonicsTM, a water treatment company based out of Everett, WA, provided the electrocoagulation equipment used for this study. The diagram on the following page shows WaterTectonicsTM interpretation for the electrocoagulation process.
13
Figure 2.1: Dissolution, Coagulation, and Flocculation of Electrocoagulation Process - Copyright WaterTectonics
2.3.2 Dissolved Air Flotation
Dissolved air flotation (DAF) is a physical/chemical method of pretreatment for municipal and industrial wastewaters. DAF systems remove oils & greases, suspended solids, and biological oxygen demand very effectively. For the past fifty years, DAF systems have been frequently used to provide wastewater pretreatment, product recovery, and thickening of biological solids in industries ranging from food processing to pulp and paper to petrochemicals (Ross).
DAF systems operate to form waste sludge through two main processes: adsorption and flotation, and settling. The wastestream first flows into a contact cell chamber where the coagulant is applied. After application, the water with the coagulant flows into a large, generally rectangular separation tank where sludge is produced. In the separation tank, contaminants can either adsorb to pressurized microbubbles and float to the surface, or settle to the bottom of the tank. Surface sludge is removed by a skimmer, which removes the floating sludge at the outlet of the tank. Settled contaminants are removed by an auger at the bottom of the tank (Ross). Both sludges are combined together into one wastestream that can be filter pressed and disposed
14
of in later processes. Treated water flows out of the DAF through an effluent discharge chamber (Ross). Figure 2.2 below shows the basic components of a typical, industrial DAF unit.
Figure 2.2: Typical DAF System Including Skimmer and Coagulation Chamber (Ross)
DAF operations are beneficial in removing a variety of contaminants from large flows of water. Advantages for DAF over traditional settling processes include better treated water quality, rapid start up, high rate operation, and a thicker sludge (Rodrigues 1). DAF is an excellent pretreatment process before any type of filtration is applied to the wastewater. With little operation and maintenance, DAF can remove a high amount of suspended solids and reduce fouling in later treatment steps. DAF can also be combined with multiple different types of combinations of coagulants to provide flexibility to the operation. At the Ball manufacturing plant in Fairfield, a DAF treatment system is the final treatment applied before the wastewater is discharged to the municipal wastewater treatment plant.
2.3.3. Ultrafiltration
Ultrafiltration is an advanced method of water treatment used to remove small colloids, bacteria, and other undissolved contaminants. In the past two decades, ultrafiltration has been one of the most important technological advances in water treatment due to its small amount of
15
required floor space and high removal rate (Chew et al. 3153). Differences in pore size are the only variable that determines the three different types of membrane filtration (microfiltration, ultrafiltration, and nanofiltration). Ultrafiltration is the middle of the three types with an average pore size between 0.05-0.5 μm; still fine enough to remove 99% of turbidity or suspended solids (Chew et al. 3153). This level of removal has made ultrafiltration a common treatment technique in both drinking water and industrial water treatment plants around the world.
Ultrafiltration can be operated in a number of different ways. Ultrafiltration through direct filtration pressurizes the wastestream directly through the filter in a dead end operation. Alternatively, a crossflow technique can be utilized where the wastestream flows parallel to the membrane and is recycled continuously across the membrane. However, of all the different methods, hollow fiber ultrafiltration methods are most commonly used to filter larger quantities of wastewater. Hollow fiber filters maximize membrane surface area and conserve floor space. Hollow fiber membranes are placed in chambers containing the wastewater. When the chamber is pressurized, wastewater is forced into the hollow fibers and flows up through the fibers and to the outlet. Figure 2.3 below shows a series of GE ultrafiltration hollow fiber membranes.
16
Ultrafiltration membranes can be manufactured from a number of different materials including ceramics and polymers. By selecting the optimal material and pore size for the type of wastewater to be filtered, fouling of the ultrafiltration membrane can be reduced (Chew et al. 3153). Membrane fouling is the result of foulants and particles building up on the membrane surface, plugging the membrane pores, or adsorbing within the membrane pores (Walker 228). When an ultrafiltration membrane fouls, flux through the membrane is reduced, removal rate may drop, and costs rise. Periodic backwashing and adequate pretreatment can reduce fouling of ultrafiltration membranes, but over time permanent fouling will take place and membranes will have to be replaced entirely.
Fouling of ultrafiltration membranes is one of the main operational concerns in ultrafiltration. Organic matter is one of the main contaminants known to foul organic membranes significantly (Walker 228). Relatively high costs compared to traditional media filtration processes are another reason ultrafiltration has not become widely used in water treatment (Chew et al. 3153). However, due to improvements in production of membranes, ultrafiltration and other advanced membranes may become more commercially viable than conventional systems (Chew et al. 3161).
2.3.4. Granular Activated Carbon
Granular activated carbon (GAC) is a specialized form of carbon designed to have low-volume pores to increase the surface area and adsorb dissolved contaminants. Adsorption with GAC has become a widely accepted form of treatment for removing organic contaminants from groundwater, wastewater, and industrial wastestreams (Stenzel, Merz 257). GAC is cost-effective and applicable process for natural organic matter (NOM) removal in drinking water treatment plants (Gibert et al. 2821). GAC filters are not only used for large scale water
17
treatment, but also localized water purification. GAC and powder activated carbon (PAC) systems are widely available in commercial forms for homeowners to purchase and install in their refrigerators and homes.
GAC is essentially a specialized form of charcoal. Through chemical and physical processes, GAC producers are able to drastically increase the amount of pore space in common charcoal to provide much more adsorption capacity. When wastewater flows through a GAC filled column, contaminants, especially organic contaminants, are adsorbed and trapped inside the abundance of pores. GAC filters can either be operated as purely physical, adsorption water treatment processes, or as a biological process as well. By allowing bacteria to form in GAC filters, biodegradation can contribute to the overall NOM removal. Over time, progressive clogging of GAC filters takes place as pore space is exhausted and biological material increases overall head loss (Gibert et al. 2822). When this occurs, GAC must be either regenerated or replaced to recover its adsorption capacity.
GAC adsorption can be optimized by selecting the most effective GAC pore size’s that match the organic material targeted for removal (Gibert et al. 2822). Considerable efforts have been made in prior studies to determine the relationship between NOM constituents (molecular weight, degree of hydrophobicity, and charge distribution) and physical properties of different types of GAC (surface area, porosity, etc.). However, much remains unknown about the sorption behavior of NOM constituents or groups (Gibert et al. 2822). Optimal sorption can be achieved by lengthening contact time between wastestream and GAC, preventing clogging of the filter, and pretreating the wastestream with coagulation, DAF, or ultrafiltration. Studies have shown that ultrafiltration in particular, when combined with GAC treatment, can make an excellent pretreatment for reverse osmosis and other advanced water treatment processes (Monnot et al. 1).
18
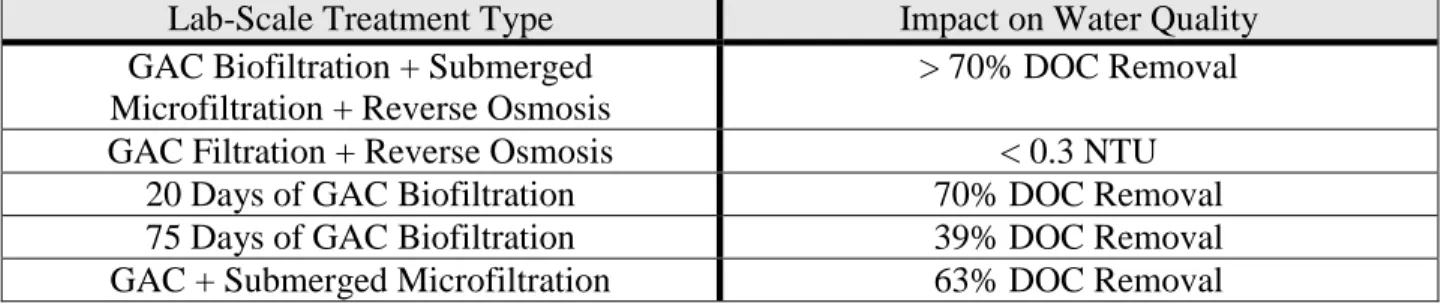
The table below from Monnot’s study on granular activated carbon combined with ultrafiltration as a pretreatment for seawater reverse osmosis shows how effective GAC treatment can be in any form. GAC filtration can not only remove dissolved organic carbon (DOC) but also reduce turbidity.
Table 2.1: Reported Studies with GAC Filter Bed as Pretreatment before Seawater Reverse Osmosis (Monnot 2)
Lab-Scale Treatment Type Impact on Water Quality
GAC Biofiltration + Submerged Microfiltration + Reverse Osmosis
> 70% DOC Removal
GAC Filtration + Reverse Osmosis < 0.3 NTU
20 Days of GAC Biofiltration 70% DOC Removal
75 Days of GAC Biofiltration 39% DOC Removal
GAC + Submerged Microfiltration 63% DOC Removal
2.3.5. Reverse Osmosis
Reverse osmosis (RO) is one of the most advanced forms of water treatment. RO targets the removal of dissolved solids by overcoming osmotic pressure. Industries that often require ultrapure water include semiconductors, laboratory services, pharmaceuticals, and cleanroom laundries. RO is also one of the key water treatment processes in seawater desalination. Seawater often contains total dissolved concentrations above 30,000 mg/L and reverse osmosis is often one of the most energy efficient processes to remove this high total dissolved solid (TDS) load to produce potable water. Today there are over 21,000 reverse osmosis desalination plants in operation around the world with the Middle East providing a growing share of the total demand (Poseidon Water). Worldwide, desalination plants treat and produce 13.2 billion liters of potable water each day (Poseidon Water). As dry, coastal areas continue to grow, desalination plants and reverse osmosis will become more necessary technologies to provide adequate supply to meet water demand.
Reverse osmosis operates by highly pressurizing feed water to exceed the natural osmotic pressure. When osmotic pressure is exceeded, feed water may be forced through a
19
semipermeable membrane. Although RO is similar to other membrane applications, separation efficiency is not dependent on the pore size, but instead on solute concentration, pressure, and water flux rate. Water molecules must individually diffuse through the semipermeable membrane. Semipermeable membranes can be constructed from a variety of different materials. Membranes can be fabricated from many different polymers, can have cellulose films, and can even be combined with filtration membranes to create composite membranes (Petersen 81). General Electric, DOW, Toray, and TrisSeps are just a few of the companies who produce many different types of reverse osmosis membranes. Different membranes are designed to operate at a variety of pressures, pH ranges, fluxes, rejection rates, and influent water qualities. With so many variables and parameters to keep track of, computer models have been developed to predict RO operation. The main interface for General Electric’s modeling software, WinFlows, is shown in the figure below.
Figure 2.4: WinFlows Main Interface (GE Water)
Like membrane filtration processes, reverse osmosis can be operated in a dead-end process or a cross flow operation. Either option produces the waste from the reverse osmosis
20
process: brine. Brine is the highly contaminated, high TDS wastewater which accepts all the contaminants removed from the clean, permeate water. In desalination operations, brine water is often piped out deep into the ocean to allow for dilution of the brine.
Because it is one of the few water treatment processes able to remove TDS, reverse osmosis is an extremely valuable process. RO allows for a variety of removal rates and can be automated for much of its operation. However, RO has some limitations. Extensive pretreatment, including some form of membrane filtration, must be included in order to prevent immediate fouling of the RO membranes. Membrane fouling deteriorates the performance of membranes by reducing overall flux and impairing effluent water quality which then increases both capital and operational costs (Tang et al. 330). High energy requirements and technical expertise also make RO operations difficult to implement. However, studies have shown through economic analysis that the investment in RO systems can be cost-neutral with current estimates for associated expenses in some industries (Petrinic 299). Like membrane filtration processes, RO membranes are becoming more feasible as producers become more adept at membrane production and scarcity of traditional water sources increases.
2.4. Purpose & Objectives
The severe drought in California has caused many individuals, corporations, and other institutions to evaluate their water resources. Ball Corporation understands the necessity of available, high quality water in its can manufacturing process. Ball Corporation also understood that a unique opportunity to become a corporate leader in the field of industrial water reuse was available to them. As part of their sustainability goals, Ball Corporation wished to pursue ways in which their manufacturing operations might become more environmentally friendly. Ball Corporation approached Colorado State University with the purpose of understanding how their
21
business can better reuse and manage water in not only their Fairfield manufacturing plant in California, but all over the world. Ball Corporation The purpose of this study was to evaluate Ball Corporation’s current production process and present them with an assessment for how their operations could be feasibly altered to conserve water resources.
The objectives for the project as determined by Dr. Sharvelle and Dr. Carlson in May 2015 are as follows:
1) Using Ball Corp. manufacturing plant in Golden, CO as the initial study site, develop scenarios (wastewater quality and water quality goals) and simple models for recycling plant wastewater for beneficial use. Based on identified recycling scenarios, define potential treatment processes to achieve goals.
2) Conduct bench scale and/or pilot scale testing of treatment processes defined in 1). Define treatment trains that will accomplish water quality goals using wastewater from Golden plant.
3) Based on recycling scenarios and lab testing, develop cost model for Golden plant to encompass alternatives for recycling including beneficial use and fraction of water recovered.
Since these initial objectives were first brought to Ball, the only change has been the plant location to be analyzed. Instead of studying the manufacturing plant in Golden, CO, the Fairfield, CA, plant was chosen based on the impact caused by the California drought.
22
CHAPTER 3: PHASE I: FAIRFIELD WATER AUDIT
3.1. Objectives of Water Audit
The first step in this study was to conduct a water audit on the Fairfield plant. This water audit was necessary to fully understand the Fairfield plant’s operation, its water flows in terms of flow quantity and water quality, and what possible options were available to recycle effluent water. This water audit was completed in July 2015 and formed the basis to the later developments and decisions in this study. Without the initial water audit, a complete, well informed final proposal to Ball Corporation would not have been possible.
The main sections of this Phase I report focus on the water audit of the current facility (where water flows, how much, and of what quality), the current water quality being supplied and discharged by the plant to the POTW, and specific water treatment processes which were further analyzed in Phase II. Bench scale test methods to analyze these specific water treatment processes are suggested to further analyze their effectiveness. These bench scale tests were completed as part of Phase II of the study and are presented in Chapter 4 of this thesis.
3.2. Fairfield, CA – Metal Beverage Packaging Division Plant
The Ball manufacturing plant is located in Fairfield, CA, a city of about 100,000 people halfway between Sacramento and San Francisco. Like many of Ball’s manufacturing plants, the Fairfield plants operates very rapidly; in 2014 Ball reported 2.3 billion cans produced from the plant. This level of production, however, required 114 million liters in 2014, costing the plant about $172,000. This municipal water is used in a variety of plant operations. Accounting for these different water uses was the first step in the water audit. After accounting for the different
23
uses and quantifying the flows, water quality data was then acquired, and analyzed to optimize the most efficient methods to recycle effluent water.
3.3. General Water Audit of Plant
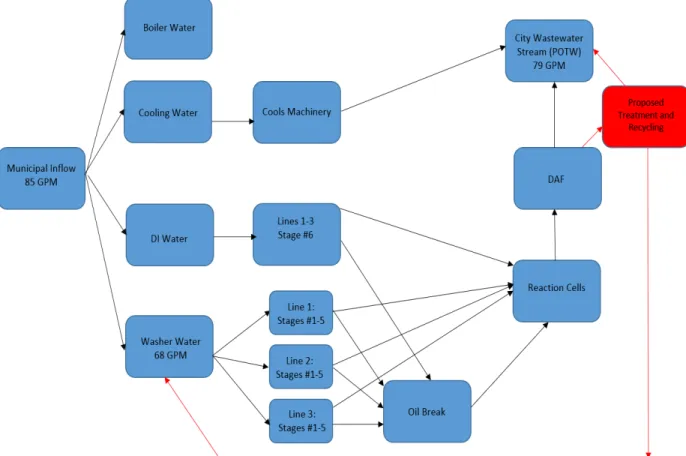
Approximately 85 GPM of municipal water flows into the plant when in operation. This
water is then divided into separate flows for separate purposes. Some of the water is boiled to heat the building, some is used to cool equipment throughout the plant, but most is used in the three washers on the three production lines. Of the 85 GPM brought in by the plant, approximately 68 GPM are used in the three washers. This accounts for 80% of the plant’s water usage.
The three washing lines use 21 GPM, 26 GPM, and 21 GPM respectively, adding up to 68 GPM. These washers have six different washing/rinsing stages. The first five stages use municipal water, and in the sixth stage, deionized water from an ion exchange unit is used to completely rinse and sterilize the cans. During the washing process, the water is adjusted at each stage for different pH levels and collects contaminants off of the aluminum cans. After flowing through the washers, the majority of the water enters the oil break (some of the wastewater skips the oil break and flows directly to the reaction cells). At the oil break, oils and greases are removed from the effluent through de-emulsification. After the oil break, the wastewater flows into reaction cells. These four reaction cells adjust the effluent pH level to meet the city discharge requirements. Finally, the water flows into the dissolved air flotation (DAF) unit. Here, MegaFloc is added as an organic coagulant. The DAF unit removes solids with an auger at the bottom of the tank and oils with a skimmer at the surface. Much of the MegaFloc coagulant is removed on the surface with the skimmer, but some was clearly able to escape the DAF unit with the treated water. After flowing through the DAF, the effluent water is measured using a
V-24
notch weir at Outfall II. Following the weir, water used to cool the machinery is added to the washer water effluent and discharged to the POTW. This brings the total amount of effluent water discharged through Outfall II to approximately 79 GPM.
The schematic on the below (Fig. 3.1) shows the general layout of water flows throughout the Fairfield plant. Blue boxes represent existing infrastructure, while the red box and arrows represent the proposed recycling and treatment processes. Because washer water consumes 80% of the influent, the CSU team decided it was the most feasible to isolate and focus on treatment for recycling. The boiling and cooling lines are relatively small and are already very efficient. Therefore, only the washer water (which contributes to 80% of the plant’s water use) would be connected to any proposed treatment and recycling system.
25
3.4. Washer Audit of Plant
After the general plant water audit, a more specific analysis of the three can washers was conducted. A washer flow schematic (Fig. 3.2) is shown on the following page. In Figure 3.2, the six different stages are shown, along with the drag out tanks, and the counter flow mechanisms. The six stages are the prewash (Stage 1), wash (2), 1st rinse (3), 2nd rinse (4), final rinse (5), and DI rinse (6). Of these six stages, municipal water is pumped into Stages 1, 2, and 5 at a rate of approximately 21-26 GPM per washer. DI water is pumped into Stage 6 exclusively and re-circulated until the conductivity exceeds 130 µS/cm at which point the DI water must be retreated and replaced. Ion exchange units currently treat municipal water to supply the DI water for the final rinse.
Attached to Stage 3 and 5 are drag out tanks that help to conserve water by allowing a space for water to collect and be moved through a counter flow process. The counter flows (shown as red curved arrows in Fig. 3.2) also help to conserve water by reusing water from later stages in earlier stages. Also in Fig. 3.2 are the wastewater flows to reaction cell #1 and the oil break. Most of the wastewater from the washers goes to the oil break and then the reaction cells, as shown by the grey arrows. However, L1 Stage #2, L2 Stages #2, 5, 6, and L3 Stages #2, 5, 6 wastewaters skip the oil break and directly enter reaction cell #1, as shown by the brown arrows. From reaction cell #1, all of the washer effluent flows into the three other reaction cells, the DAF, Outfall II, and finally to the Fairfield POTW.
Each stage of the washer also has its own specific requirements in terms of pH, conductivity, and temperature. Table 3.1 and 3.2 show these specifications. It should be noted that Drag Out #2 is the only tank with no requirements. Water in this drag out is very similar to the initial water used in Stage 5 so it is not necessary to monitor it. Also of note are the large
26
swings in pH the cans undergo through the washing process. Initially, cans are prewashed with very acidic water and then cleaned with very basic water. pH somewhat stabilizes by Stage 5, but the initial pH swings are important to acidify and then cleanse any residue on the surface of the can. Very few differences exist between Line 1 & 2 specifications versus Line 3. Following these tables is Figure 3.2, which as mentioned, shows the washer flow layout and flow quantities.
Table 3.1: Line 1 and Line 2 Specifications – 12oz Cans (As Reported by the Fairfield Plant)
Stage pH Conductivity (µS/cm) Temperature (oF)
1 1.8 – 2.0 4.2 120 - 140
2 11.55 – 11.85 10.5 110 - 125
3 (Drag Out #1) 1.75 – 1.95 N/A 115 - 130
4 N/A 470 (1000 Max) N/A
5 4.0 – 4.5 500 N/A
6 N/A 40 – 130 N/A
Table 3.2: Line 3 Specifications - 12oz Cans (As Reported by the Fairfield Plant)
Stage pH Conductivity Temperature
1 1.8 – 2.0 4.2
120 – 140 (115 – 125 for 7.5oz
and 5oz cans)
2 11.7 – 12.0 10.5 110 - 125
3 (Drag Out #1) 1.75 – 1.95 N/A 115 - 130
4 N/A 470 (1000 Max) N/A
5 4.0 – 4.5 500 N/A
27
Figure 3.2: Fairfield Washer Water Flow Schematic – Lines/Washers 1-3
3.5. Water Quality Data
To fully complete the water audit, not only did the flows have to be separated and quantified, but also tested for specific water quality parameters. The influent and effluent water qualities were determined through records received from the Fairfield plant managers, lab testing done at CSU, and lab testing performed at ALS Laboratories in Fort Collins, an EPA certified lab.
The two types of water tested were the influent municipal water and the effluent water from Outfall II. These samples were tested in order to understand the degree of treatment required to recycle the effluent in the washers to closely match the influent municipal water quality. Cooling and boiling waters were not tested due to their relatively small flows in the plant and lack of chemical reactions. The DI water was also assumed to be almost completely
28
pure with extremely low solids concentrations so it was also not tested. Grab samples of water in between washing steps are possible future samples that could be tested to better understand how the washing process affects water quality.
On the following page in Table 3.4 are water quality results for the Fairfield municipal water (WQin) and Outfall II water (WQout). Water quality parameters for influent and effluent
sources were acquired from four different sources. Caltest Analytical Laboratories is a State of California certified analytical lab with whom the Ball Fairfield plant had contracted with to test its industrial wastewater data. Parameters tested by Caltest are highlighted in blue in Table 3.3. Municipal drinking water parameters are reported by the City of Fairfield and are highlighted in green. These municipal water quality values come from the City of Fairfield’s 2013 Consumer Confidence Report. Parameters tested by Colorado State University in the environmental lab are highlighted in yellow. These parameters were tested in June 2015 with initial water samples shipped from Fairfield to CSU. Finally parameters tested by EPA certified ALS Laboratories are highlighted in red. Some municipal water quality parameters were deemed negligible and not tested. These parameters are marked as N/A.
29
Table 3.3: Water Quality Results – From Multiple Sources and Labs, CSU Tested Parameters from Single Sample in June 2015 Parameter Municipal Water - WQin Outfall II - WQout
Fluoride 0.894 mg/L 1.3 mg/L
Copper N/A 0.022 mg/L
Manganese N/A 0.026 mg/L
pH 7.97 9.67
Conductivity 346 μS/cm 6160 μS/cm
Salinity N/A 3,080 mg/L as NaCl
COD N/A 370 mg/L
Alkalinity 120 mg/L as CaCO3 180 mg/L as CaCO3
Turbidity 0.065 NTU 16.1 NTU
Total Organic Carbon (TOC) 2 mg/L 110 mg/L
Dissolved Organic Carbon (DOC) (Same as TOC) 104 mg/L
Total Dissolved Solids (TDS) 306 mg/L 4,900 mg/L
Total Suspended Solids (TSS) <10 mg/L 34 mg/L
Total Volatile Solids (TVS) N/A 186 mg/L
Oil & Grease N/A 8 mg/L
Total Petroleum Hydrocarbons (TPH)
N/A 3.8 mg/L
Hardness 133 mg/L 140 mg/L
The water quality results show significant differences between the influent and effluent. Parameters of most concern related to recycling the effluent are TOC, oil & grease, TDS, conductivity, and turbidity. These five parameters pose the most serious issues in terms of treating and recycling the effluent water. Salinity and COD measurements also increase significantly, but are accounted for in conductivity and TOC. Alkalinity and hardness measurements also show increases. Both conductivity and TDS measure dissolved concentrations of ions, but are both beneficial to monitor due to different measuring techniques in the field and in the lab. As a percentage, increases in the five main parameters of concern are shown in Table 3.4 below.
Table 3.4: Change in Water Quality, Influent to Effluent (Based on Table 3.3 Parameter Results) Water Quality Parameter Conductivity (µS/cm) Turbidity (NTU) TOC (mg/L) TDS (mg/L)
Oil & Grease (mg/L) % Increase (WQin
to WQout)
30
3.6. Discharge Water Quality Requirements
Recycling any amount of water will reduce the amount of water required and discharged by the Fairfield plant. Therefore, discharged water from the Fairfield plant to the municipal wastewater facility will contain higher concentrations than before treatment and recycling. The City of Fairfield has created restrictions for wastewater discharge that still need to be met if water treatment and water recycling are to be implemented.
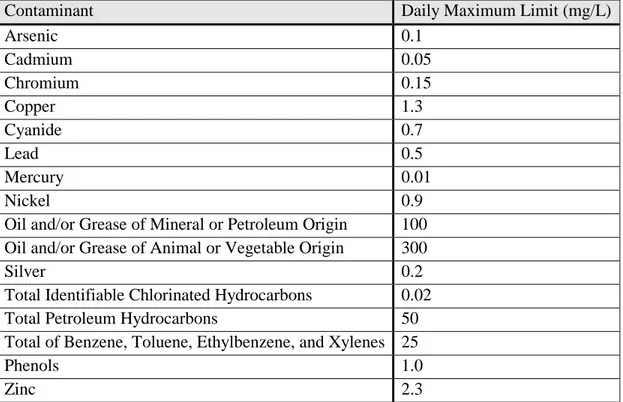
According to FAIRFIELD-SUISUN SEWER DISTRICT ORDINANCE NO. 2008-03 (Fairfield’s wastewater discharge ordinance), the pH of any waste stream must be between 6-11, lower than 130 oF, and not contain BOD levels, solids, or oils which could cause an interference in the municipal wastewater treatment process. Industrial users must comply with national categorical pretreatment standards found at 40 CFR Chapter I, Subchapter N, Parts 405–471, and state pretreatment standards found in the Porter-Cologne Water Quality Control Act, California Water Code, Division 7. Table 3.5 contains a list of local contaminant limits.
Table 3.5: Local Contaminant Limits as Reported by City of Fairfield
Contaminant Daily Maximum Limit (mg/L)
Arsenic 0.1 Cadmium 0.05 Chromium 0.15 Copper 1.3 Cyanide 0.7 Lead 0.5 Mercury 0.01 Nickel 0.9
Oil and/or Grease of Mineral or Petroleum Origin 100 Oil and/or Grease of Animal or Vegetable Origin 300
Silver 0.2
Total Identifiable Chlorinated Hydrocarbons 0.02
Total Petroleum Hydrocarbons 50
Total of Benzene, Toluene, Ethylbenzene, and Xylenes 25
Phenols 1.0
31
3.7. Treatment and Recycling Goals
Based on the water audit from the Fairfield plant, initial treatment goals were brainstormed by the combined CSU and Ball Corporation team. Ball Corporation desired a treatment system which would be relatively compact, reproducible at other manufacturing plants, not heavily reliant on chemical processes, and preferably able to be operated by a 3rd party in a design-build-operate fashion.
The first goal to determine was how much water should be recycled and from what sources. As discussed earlier, the washer water was quickly isolated as having the most opportunity for treatment and recycling improvement. As for the quantity treated and recycled, both CSU and Ball agreed to start with a conservative approach. Ball Corporation tried previous water treatment and recycling efforts in the past that had quickly failed due to overly ambitious and confident designs. A 50/50 split of recovered water to discharged water to the Fairfield POTW was agreed to be the base scenario. If proven successful, the recovery ratio could be increased in later experiments.
For water quality, both CSU and Ball were uncertain about the degree of treatment required to protect product quality and integrity. Ball Corporation has used different water qualities from around the world and had never studied the threshold for minimum water quality to produce a quality aluminum can. With this uncertainty, it was agreed that CSU would pursue a water quality as similar to Fairfield’s municipal water quality as possible.
With these water quantity and quality goals in mind and the water audit of the Fairfield plant complete, the CSU team began proposing, researching, and testing bench scale water treatment processes. The following section concludes Phase I of the study and suggests treatment processes that were thoroughly tested in Phase II.
32
3.8. Proposed Process Analysis
After considering the water quality results, requirements, general feasibility, and goals of the project, the CSU research team determined a specific set of processes to treat and recycle the effluent water in the Fairfield plant. These processes and their corresponding bench scale testing options are described in Table 3.6 below.
Table 3.6: Suggested Treatment Processes and Testing
Process Bench Scale Test Bench Scale
Alternatives
Contaminants Removed
Coagulation Jar Tests
Ferric Chloride
Turbidity, TOC, oil & grease Aluminum Sulfate Electrocoagulation Ultrafiltration EMD Millipore Amicon™ Stirred Cells (Traditional Flow Method) 50 kDa (~0.04 μm) TDS, turbidity, conductivity 0.1 m ultrafiltration SartoriusTM Vivaflow 50 (Tangential Flow Method) 50 kDa (~0.04 μm) Reverse Osmosis SterlitechTM SEPA CF Cell Synder FiltrationTM Ultrafiltration – Series BN 50 kDa (~0.04 μm) TDS, conductivity, salinity, hardness GE OsmonicsTM Reverse Osmosis – Series SE TriSepTM Reverse Osmosis - Series X201
Coagulation was chosen as a tested process because of its frequent use in industrial water treatment, ability to remove a variety of non-dissolved contaminants, and reliability as a pretreatment for later, more delicate treatment processes. Coagulation also has the ability to remove turbidity, TOC, and oil & grease, three of the five most concerning water quality parameters.
33
Aluminum sulfate, ferric chloride, and electrocoagulation alternatives composed the different bench scale coagulation options most readily available and feasible. Aluminum sulfate (alum) and ferric chloride (iron) were chemical coagulation alternatives, while the electrocoagulation process from WaterTectonicsTM provided an electrochemical alternative.
Ultrafiltration was selected as a proposed treatment process due to its small square footage requirements, growing popularity in all kinds of water treatment operations, and effective removal of all suspended solids and colloids. In addition, ultrafiltration can reduce turbidity down to effectively 0 NTU, which is necessary for later more delicate processes such as ion exchange or reverse osmosis. Of the five most concerning water quality parameters, ultrafiltration is the best at complete removal of turbidity, and can also remove oil & grease and TOC if these parameters make up any part of the total suspended solids concentration in the Fairfield wastestream.
Two different ultrafiltration methods, dead end filtration and tangential flow, were initially suggested for bench scale testing. The Millipore filter cell was used to test the traditional, dead end method, while SartoriusTM and SterlitechTM units were suggested to test the tangential method. Both methods were tested by CSU with 50 kDa (0.04 µm pore) size membranes. 50,000 Daltons or 50 kDa is a useful level of ultrafiltration to set as a baseline because its pore size corresponds to a variety of available commercial ultrafiltration units. Though 50kDa is a fairly standard ultrafiltration pore size, a 0.1 µm pore size was also suggested.
Reverse osmosis was chosen because of its ability to remove dissolved contaminants, adjustability to a variety of different recovery rates, and relatively low TDS concentration in the Fairfield wastestream. Reverse osmosis was determined to be a preferred alternative to remove