A Survey of Thermodynamics and Transport Properties
in Chemical Engineering Education in Europe and the
USA
Peter Ahlström1,*, Karel Aim2, Ralf Dohrn3, J.Richard Elliott4, George Jackson5, Jean Noel Jaubert6, Maria Eugénia Rebello de A. Macedo7, JuhaPekka Pokki8, Kati
Reczey9, Alexey Victorov10, Ljudmila Fele Žilnik11 and Ioannis Economou12
1 University of Borås, SE50190 Borås, Sweden; Email: Peter.ahlstrom@hb.se
2Academy of Sciences of the Czech Republic, Prague, Czech Republic, 3Bayer Technology
Services GmbH, Leverkusen, Germany, 4University of Akron, Ohio, USA, 5Imperial College,
London, UK, 6University of Nancy, France, 7University of Porto, Portugal, 8Helsinki
University of Technology, Finland, 9 Budapest University of Technology and Economics,
Hungary, 10St Petersburg State University, Russia 11National Institute of Chemistry,
Ljubljana, Slovenia, 12National Center for Center for Scientific Research 'Demokritos', Institute of Physical Chemistry, GR153 10 Aghia Paraskevi, Attiki, Greece *Presenting author
Introduction
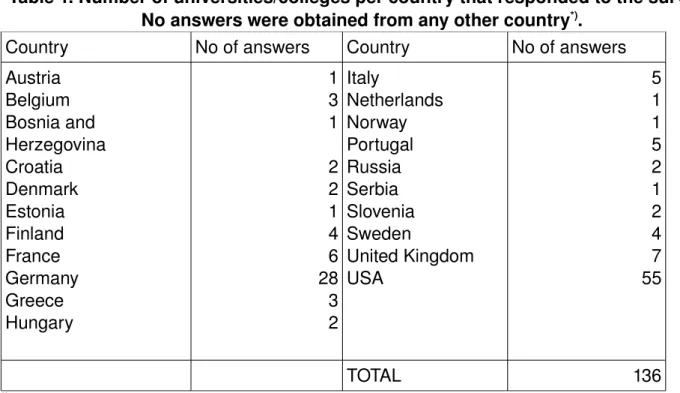
Thermodynamics and Transport Properties (TTP) is a central subject in the majority of chemical engineering curricula worldwide and it is thus of interest to examine how TTP is taught today in various countries. The contents and the organization of the courses reflect an understanding of reality (or philosophy) which often is not explicitly expressed. The discussion about different learning styles (cf., e.g., [1]) and their implication on teaching methods has also spurred us to investigate which methods are used for thermodynamics teaching, especially as thermodynamics often is regarded as a “difficult subject”. Our ultimate aim is that our results will help to improve chemical engineering education. A survey of graduate thermodynamics education in the USA only was performed a few years ago by Visco et al. [2]. As far as we know no systematic study of the undergraduate thermodynamics education has been performed, at least in recent years. In the present study, a survey about TTP education in both undergraduate and graduate programs in Europe and the USA is presented. Answers from 136 universities from twenty different European countries and the USA were collected and used for this study. This study was performed under the auspices of the Working Party of Thermodynamics and Transport Properties of the European Federation of Chemical Engineering. Methods The survey was performed using a web based surveying system (MrInterview of the SPSS package) for which invitations were sent out to the universities. Several reminders were sent out but the answer frequency was varying significantly between the different countries (cf. Table 1).Table 1. Number of universities/colleges per country that responded to the survey. No answers were obtained from any other country*).
Country No of answers Country No of answers Austria Belgium Bosnia and Herzegovina Croatia Denmark Estonia Finland France Germany Greece Hungary 1 3 1 2 2 1 4 6 28 3 2 Italy Netherlands Norway Portugal Russia Serbia Slovenia Sweden United Kingdom USA 5 1 1 5 2 1 2 4 7 55 TOTAL 136
*)Countries from which no university / college responded are not shown.
Results
Of the universities that answered more than 70 % offer B.Sc. education, 65 % offer M.Sc. education and 55 % offer Ph.D. education. Most universities offer at least two courses of thermodynamics. Half of these are taught to chemical engineers exclusively whereas the rest are taught with other branches of engineering, mainly mechanical and / or process engineering. Thermodynamics teaching in terms of quantity The amount of thermodynamics taught has been analyzed both with respect to the number of courses and their size. The number of courses reported from each university is given in Table 2 where it can be seen that a majority of the universities in Europe report more than two courses each whereas in the USA the majority reports at most two courses. Hence, most of the following discussion will be based on the first two courses reported from each university. Table 2 Number of thermodynamics courses reported at various universitiesNo of courses % Europe % USA
1 21 35 2 25 41 3 22 14 4 14 7 5 9 2 > 5 10 0
An issue that caused much confusion among the respondents was the definition of course size since no unambiguous measure of course length and work load exists. We have chosen to use the work load measured by the amount of full time study weeks per course, i.e., the intention is that if a course was expected to be studied as the only course during a given period, the value given should be the number of weeks that course was expected to fill the students time. If the student in a given program was expected to follow two courses at the same time, the week should be split between the courses according to their generated work load. In order to simplify the calculation for European universities we introduced a transformation from the European Credit Transfer System (ECTS) introduced with the Bologna agreement in Europe. 1.5 ECTS units equals approximately one week of work since one year usually contains approximately 40 study weeks and should correspond to 60 ECTS units. However, judging from the reactions of the respondents, such a measure is not familiar in many countries yet, and thus some care has to be exercised when interpreting the results regarding course lengths. Table 3. Amount of thermodynamics (as full time study weeks) forming part of different course(s)
Chem.Eng PhysChem Independ. Other
N:o of weeks %
USA % Eur % USA % Eur % USA % Eur % USA % Eur
None 8 18 31 56 31 22 28 <3 2 8 37 34 4 20 41 21 37 43 26 32 23 24 20 24 32 812 9 32 7 6 4 15 11 14 1318 13 15 4 6 4 8 2 5 1924 9 5 2 1 4 4 1 >24 24 11 6 2 “Chem.Eng.” does not include physics, physical chemistry and similar fundamental courses but only (thermodynamics in) the applied chemical engineering courses. In both regions, somewhat more than 40% spend at most 7 weeks on thermodynamics. In Europe the courses are generally less than 19 weeks whereas in the USA, one fifth spend more than one semester on thermodynamics. In general two sets of course lengths were observed, corresponding either to a full semester of full time studies or to quarter of a semester.
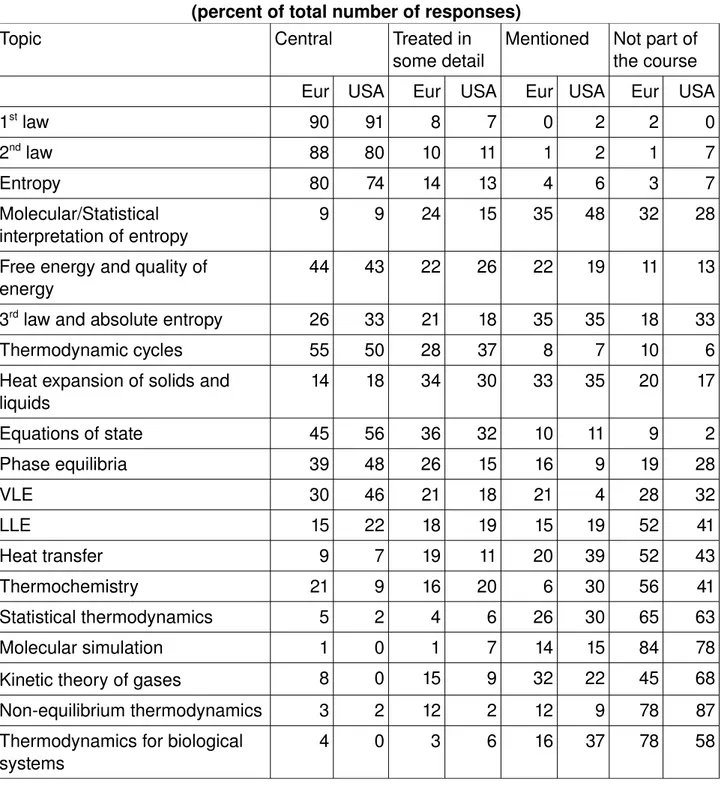
Table 4. Contents of thermodynamics course 1 (percent of total number of responses)
Topic Central Treated in
some detail Mentioned Not part of the course Eur USA Eur USA Eur USA Eur USA
1st law 90 91 8 7 0 2 2 0 2nd law 88 80 10 11 1 2 1 7 Entropy 80 74 14 13 4 6 3 7 Molecular/Statistical interpretation of entropy 9 9 24 15 35 48 32 28 Free energy and quality of energy 44 43 22 26 22 19 11 13 3rd law and absolute entropy 26 33 21 18 35 35 18 33 Thermodynamic cycles 55 50 28 37 8 7 10 6 Heat expansion of solids and liquids 14 18 34 30 33 35 20 17 Equations of state 45 56 36 32 10 11 9 2 Phase equilibria 39 48 26 15 16 9 19 28 VLE 30 46 21 18 21 4 28 32 LLE 15 22 18 19 15 19 52 41 Heat transfer 9 7 19 11 20 39 52 43 Thermochemistry 21 9 16 20 6 30 56 41 Statistical thermodynamics 5 2 4 6 26 30 65 63 Molecular simulation 1 0 1 7 14 15 84 78 Kinetic theory of gases 8 0 15 9 32 22 45 68 Nonequilibrium thermodynamics 3 2 12 2 12 9 78 87 Thermodynamics for biological systems 4 0 3 6 16 37 78 58
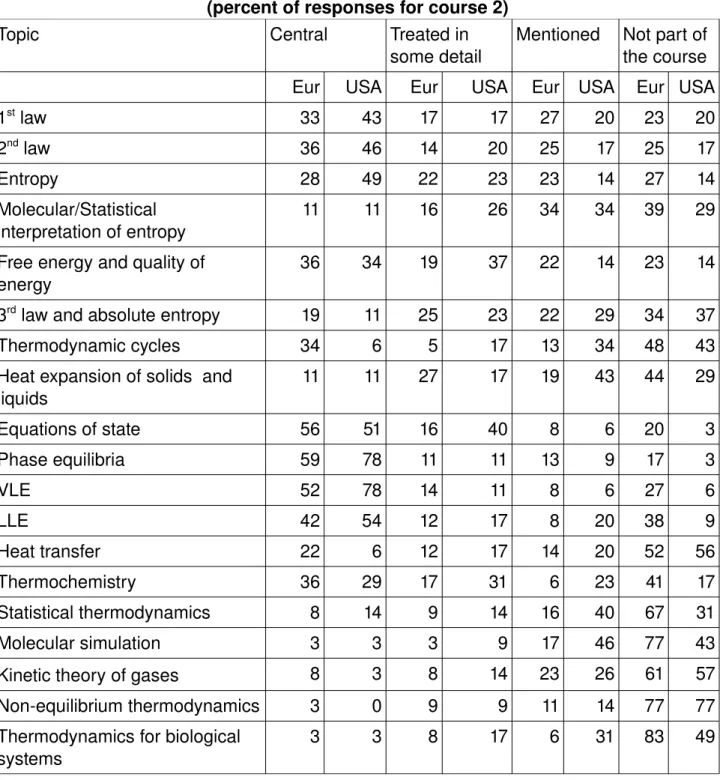
Table 5. Contents of thermodynamics course 2 (percent of responses for course 2)
Topic Central Treated in
some detail Mentioned Not part of the course Eur USA Eur USA Eur USA Eur USA
1st law 33 43 17 17 27 20 23 20 2nd law 36 46 14 20 25 17 25 17 Entropy 28 49 22 23 23 14 27 14 Molecular/Statistical interpretation of entropy 11 11 16 26 34 34 39 29 Free energy and quality of energy 36 34 19 37 22 14 23 14 3rd law and absolute entropy 19 11 25 23 22 29 34 37 Thermodynamic cycles 34 6 5 17 13 34 48 43 Heat expansion of solids and liquids 11 11 27 17 19 43 44 29 Equations of state 56 51 16 40 8 6 20 3 Phase equilibria 59 78 11 11 13 9 17 3 VLE 52 78 14 11 8 6 27 6 LLE 42 54 12 17 8 20 38 9 Heat transfer 22 6 12 17 14 20 52 56 Thermochemistry 36 29 17 31 6 23 41 17 Statistical thermodynamics 8 14 9 14 16 40 67 31 Molecular simulation 3 3 3 9 17 46 77 43 Kinetic theory of gases 8 3 8 14 23 26 61 57 Nonequilibrium thermodynamics 3 0 9 9 11 14 77 77 Thermodynamics for biological systems 3 3 8 17 6 31 83 49 In the first course, the first and second laws of thermodynamics as well as entropy are central in both regions (but 7% in the USA do not mention entropy!). Normally the statistical interpretation of entropy is mentioned as well as the third law and absolute entropy but not in significant depth. The second course is frequently more concentrated on phase equilibria. Both of these courses mainly consist of classical thermodynamics whereas the molecular interpretation often is touched upon. Statistical thermodynamics and molecular simulation as well as thermodynamics for biological systems are not central in any of the two courses neither in USA nor in Europe, but they are more frequently mentioned in the USA. Nonequilibrium themodynamics is equaly not part in any of the two first courses in any of the regions. These results are also reflected in the choice of course books, cf Table 6.
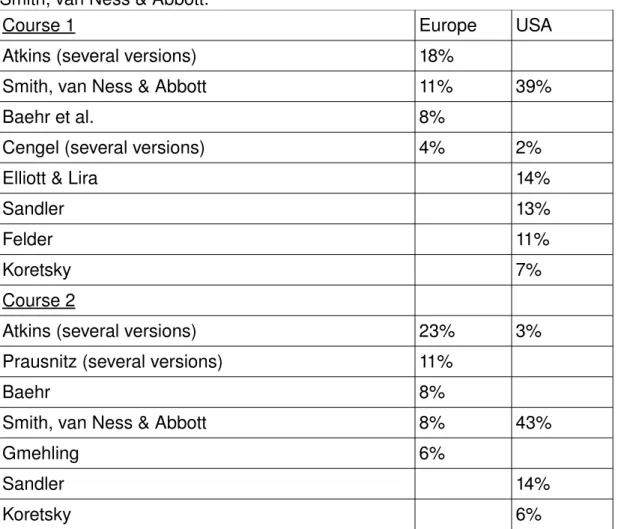
Table 6. The most popular textbooks for course 1 and 2
Books by the same (team of) authors have not been separated since the exact version often is unclear from the answers. There is a obvious difference in the choice of course books between the two continents even though a few books are popular in general, e.g., Smith, van Ness & Abbott.
Course 1 Europe USA
Atkins (several versions) 18% Smith, van Ness & Abbott 11% 39% Baehr et al. 8% Cengel (several versions) 4% 2% Elliott & Lira 14% Sandler 13% Felder 11% Koretsky 7% Course 2 Atkins (several versions) 23% 3% Prausnitz (several versions) 11% Baehr 8% Smith, van Ness & Abbott 8% 43% Gmehling 6% Sandler 14% Koretsky 6% Table 7. Time (in hours/course)used for different forms of teaching in course 1 in Europe [percent of answers; “(outside)” means “expected student work outside class”, PBL = Problem Based Learning, cf. [1].] Type 0 h 120 h 2140 h 4160 h >60 h Lectures (in class) 16 48 25 11 Lectures (outside) 16 39 28 11 5 Exercise classes 8 44 40 6 2 Exercise class (outside) 20 36 32 9 1 PBL etc. (in class) 70 25 5 PBL etc. (outside) 66 29 4 1 Home assign (in class) 41 44 8 6 1 Home assign (outside) 34 35 16 1 3 Laboratory classes 66 25 4 3 2 Lab classes (outside) 78 18 3 1 1
Table 8. Time used for different forms of teaching in course 1 in the USA (in hours/course), [Percent of answers, cf Table 7] Type 0 h 120 h 2140 h 4160 h >60 h Lectures (in class) 11 54 30 6 Lectures (outside) 43 33 11 7 6 Exercise classes 11 59 22 7 Exercise class (outside) 48 35 13 2 2 PBL etc (in class) 26 56 13 4 2 PBL etc (outside) 44 32 15 7 2 Home assign (in class) 20 37 28 9 6 Home assign (outside) 11 28 20 20 20 Laboratory classes 83 15 2 Lab classes (outside) 83 13 4 Table 9. Time used for different forms of teaching in course 2 in Europe (in hours/course) [Percent of answers, cf Table 7] Type 0 h 120 h 2140 h 4160 h >60 h Lectures (in class) 3 19 46 22 10 Lectures (outside) 18 35 25 3 5 Exercise classes 10 38 38 10 5 Exercise class (outside) 24 32 27 13 5 PBL etc (in class) 67 27 5 2 PBL etc (outside) 73 22 5 Home assign (in class) 48 40 8 3 2 Home assign (outside) 38 32 18 2 11 Laboratory classes 73 16 6 2 5 Lab classes (outside) 81 16 3
Table 10. Time used for different forms of teaching in course 2 in the USA (in hours/course) [Percent of answers, cf Table 7] Type 0 h 120 h 2140 h 4160 h >60 h Lectures (in class) 16 48 25 11 Lectures (outside) 16 39 28 11 5 Exercise classes 8 44 40 6 2 Exercise class (outside) 20 36 32 9 1 PBL etc. (in class) 70 25 5 PBL etc. (outside) 66 29 4 1 Home assign (in class) 41 44 8 6 1 Home assign (outside) 34 35 16 1 3 Laboratory classes 66 25 4 3 2 Lab classes (outside) 78 18 3 1 1 Normally courses are centered around lectures and exercise classes with little or no laboratory work whereas home assignments are given in the vast majority of the courses. It can be noted that a rather large amount of time is used in class for home assignments and that problem based learning is twice as popular in course in the USA as in Europe. Conclusions In general, the fact that classical thermodynamics has not changed profoundly during the past decades is reflected in the invariability of the thermodynamics courses. The most popular textbook had its first edition 60 years ago and most other textbooks follow the same outline. More modern atomistic viewpoints are normally found in the (elective) later courses where they often are combined with statistical thermodynamics. This result may reflect how thermodynamics is needed and used in industry and an investigation of the use of thermodynamics within industry is also ongoing within the Working Party. The results of that will be reported in the near future as well as a more detailed analysis of the education. Since the response frequency is not extremely high, caution is needed when drawing conclusions from the material but we assume that some results are clear. Even though the results are quite similar for the USA and Europe a notable difference is the higher amount of problem based learning as well as the larger work with home assignments in the USA. Also there seems to be some more emphasis on atomistic understanding in American teaching. Acknowledgements Support by Peter Sigrén at CLU University of Borås, with the SPSS interview system “MrInterview” is gratefully acknowledged. References [1] P.Ramsden, Learning to teach in higher education, 2nd ed. London : Routledge, 2003. [2] S.K.Dube, D.P. Visco, Chem. Eng. Ed., 2005, 258263.
![Table 8. Time used for different forms of teaching in course 1 in the USA (in hours/course), [Percent of answers, cf Table 7] Type 0 h 120 h 2140 h 4160 h >60 h Lectures (in class) 11 54 30 6 Lectures (outside) 43 33 11 7 6 Exercise classes 11 59](https://thumb-eu.123doks.com/thumbv2/5dokorg/5419567.139421/7.892.88.811.112.466/different-teaching-percent-answers-lectures-lectures-outside-exercise.webp)
![Table 10. Time used for different forms of teaching in course 2 in the USA (in hours/course) [Percent of answers, cf Table 7] Type 0 h 120 h 2140 h 4160 h >60 h Lectures (in class) 16 48 25 11 Lectures (outside) 16 39 28 11 5 Exercise classes 8 44](https://thumb-eu.123doks.com/thumbv2/5dokorg/5419567.139421/8.892.86.808.119.470/different-teaching-percent-answers-lectures-lectures-outside-exercise.webp)
