http://www.diva-portal.org
This is the published version of a paper published in Investigaciones Europeas de Direccion y Economia
de la Empresa.
Citation for the original published paper (version of record):
Karlsson, C., Klaesson, J. (2000)
Success in manufacturing employment in an industrial district: Higher productivity or lower
wages?.
Investigaciones Europeas de Direccion y Economia de la Empresa, 6(2): 65-90
Access to the published version may require subscription.
N.B. When citing this work, cite the original published paper.
Open Access journal: http://www.aedem-virtual.com/archivos/iedee/indiceiedee.htm
Permanent link to this version:
Investigaciones Europeas de DirecciónyEconomía delaEmpresa Vol.6,N"2,2000, pp. 65-90
SUCCESS IN
MANUFACTURING EMPLOYMENT
IN AN INDUSTRIAL DISTRICT: HIGHER PRODUCTIVITY
ORLOWER WAGES?
Karl
s
son
,
C
Klaesson,
J
Jonkoping Intemational Business School Jonkoping University
ABSTRACT
This paper analyses theperformance ofmanufacturing industries in theleading industrial district in Sweden, known asthe Gnosjo region during the period 1980to 1993. In particular, it fo -cuses on a setof 22 industries at the finest level ofindustrial c1assification thataccounts for than75
percent ofmanufacturing employment inthe Gnosjo region. These 22 industries thatduring thea c-tual period isdeclining in the rest ofSweden grow substantially inrelative terms and insome cases also in absolute terms in the Gnosjo region measured in terms of employment. A life cycle ap-proach isused to explain thepossible driving forces behind the actual spatio-temporal pattems. In particular therole of productivity, labour costs and profitability ishigh-lighted. It tums out that in particular ahigher profitability than for the average regions seems to be important for explaining
thecomparatively good performance of the22industries in the Gnosjo region.
KEYWORDS: Industrial District; Manufacturing; Spatial Restructuring; Sween; Productivity
wa-ges.
INTRODUCTION
The south-westem part ofthe county of Jonkoping in Sweden - the GGVV-region - has an industrial structure that is very different from that in the rest of Sweden. The region, which may be characterised as an "industrial district", is dominated by small and medium-sized en-terprises. It iswell-known for its entrepreneurial spirit and inthe literature this phenomena has been labelled "the Gnosjo phenomenon". In the intemational literature the region has been compared with other entrepreneurial regions, such as "the third Italy", Rhóne-Alps, Ba den-Württemberg, and Silicon Valley (Karlsson &Larsson, 1993; Karlsson & Wiklund, 1994). The employment share for manufacturing industry in this region is approximately double that of the rest of Sweden. This pattem seems tobe very stable over time. An intriguing characteristie of
this region is that many industries which are dec1ining in other parts of Sweden actually are
expanding in this region not only inrelative terms but also inseveral cases in absolute terms. In present day Sweden there is,historically speaking, a very high unemployment level and politicians at alllevels and inall parts of Sweden have seen the GGVV-region as amodel for solving current unemployment problems by means of increased employment in small and medium-sized firms. This is somewhat surprising since the manufacturing that takes place
there isrelatively low-tech and with alow representation ofthose sectors of industry that are
knowledge and R&D intensive and, henee, eornmonly seen as the sectors of the future in the
age of informatíon
technology
and the emerging "knowledge society".There have been several attempts made to try to explain the Gnosjo phenomenon but most of these attempts have looked more at the social behaviour of entrepreneurs than at the
Karlsson, C; Klaesson, J.
hard economic facts. If one region isdoing significantly better than almost alIother regions it
seems natural to start investigating the phenomenon in terms of significant differences compa -red to other regions in terms of productivity and productivity growth, costs and cost increases, and profits and profit increases. Having established this kind of fundamental differences it is
then possible to start investigating what might be the underIying causes to these differences.
First when the underlying causes have been sorted out is it possible to discuss whether the
GGVV-region can function as arole model for other regions or not.
Purpose
The purpose of this paper is to try to explain why the manufacturing industry in the
GGVV-region incomparative terms is so successful in preserving andinseveral industries also
to increase employment. In the paper we test anumber of different hypotheses. In particular,
we investigate whether the apparent success is the result of higher productivity growth, if it is
the result of low input costs, mainly low wages, and/or if it the result of higher profitability.
Differences in productivity growth, in input costs or in profitability might in an industrial dis -trict bethe result of the existence ofparticular types of agglomeration economies. However, in the paper we do not investigate the role of such economies.
Spatial processes of industrialisation and deindustrialisation
To understand those spatial processes of industrialisation and deindustrialisation that make regions experience growth as well asdecline of various industries it isnecessary to use a
dynamic frarnework. Life cycle theories offer one useful starting point for examining such spatial processes. Assuming the existence of some evolutionary processes which govems sp
a-tial industrial dynamics, it is possible to analyse the spatial implications of each stage of the life cycle (Forslund-Johansson, 1997).
Life cycle theories form a rather heterogeneous set of theories but share some funda -mental characteristics. Some ofthese theories apply tonarrowly defined markets for individual products, while others are aiming at describing the evolution of entire industries, where an
industry usualIy is defined by a set of technologically related products (Utterback &Suarez, 1993; K1epper & Graddy, 1990; Karlsson, 1988). Spatial applications of life cycle theories
normally refer tothe second variant (Norton, 1986).
Life cycle theories can be used to analyse a variety of phenomena within the field of
spatial industrial dynamics. Here we are in particular interested to see how these theories can explain the relative and in some cases even absolute growth ofnationally declining industries
in specific regions. Why do the growth ofindustries vary so much over various regions? How come that some regions experience relative as well as absolute deindustrialisation at the same
time as other regions experience relative as well as in some cases absolute industrialisation? What make the location pattems of manufacturing industries change over time?
The life cycle theories give some hints conceming the answers to these questions. We will here discuss three phenomena identified by these theories that may stimulate changes in location pattems. The first phenomena is standardisation that is supposed to occur in the
growth and mature stages of the product life cycle. Standardisation here stands for the eme
r-gence of adominant design for the products that define the industry. The loss of product v
Sucess in Manufucturing Employment inan Industrial District ...
ety leads to increased price competition and forces producers toput greater emphasis on cost
reductions. In parallell to the standardisation of products astandardisation and routinisation of production processes is very likely totake place. The more standardised the products and the
processes, the less need for company headquarters to monitor the production process closely and the less need for highly specialised and qualified employees and technical and consulting
services. As standardisation occurs industries become ina sense foot-Ioose, i.e. their production no longer needs to be located close to company head-quarters and R&D facilities. At the same time these industries become more sensitive in their choice of location, since they tosurvive in
competition have to find those locations that offer the lowest total costs. The relevant cost ele
-ments here consist notonly ofthe cost forland, facilities, labour, and running inputs butalso the general transaction costs for supplying the customers theproducts they demandoThismeans that
standardisation will favour low costregions. Alow cost regions isnotonly characterised bylow costs of various inputsbut also ofvarious location econornies that can contribute to favourable cost conditions as well as generally favourable industrial rnilieu with apool of trained labour, well-functioning information networks, and so on.
The second phenomena to be discussed here is labour-saving innovations. As the life
cycle runs towards its later stages process innovations tend to out-weight product innovations. The possibility to introduce labour saving innovations is generally speaking stimulated bythe standardisation process and by the general need to cut costs. Labour-saving innovations in mature or declining markets must bydefinition give rise tojob losses due toincreased labour
productivity. A fundamental question is,of course, where the investments introducing the new labour-saving innovations will bemade. Often new investments in new equipment needs new
plants. This gives the firms an opportunity to choose to invest in the above mentioned low cost regions to, so to say, reap double benefits. Regions that are rapid to introduce new labour -saving innovations and/or toattract such investments from other regions may very well outpe
r-form producers inother regions in terms of productivity and, hence, induce deindustrialisation in these other regions.
A third phenomena to be considered is demand stagnation or contraction: When this phenomena occurs, a selection process is induced. When demand stagnates or even contracts,
price competition becomes tighter and the failure rate of inparticular small and medium sized
firms increase. Large firms areles slikely to fail abruptly andreact instead by down-sizing their
operations. In these phases of the life cycle mergers and acquisitions become more frequent.
Hence, in later phases of the life cycle we shall expect heavy restructuring and relocation of industries. Which regions that will be losers in this process depends to a high degree upon where tbe older plants using older technologies, i.e. the plants that normally have tbe highest
variable unit costs, and hence, the lowest gross profit shares, are located. As new industries
normally are born and developed in larger urban regions, older plants often tend to be located inlarger urban region and thus one should expect that contracting industries have atendency first to abandon the larger urban regions.
Summarising this short discussion on spatial processes of industrialisation anddeindustriali -sation it seems obvious thatregions that are gaining relatively and insome cases even absolutely in employment terms when industries decline nationally should be expected to be characterised by i)
lower costs,inparticular, lower labour costs, ii)higher productivity, and, inparticular, higher pro -ductivity growth, andlor
iii
)
higher gross profit sharesin the actualindustries.Karlsson, C; Klaesson, J.
The Data
The data used in the present paper is data for the manufacturing industry in Sweden for the years 1980 and 1993 collected by Statistics Sweden. The reason data from 1993 is used rather than data from a more recent year is that there was a major change in the Swedish Stan-dard Industrial Classification in 1993 making comparisons before andafter the change virtually impossible. The data contains information on industry, number of employees, work hours, wages, sales value, value added and amount of energy used. The data iscollected at plant level rather than at firm level, this means that a firm with two plants will appear in the data twice. The reason is that technology tend to be plant specific and not firm specific.
In
the empirical work all data are aggregated into geographical areas. The areas used are the Swedish "A-regions", which can be interpreted as labour market regions approximately equal to commuting regions. In Sweden there are 70 such regions. Unfortunately, the munici-palities of Gnosjo, Gislaved, Vaggeryd and Varnamo that form what we in this paper call the GGVV-region do not belong to the same A-region. Gnosjo, Gislaved and Varnamo constitutes an A-region while Vaggeryd belongs to another A-regíon. For the purpose of this paper Vag -geryd is aggregated with theother three municipalities and exc1uded from itsoriginal A-region. The major reason for aggregating these four municipalities toone region is that that share the same industrial structure and entrepreneurial behaviour and, hence, constitute anatural spatial delirnitation of the industrial district often referred to asthe Gnosjo region.The data arebased onsix-digit manufacturing industries, according to StatisticsSweden's official industrial c1assification - the SNI codeo At the six-digit level the manufacturing industry isdivided into 196separate industries based on theplants' major output. This isthe finest level available for which data isregistered. To lirnit thenumber of industries covered in theempirical analysis, those industries that accounted for at least one per cent of manufacturing employment in the GGVV-region in both 1980 and 1993 were selected. 22 industries at the six-digit level ful-filled these criteria. The industrial c1assification six-digit SNI codes for the 22industries studied in this paper and information about what they produce are found in appendix A.
STRUCTURE AND DEVELOPMENT DURING THE EIGHTIES AND EARLY
NINETIES
This chapter is devoted to a description of the 22 industries covered in this study in terms of employment, value added, specialisation quotients, and soon, in 1980 in the GGVV -region and in the rest of the country and in terms of changes of the same variables during the period 1980-1993.
S
tructure and De
v
elopment in Term
s
of Emplo
y
ment,
V
alue
A
dded and Number of
Plants
The 22 selected industries employed in 1980 12,913 persons in the GGVV-region, which was equal to76.3 per cent of all manufacturing employment in the region (See Appen -dix B and C). The number employed in the selected industries had fallen to 11,023 in 1993 equal to a drop by almost
15
per cent. However, in1
993
the selected industries accounted for 83.5 per cent of all manufacturing employment in the GGVV-region. This may, atfirst sight, not appear as a success story. But, looking at the same industries at thenationallevel their drop in employment was almost 35 per cent. Thus, the GGVV -region did very well during theSucess in Manufacturing Employment in anIndustrial District ...
riod 1980-1993 in these 22 industries which were declining or even more or les sdisappearing
elsewhere in the country.
The two most striking examples of successful industries in the GGVV-region are the
manufacture of plastic material s (SNI 351320) and themanufacture ofindustrial machinery not
elsewhere classified (SNI 382490) (See Figure 1).These two industries approximately doubled their employment in the GGVV-region in absolute terms between 1980 and 1993, while they
declined in the rest of Sweden, in the second case by asmuch as 42 per cent.
If one looks at the development in terms of value added the picture gets even clearer
(See Figure 2). In the GGVV-region the 22 industries actually increased their value added by 32.5 per cent (infixed prices). In therest of the country the value added for the same industries
declined by l.6per cent (infixed prices).
The three most successful industries invalue added terms were, once again, the manu -facture of industrial machinery not elsewhere classified, the manufacture of lifting devices (SNI 382991) and the manufacture of motor vehicle engines, parts and trailers (SNI 384320).
AlI these industries increased their value added (in fixed prices) by approximately one and a
half times. In the rest of Sweden the value added (infixed terms) increased by 4.5 percent in industry SNI 382490, declined by 4.4 percent in industry SNI 382991 and increased by32.3
percent in industry SNI 384320.
The total number of plants in these 22 industries was 277 in 1980. In 1993 the number
of plants in the same industries was 239, which means that the number ofplants dropped by almost 14per cent between 1980 and 1993. This can be compared with the rest of the country where the number of plants decreased by 26 per cent during the same periodoOnce again we see that this group of industries in the GGVV-region was doing much better than the same industries in the rest ofSweden during the actual periodo
FIGURE l.PERCENTAGE CHANGE INEMPLOYMENT IN THE SELECTED 221 DUSTRIES BETWEEN 1980AND
1993INTHE GGVV-REGlON AND INTHE REST OFSWEDEN (RSW).
Karlsson,
e
;
Klaesson, J.FIGURE2.PERCENTAGECHANGE INVALUEADDED INTHESELECTED22INDUSTRlES BETWEEN1980 ANO
1993 (INFIXED PRlCES) INTHEGGVV-REGION ANO INTHERESTOF SWEDEN(RSW). 200.0 I'IIIOVA%GGVV OOVA%RSW c; o o or O> O>
'"
"
crcc"
cc'"
co co co'"
o o'"
O> O> ;;; io'
"
cc co'"
The GGVV-region is known asthe Swedish small business district. The size structure of
plants in a region is, of course, to a high extent a reflection of the industrial structure of the
region. But even for the 22 industries that characterises the GGVV-region we find that the
average plant size is smaller than in the rest of Sweden (Appendix B and C). In 1980 the av
er-age plant size in the actual set of industries in the GGVV-region was 46.6 employees. A
num-ber that in 1993 had decreased to 46.1 employees. For the rest of Sweden the same numbers
was 56.5 employees in 1980 and 50.4 employees in 1993. This means that the average plant in
1980 was about 21 per cent larger in the rest of Sweden than in the GGVV-region. In 1993the
difference had declined to about 9 per cent. The lower average size of the plants in the
GGVV-region seems to rule our internal economies of scale as a major general explanation of the
bet-ter performance of the actual industries in the GGVV-region.
Specialisation Quotients
In this paper a simple specialisation quotient is used to establish therelative importance of the 22 industries for the GGVV-region. The specialisation quotient is defined as:
·
1
00
(1)where
X
;'
=
employment inregionr
inindustry i,Xr
=
total employment inregion r,Xi
= employrnent inindustry iin the rest ofSwedenand
X
= total employment in the rest of SwedenSucess inManufacturing Employment inanIndustrial District ...
If
SQ
rol.
> 100, theindustry has ahigher representation inregion rthan in the national economy. IfSQ
r.i < 100, the industry is less represented in region r than in the nation as a whole. In the formula above employment can be substituted by value added or income data without any changes in the interpretation. By calculating specialisation quotients for the 22 manufacturing industries from the 1980 and the 1993 data the relative specialisation can be determined.Now, in interpreting what might have happened during the period one has to remember that the specialisation quotient is a relative measure. The specialisation in the region ismea su-red in relation tothe national composition ofindustries. This means that there are two ways by which a particular quotient can decrease. Either the share of employment in the region has fallen or the share in the country as a whole have risen. In both these cases the specialisation quotient for the region has fallen.
The specialisation quotients interms of employment for theGGVV -region can befound in Appendix B. The table in the appendix shows that the specialisation quotient for the actual industries in most cases is very high. Italso shows that for all but five industries the specialisa -tion quotient increased between 1980 and 1993.
Specialisation quotients for the GGVV -region computed interms of value added can be found inAppendix C. In 1980all industries except three had aspecialisation index higher than 100. In 1993 all 22 industries had a location quotient for the GGVV-region that was higher than 100andin many cases substantially higher. And between 1980 and 1993 all except four of the 22 industries increased their specialisation in terms of value added in the GGVV-region.
Taken together thecalculations show that for the actual industries the GGVV -region is a very important location and a location whose importance in most cases increased during the period 1980-1993.
The Specialisation Quotients Ratio - a Measure of Succe
s
s
?If the ratio between two specialisation quotients from different years is calculated, the relative success or failure of aparticular industry inaregion can be determined. This means that according to this definition is the relative success or failure of an industry in aregion is dependent on the relative development for the same industry in the rest ofthe country.
The specialisation quotients ratio,
R
r.io93080' between 1980 and 1993 for regionr
andindustry i, can be defined as:
R
-
SQ93r,i,93,80 -
SQ
80
If R < 1 there has been adecrease in the specialisation of the industry in question in the actual region. If R > 1there has been an increase in the specialisation of the industry in the actual region.
Karlsson,
c.
;
Klaesson, J.In Table 1 and Table 2 the relative specialisation in 1980 and the rate of growth ofspe
-cialisation between 1980 and 1993 have been divided into classes in order to establish the pat-tem ofdevelopment. The rules bywhich this c1assification has been done is the following. First it was decided if the specialisation was high (H), medium (M) orlow (L)in 1980. The decision rule was:
If ,
SQ
so
~ 1000
,
the industry specialisation was considered to be high.If,
1000
>SQ
so
~ 500
,
the industry specialisation was considered to be medium.If,
SQ
so
<
500
,
the industry specialisation was considered to be low.Then it was decided if the growth in specialisation between 1980 and 1993 had be en fast (++), medium (+ ) or negative (-).The decision rule was:
If,
R
,
i 93SO~ 2, the growth was considered to be fast.If,2>
R
r,i,93,SO ~1,
the growth rate was considered to be medium.If,
R
r,i,93,SO<
1,
the growth rate was negative.This c1assification were done by quotients and ratios calculated from both employrnent figures and value added figures'.
The pattems in Table 1 is not so c1earcut. Table 2 on the other hand shows some inter
-esting results, No industry with a high value added specialisation in the GGVV-region had a decline in specialisation between 1980 and 1993. Of these industries that had amedium spe -cialisation in 1980 the majority showed aclear but modest growth invalue added specialisation during the same periodo For those industries that had a low specialisation in 1980 the most typical pattem was a rapid increase in value added unti11993.
TABLE1.EMPLOYMENTSPECIALISAnON INTHEGGVV -REGlONIN1980ANDGROWTH INSPECILAISAnON 1980-1993 (SNI CODES).
1
1980 GROWTHRATE + + + i I - I I 323300 355110 356010~=
2
i
;1
381930 355900 356090 :L:;¡;;. i" 332010 382590 372040 341210 332020 381200 381920 381990 351320 381300 384320 331111 T. j 382490 381940 383990 382991Sucess in Manufacturing Employment in anIndustrial District...
TABLE2.VALUE AnDED SPECIALISA TlON IN THEGGVV -REGIONIN1980AND THEGROWTHIN SPECIALISATlON 1980-1993(SNI CODES).
Growth Rate 1980 + + + - I 323300 355900 H 355110 381930 341210 372040 356010 M 382590 351320 381200 356090 381990 332010 382490 381300 331111 L 332020 382991 381940 381920 384320 383990 METHODS OF ANALYSIS
In this chapter afurther step is taken to analyse how the development of the actual
in-dustries in the GGVV-region compares with the development of the same industries in other
regions in Sweden. Here we apply ideas from the literature on spatial industrial dynamics, in
particular the filtering-down theory and the spatial product life cycle theory, that both as sumes
that industries develop along various spatio-temporal pattems (Karlsson, 1998). Acornrnon
feature ofthese theories is that industries initially develop in thelarger urban regions and then
over time either hierarchically or according tosome other pattem move tomore and more
pe-ripheral regions. Combining these theories with a vintage model approach, that stresses that
each vintage ofplants keep itsproductive characteristics for extended time periods, itshould as
a theoretical simplification be possible toas sume that the plants ineach individual region can
be aggregated to some average plant, whose characteristics mirror when theparticular industry
was established in the actual region.
Aggregating all plants ina given industry to one "average" plant itisthen possible for a
given year torank all regions, where the actual industry isrepresented according to their
pro-ductivity, their gross profit shares, and so on. This should give a good picture how individual
regions do compared with other regions. Furthermore, this approach makes itpossible to study
howtheposition ofindividual regions may change over time fordifferent industries. If a region
moves up in the distribution of regions that is an indication of investment processes, either
adding new capacity to a region or upgrading oldindustrial capacity. If a region moves
down-wards in the distribution that is an indication of insufficient investments in new capacity or
improvements of oldcapacity.
Once the industrial sectors of interest have been established it is time to explain why
these sectors did so well. This will be done inthe framework of a vintage type of production
theory using Salter distributions ofproductivity and gross profit shares (cf. Salter, 1960). These
distributions we estimate using data onvalue added and wages.
The theoretical framework forthe vintage model can be summarised asfollows. A
pro-duction unit (plant) is characterised by its durable resources including the technique of
opera-tion (production, distribution etc.). The operation technique can only be changed through
in-vestments. This means that labour productivity, at fixed prices, is unchanged if new invest
-ments are notmade.
Karlsson,C;Klaesson, J.
On an aggregate level three processes are atwork: technical improvements inexisting
plants, investments in new plants and scrapping of old plants. It is possible to describe the economic age of a plant with anage index. Such anindex can be constructed using the plant's gross profit share, which isthe quotient between gross profit and value added. When technique
improvements are made ataplant the age index is changed by an increasing gross profit share as a result. When the gross profit share diminishes itis a sign of econornic ageing.
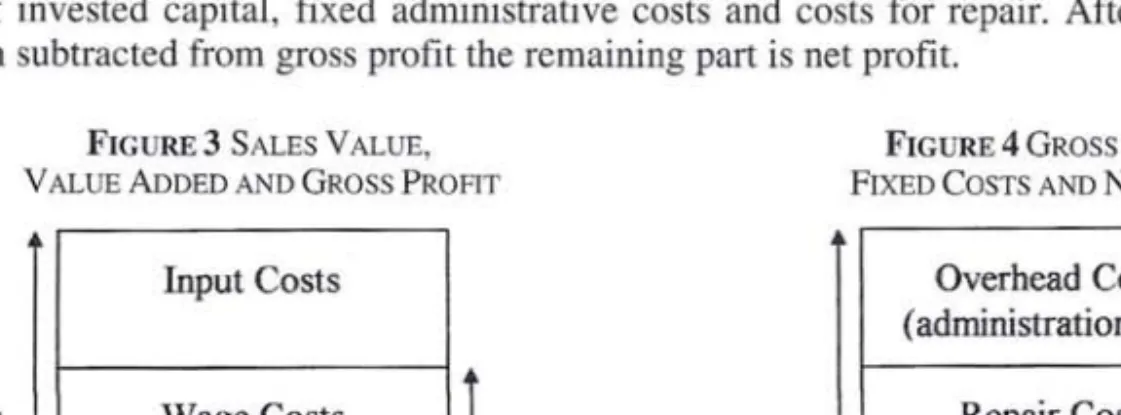
The connections between sales value, value added and gross profit isdepicted in Figure 3. Value added is a statistical measure of the production at aplant and is ca1culated as sales
value less input costs. Gross profit isthe difference between value added and wage costs. The
gross profit should cover various fixed costs, as shown in Figure 4. These costs inc1ude depr e-ciation of invested capital, fixed administrative costs and costs for repair. After these costs
have been subtracted from gross profit the remaining part is net profit. FIGURE 3SALESVALUE,
VALUE ADDEDANDGROSS PROFlT
FIGURE 4GROSS PROFIT, FIXED COSTSAND NETPROFlT Input Costs Sales Value Net Profit Gross Profit Value Added Gross Profit Overhead Costs (administration etc.) Wage Costs Repair Costs
Depreciation Costs
Assume that wehave a plant producing and selling thequantity x of aproduct at price p. The sales value, Q, isdefined as:
Q=p
x
(2)The plant have used the quantities VI, Vm of inputs to produce x. Let
p
¡
be theprice ofinput i. The value added, F,can then be defined as:
F
=
p
x-
V
(3)
Assume that the workforce needed toproduce x is S>
O.
Let wbe the wage rateo The gross profit, B, can then be defined as:74 Investigaciones Europeas,Vol.6,N° 2,2000,pp. 65-90
-Sucess inManufacturing Employment in anIndustrial District...
B=
F
-
W
(4)
W
=
w
S
If gross profit is related to value added we get the gross profit share, b ,which isdefined
as:
(5)
Gross profit share can alsoberelated tothe productivity ofthe workforce, úJ, defined as:
01=
%
(
6
)
and since
*
=
1-
o/
p
,
we can write:b=
l
-
%
(7)This implies that the productivity ofthe workforce must be larger than the wage rate in
order to give apositive gross profit share.
These productivity and gross profit share measures caJculated for individual plants can
bepresented in a cumulative distribution over total employment or total value added (See Fi
-gure 5). These distributions then can beused toanalyse differences between regions or differ
-ences in time. Also the shape of the distribution can shed light on what type of structural
changes are going on or if the industry or parts of the industry is sensitive to changes in input
prices (e.g. wage rates).
FIGURE 5.INTERPRETATION OF APRODUCITVITY SALTER DISTRlBUTION.
Productivity
Negative gross profit
f---t---;r--- Wage rate
Employrnent
Karlsson,C:Klaesson, J.
EMPIRICAL EVIDENCE
In this chapter we present the results of our empirical investigations. Here weapply the productivity distributions for various industries over regions toanalyse how the GGVV-region isdoing incomparison with other regions in Sweden. We complement the productivity dis tri-butions with tables giving information about thesituation for the GGVV-region compared with the average region and the best region in 1980 and 1993 in terms of productivity, labour costs and gross profit shares. Furthermore, the tables contain information about how the changes in the same variables in the GGVV-region compared with the average region and the best region in Sweden.
In this section the productivity distributions for various industries over regions are in-vestigated. In particular, we study how the GGVV -region is doing in comparison with those other regions where the actual industries are represented. The productivity distributions are found in Figure
6
and in AppendixD.
A look through the diagrams shows that the GGVV-region improves its relative position significantly in about half of the 22 industries, while in about six cases its relative position significantly deteriorates between 1980 and 1993. In the rest of the cases the relative position of the GGVV-region only changes slightly.The exarnination ofthe productivity distributions and thecomparisons ofthe productivi
-ty distributions for 1980 and 1993 give important indications conceming the investment pat-tems for the various industries in the GGVV-region. To get a deeper understanding of the un-derlying causes of the comparatively speaking strong performance of the 22 industries in the GGVV-region we now continue by comparing the performance of the actual industries in the GGVV-region with the performance of the samc industries in the average region and in the best region. This information is gathered inTable 3,4 and 5.
Starting with the productivity data in Table 3 we see that in1980 14 ofthe 22industries
in the GGVV -region outperformed the average region in terms ofproductivity even if the dif-ference in three cases was slight. In 1993 this figure has increased to 16industries. This is a
c1ear hint of why theGGVV-region is able toimprove itsrelative position. However, compared with the best region there is still a long way to go. In 1980 only six industries exhibited an average productivity that was 75 per cent or better ofthat in the best region. In 1993that figure had dec1ined to five industries, but ofthem one had atop position.
FIGURE 6.REGIONAL PROOUCTIVITY ANO WAGE DISTRIBUTTONS INSELECTEO INDUSTRlES 1980 AND 1993.
Industry 323300 (1980) Industry 323300 (1993) IOOlJY=='
¡
~
OGlVV '-". L....••. _._. ._ --'--i'h I~
~
~
1000 SEK/Emp 400 -l.abow~vity -w•••• L, 3001
oovv2OOV-(+-
-100 o o 250 soo 150 l.al>ouriOnoe ISO 1000 SEKlEmp - Labourproductivity -w•••• ,~~~~~~~~~~~~~~ e ts 76 Investigaciones Europeas, Vol. 6,N° 2,2000, pp. 65-90Sucess inManufacturing Employment in anIndustrial District... Industry332010 (1980) 2001000SEKJEmp - Labour productivity ,.,-w •••• 1 ISO l
1
-
-
-
-
.
....
_
-
--
-
-
-
.
_--'--'>--.•-.~. 100 GGVV-"" SO~ .1. '\ lJ
t
o o 1000 2000 3000 4000 Laboorforce lndustry332020 (1980) 2001000 SEKlEmp•. -Labour productivity
-w",," ISO', .... _ t..,,--
_
..--...•_
•..•. GGVV -·---...~L, 50 o~~~~~~~~~~~~~~~~~~ o 2000 4000 6000 Labourícrce 8000 10000 Industry 381920 (1980) 1000 SEKIEmp -~. Labour productivity 200 -Waaesr
¡
ISO -.-----~ GGVV loo¡.-...rr1
_
-.
_
-
.
..
,
50 oL-~~~~~~~~~~~~~~~~~ o 2000 Labourfo= 3000 1000Investigaciones Europeas, Vol. 6,N°2,2000, pp. 65-90
Industry332010 (1993) sooSEKIEmp - Labourproduc1ivity -w •••• 400 ! ; 300
~
-200 100 o o 1000 2000 3000 4000 Labourforce lndustry 332020 (1993) 150 1000 SEKIEmp -- Labourproductivity -w•••• 1 SOOh !~
L_~ 250GGt
n
-
,
u I o o 2000 4000 6000 8000 10000 Lebccríoree Industry 381920 (1993) 30001000 SEKIEmp - Labourproducbity -w•••• 2SOO 2000 1500 1000-
;;
=~
500 o o 1000 2000 3000 4000 Labccsfoeee 4000 77Karlsson, C; Klaesson, J. /ndustry38/930 (/980) 400 1000SEKJEmp - Labourproductivity -w •••.• 300 200
c
z
=-100 ~---'---. "1 ~ ~ r---J O O 1000 2000 3000 4000 Labcerforee /ndustry382490 (1980) 4001000SEKJEmp -- I..abo\:a"productivi.ty -w•••.• Industry 381930 (1993) 8001000SEKIEmp - Labourproductivity -w •••.• fIX!,
GGW 400~--
(
~-l...-.¡ 200~
O O 1000 2000 3000 4000 Labouríorce 1ndustry382490 (1993) 10001000SEKIEmp ~-~productivity -w •••• 150 I'
---
\. 500 250 O 15000 O OL-~~~~~~~~~~~~~~~~ O 5000 10000 Labourfcrce /ndustry382590 (1980) 2001000SEKJEmp - Labourproductivity -w•••• ISOt
.,
~
i~
-
-
-
~
100ru
'1 50 O O 1000 2000 3000 4000 LabourlO=78
5000 10000 Labourforce 15000 /ndustry382590 (1993) IOOOSEKJEmp - LabouI: pmductivity -w•••• 1000'
-1
~ GGW 500h
-
T
~
'l
O O 1000 2000 3000 4000 Labourfo= InvestigacionesEuropeas,Vol.6,N° 2,2000, pp.65-90Sucess inManufacturing Employment in anIndustrial District ...
Table 3 also contains information ofthe ranking of the (average) productivity ofthe dif
-ferent industries in the GGVV-region compared with that inother regions where the different
industries are represented. For 16 ofthe industries, i.e. for more than 70per cent of the indus -tries, the productivity in the GGVV-region was better than in the median region in both 1980 and 1993. In eight cases (=36 per cent) in 1980 and inse ven cases (= 32per cent) in 1993 the GGVV-region was even inthe best quartile of all regions. Thus it seems asif a majority of the
industries covered by this study have aproductivity advantage when localised in the GGVV-region compared to a localisation to an average Swedish region.
TABLE 3.THEGGVV-REGlONINRELATIONTO THEWHOLE OF SWEDENINTERMSOF PRODUCfIVITY.
Prod 1980 Prod 1993 (%ofm) (%ofb) R (%ofm) (%ofb) R 323300 85,65 60,53 12/16 71,73 60,83 4/4 331111 118,7 72,34 17/67 138,2 67,33 6/66 332010 96,29 61,48 17/26 108,1 84,19 6/19 332020 123,9 77,47 9/48 114,9 63,62 10/34 341210 119,2 84,99 5/16 130,7 83,01 2/18 351320 176,0 89,06 2/32 105,0 56,33 18/35 355110 89,44 80,65 4/4 127,0 100 1/2 355900 93,69 49,41 8/19 119,5 82,36 4/17 356010 96,31 55,05 13/27 126,0 87,70 4/33 356090 98,10 62,70 27/48 84,17 32,72 33/49 372040 127,8 69,14 4/27 105,8 62,42 5/19 381200 128,4 88,08 6/36 89,07 37,54 16/24 381300 118,3 67,78 26/69 125,8 65,43 7/66 381920 127,1 82,55 5/20 86,67 21,33 7/17 381930 135,5 56,94 3/22 112,6 56,17 7/20 381940 110,3 61,36 15/43 93,62 64,01 28/39 381990 100,2 53,98 26/65 107,9 46,78 18/65 382490 122,0 48,00 lO/54 106,8 55,99 23/52 382590 100,5 71,33 6/11 86,84 50,71 7/12 382991 79,40 30,31 35/52 104,7 54,02 19/52 383990 97,40 16,73 13/38 102,7 47,98 17/37 384320 100,9 58,01 27/60 133,7 62,56 6/58 Prod = productivity %ofm = percent of mean %ofb=percent ofbest(highest)
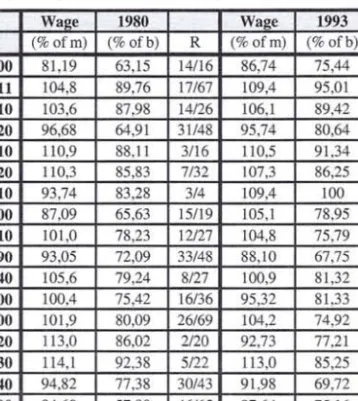
Next tuming to the issue of labour costs we see in Table 4that 50 per cent of theindus -tries ha ve labour costs that are higher than in the average region. Labour cost advantages do
notseem to beaplausible explanation for the re1ative success of the GGVV-region. In only six cases in both 1980 and 1993 was the 1abour costs inthe GGVV-region more than 25per cent lower than those inthe region with the highest labour costs. Looking upon the ranking of the GGVV-regio n in terms oflabour costs with other regions there is no clear cut pattem. Both in 1980 and in 1993 50 percent in the industries has labour costs above the median and 50 per cent below the median. Hence, labour costs does not seem to give any particular advantages or
Karlsson, c.;Klaesson, J.
disadvantages tothe industries in the GGVV-region compared to alocation tomost other re-gions.
TABLE 4. 11mGGVV-REGlONINRELATIONTO THEWHOLE OF SWEDENINTERMS OFLABOUR COSTS.
Wage 1980 Wa2e 1993 (%ofm) (%ofb) R (%ofm) (%ofb) R 323300 81,19 63,15 14/16 86,74 75,44 4/4 331111 104,8 89,76 17/67 109,4 95,01 14/66 332010 103,6 87,98 14/26 106,1 89,42 4/19 332020 96,68 64,91 31/48 95,74 80,64 23/34 341210 110,9 88,11 3/16 110,5 91,34 4/18 351320 110,3 85,83 7/32 107,3 86,25 10/35 355110 93,74 83,28 3/4 109,4 100 1/2 355900 87,09 65,63 15/19 105,1 78,95 6/17 356010 101,0 78,23 12/27 104,8 75,79 11133 356090 93,05 72,09 33/48 88,10 67,75 41/49 372040 105,6 79,24 8/27 100,9 81,32 10/19 381200 100,4 75,42 16/36 95,32 81,33 1724 381300 101,9 80,09 26/69 104,2 74,92 22/66 381920 1l3,0 86,02 2/20 92,73 77,21 14/17 381930 114,1 92,38 5/22 1l3,0 85,25 4/20 381940 94,82 77,38 30/43 91,98 69,72 29/39 381990 94,60 57,80 46/65 97,64 75,16 39/65 382490 104,2 79,34 21/54 93,76 69,96 37/52 382590 94,47 79.06 10/11 92,32 72,84 9/12 382991 98,92 78,22 29/52 91,88 56,54 41/52 383990 89,80 52,17 27/38 107,1 61,84 16/37 384320 95,46 79,95 27/60 97,44 61,39 32/58 %of m=percent ofmean %of b=percent of best (highest)
Lastly, turning tothe issue of gross profit shares in Table 5,we find something interes t-ing. In 1980, allexcept 3industries in the GGVV-region outperformed the average region in terrns of gross profit shares. In nine case with so much as 20 per cent or more. In 1993 only two industries in the GGVV-region had agross profit share that was lower than in the average region. AIso compared to the industries in the best region were the industries inthe GGVV-region doing well. In 16 cases thedifference was les sthan 20per in 1980 andin 1993 the same figure was 15 cases.
If we then look upon the ranking ofthe GGVV-region for the various industries in terms of gross profit shares we find in 1980 19 out of 22industries exhibit gross profit shares above the median. This is equal to more than 85 per cent. In 1993this number had dropped to 18but this means that still more than 80 per cent of the industries was doing better in the GG VV-region than inthe median region. In both years 7industries, i.e. almost 32per cent of the indus -tries belong to the best quartile. And only one industry in both years was to be found in the worst quartile. Hence, the industries inthe GGVV -region has a very strong position interms of profitability.
Sucess in Manufacturing Employment inanIndustrial District ...
These results point in the direction that the secret behind the Gnosjo phenomenon isnei -ther generally higher productivity in other regions, nor lower labour costs. Rather the secret seems to be anability to balance productivity and labour costs ina way that produces a profi t-ability that is clearly higher than in the average region. This higher profitability creates the funds necessary to invest in increased and improved production capacity in abalanced way to keep the region ahead of most ofits competitors. TABLE 5.THEGGVV -REGlONINRELATrON TOTHEWHOLE OF SWEDENIN TERMS OFGROSSPROFITSHARE. GPS 1980 GPS 1993 (%ofm) (%ofb) R (%ofm) (%ofb) R 323300 114,2 73,03 5/16 85,58 75,72 4/4 331111 108,9 88,35 20/67 113,3 88,63 8/66 332010 96,31 71,69 14/26 104,2 85,37 8/19 332020 132,4 89,06 14/48 121,9 85,73 10/34 341210 111,6 86,42 7/16 116,7 88,71 5/18 351320 127,9 98,70 4/32 116,8 76,96 17/35 355110 97,28 82,61 3/4 llO,5 100 1/2 355900 115,0 81,22 8/19 112,0 85,18 5/17 356010 103,6 71,91 12/27 112,9 92,41 7/33 356090 106,8 84,18 18/48 102,5 70,70 23/49 372040 136,8 90,05 7/27 107,4 75,49 4/19 381200 126,7 94,91 6/36 99,63 70,40 13/24 381300 115,3 84,19 14/69 116,2 80,29 10/66 381920 121,6 84,52 8120 108,1 75,41 4/17 381930 122,7 80,68 6/22 103,9 79,38 9/20 381940 121,1 85,18 10/43 105,2 84,97 20/39 381990 108,6 74,77 19/65 110,6 81,08 14/65 382490 121,1 78,97 11154 114,7 84,02 14/52 382590 112,9 84,71 5/11 101,0 86,55 6/12 382991 89,80 54,22 37/52 120,1 85,91 15/52 383990 123,4 66,94 8/38 109,7 74,13 14/37 384320 112,1 75,08 20160 128,7 88,79 6/58 GPS=Gross Profit Share %of m=percent ofmean %of b=percent of best(highest)
SUMMARY AND CONCLUSIONS
This paper deals with the leading industrial district inSweden, theGGVV-region. Inthe
intemational this region is also known asthe Gnosjo region. It has been shown that this region
during the period 1980 to 1993 in those 22 manufacturing industries identified at the finest
level (the six-digit level) that form the manufacturing kemel of the region do considerably better than the rest of Sweden. The basic question asked in this paper is whether this better
performance is the result of higher productivity/productivity growth or lower labour
costs/labour cost increases. The somewhat unexpected answer is that neither of these factors seem to be the major factor. Instead the answer seems to come form the combined effect of productivity and labour costs that gives rise a profitability measured in terms of gross profit
shares in the GGVV-region in almost all the 22 industries in the study that is substantially
Karlsson, c.:Klaesson, J.
higher than in the average region. A profitability that generates the means necessary to invest in new capacity, introduce new production techniques and new and improved products and 10 upgrade existing production capacity 10make the industries in the region forceful competitors
tofirms inthe same industries inother regions inSweden (and abroad). One may observe that it is generally said that the tradition inthe GGVV-region istofinance investments outof int
er-nally generated profits.
NOTES
(1) Seeappendix B and C forthecomplete list ofspecialisation quotients and ratios,
REFERENCES
Forslund-Johansson, V. (1997), Studies o/ Multi-Regional Interdependencies and Change, Stockholm; Division of
Regional Planning, Royallnstitute ofTechnology (Licentiate Thesis)
Karlsson, C.(1988), Innovation Adoption and the Product LifeCycle,Umeá; Department ofEconomics, Umeá Uni
-versity, Urneá Economic Studies No. 185
Karlsson, C.(1998), Spatial Industrial Dynamics in Sweden: A Disaggregated Analysis of Urban Growth Industries,
paper presented at the Southern Regional Association 37'hAnnual Meeting April 2-4, 1998,Savannah, Georgia
Karlsson, C., &Larsson, J.(1993), AMacroview oftheGnosjo Entrepreneurial Spirit, Entrepreneurship andRegional
Development S,117-40
Karlsson, c.,& Wiklund, J. (1994), Flexible Companies inan Industrial District - The Case oftheGnosjo Region in
Sweden, inVecania, J.M. (1994) (ed.), SMEs: Internationalisation, Networks and Strategy, Aldershot; Avebury, 10
3-128
Klepper S.,& Graddy, E.(1990), The Evolution ofNew lndustries and the Detenninants of Market Structure, Rand
Journal o/Economics 21,27-44
Norton, R.D. (1986), Ohio in the Regional Life Cyc1e: ASynthesis; in McKee, D.L., &Bennett, R.E. (1986) (Eds.),
Structural Change in an Urban Industrial Region. TheNortheastern Ohio Case,New York; Preager, 229-239 Salter,W.E.G., (1960), Productivity and Technical Change, Cambridge; Cambridge Univcrsity Press
Utterback, 1.M.,& Suarrez, P.P.(1993), Innovation, Competition andIndustry Structure, Researeh Policy 22,1-21
Sucess inManufacturing Employment inanIndustrial District...
A
PPE
N
DI
X A
:
IND
UST
RI
AL
CL
A
SS
I
FIC
A
TION (SNI CODES
)
Source: Statistics Sweden323300 Manufacture ofproducts of leather andleather substitutes, except footwear and wearing apparel
331111 Sawina and nlaninc of wood oroducts 332010 Manufacture ofunholstered wooden furniture 332020 Manufacture ofnon-upholstered wooden furniture 341210 Manufacture of corrugated board and containers thereof 351320 Manufacture of plastic materials
355110 Tyre and tube manufacturing
355900 Manufacture of rubber products not elsewhere classified
356010 Manufacture ofplastic containers
356090 Manufacture of other plastic products
372040 Non-ferrous metal casting
381200 Manufacture of furniture and fixtures primarily ofmetal 381300 Manufacture of structural metal nroducts
381920 Wire cloth,wire and cable manufacturing 381930 Nail,boltandnut manufacturing
381940 Manufacture ofother metal products for construction purposes
381990 Manufacture ofother metal products
382490 Manufacture ofindustrial machinery not elsewhere classified
382590 Manufacture ofother office and accounting machinery
382991 Manufacture of lifting devices
383990 Manufacture of other electrical equlpment
384320 Manufacture of motor vehicle engines, parts andtrailers
00 -1'>
APPENDIX B: EMPLOYMENT, SHARES, SPECIALISATION QUOTIENTS, NUMBEROFPLANTS IN GGVV
Souree:StatistiesSwedcn,IndustrialStatistics, 1980,1993
SNI69 EMP80GGW EMP93GGW SH8D"/. SH93% DEMP%GGW EMP80RSW EMP93RSW DEMP%RSW SPECQ80 SPECQ93 Q93/Q80 Q93-Q80 NOFIGGW80 NOFIGGW.3 NOFICHGGW NOFICHOGW-Io
323300 467 229 28 17 -510 489 86 -82,4 91919 249184 27 157,3 10 7 -3 -30 O 331111 560 254 33 19 -54,6 21619 13321 -384 2493 1784 0,7 -0,7 19 8 -11 -579 332010 279 214 16 16 -233 4406 1394 -684 6095 14366 24 8,3 6 4 -2 -33,3 332020 629 623 3,7 4,7 -1,0 9922 4234 -57,3 610,2 1377,0 23 7,7 25 15 -10 -40,0 341210 256 227 1,5 17 -11,3 2627 2516 -42 9379 844,3 0,9 -0,9 1 1 O 0,0 351320 266 564 1,6 4,3 112,0 5196 4980 -4,2 4927 1059,8 22 5,7 2 3 1 50,0 355110 1831 641 10,8 4,9 -650 1429 325 -77,3 12332,6 18456,9 1,5 61,2 3 1 -2 -66,7 355900 1531 1291 9,0 9,8 -15,7 4309 2440 -43,4 34198 4951,3 1,4 15,3 6 10 4 667 356010 333 228 2,0 17 -315 3179 2930 -7,8 10082 728,2 0,7 -2,8 7 9 2 28,6 356090 1135 1018 6,7 7,7 -10,3 8029 6103 -24,0 13606 15609 1,1 2,0 32 35 3 94 372040 269 204 1,6 1,5 -242 2779 1526 -45,1 931,7 12510 1,3 32 12 8 -4 -333 381200 312 356 1,8 27 141 3023 2634 -12,9 9934 12648 1,3 2,7 10 13 3 300 381300 524 523 3,1 4,0 -02 21211 11772 -44,5 2378 4158 17 1,8 17 7 -10 -58,8 381920 240 269 1,4 2,0 121 3927 1065 -72,9 5882 23837 40 17,8 10 9 -1 -10,0 381930 396 371 23 28 -6,3 3801 1196 -68,5 10028 2902,9 29 19,0 10 12 2 200 381940 436 329 2,6 25 -245 10685 8029 -24,9 3927 3835 10 -O 1 11 8 -3 -27,3 381990 1927 1895 114 144 -17 19286 13529 -29,9 9617 1310,8 1,4 3,5 61 52 -9 -14,8 382490 204 373 1,2 2,8 828 16097 9328 -42,1 122O 3742 3,1 2,5 10 13 3 30,0 382590 378 304 22 23 -196 4053 941 -76,8 8977 30232 34 21,3 2 2 O 00 382991 176 263 10 20 494 14966 11400 -238 1132 2159 1,9 1,0 4 6 2 50 O 383990 252 165 1,5 12 -345 6871 4664 -321 353 O 3311 09 -0,2 9 2 -7 -77,8 384320 512 682 3,0 '5,2 33,2 28223 24658 -12,6 174,6 258,8 1,5 0,8 10 14 4 40,0 SUM 12913 11023 76,3 83,5 -14,6 196127 129071 -34,2 277 239 -38 -13,7 ... ::l <: n> en O. OQ
~
o
::l'
n> enl
n>~
<
?
-
-9'L;
;
..Nl
:
5
O p~
0'1 Ul'
"
OSNl69=SwedishStandard IndustrialClassifieation
EMP80GGVV =Employment1980 inthe GGVV-region EMP93GGVV=Employment1993 inthe GGVV-rcgion
SH80%=Shareof Total Employment in Manufacturing 1980in theGGVV-region SH93%=Share of TotalEmployment in Manufacturing 1993intheGGVV-rcgion
DEMP%GGVV =Percentage Changein Employment iuthe GGVV-region EMP80RSW=Employment 1980 inthe Rest ofSweden
EMP93RSW=Employment1993 in theRest ofSweden
DEMP%RSW=Percentage Change in Employmentinthe Restof Sweden
SPECQ80=SpeeialisationQnotient for the GGVV-region in 1980(111EmploymentTenns) SPECQ93=Specialisation Qnotientforthe GGVV-regionin 1980(In EmploymentTenns)
Q93/Q80=Ratio of SpecialisationQnotients(InEmploymentTenns) Q93 -Q80=Difference of SpecialisationQnotients (InEmploymentTerms) NOFIGGVV80=Numberof Plants in the GGVV-rcgion in1980
NOFIGGVV93 =Number ofPlants inthe GGVV-regionin1993
NOFICHGGVV =Change in NumberofPlants inthe GGVV-region
NOFlCHGGVV% =Percentage Change in Number ofPlants in the GGVV-region
~
[
.?Jl
2:s'"
"
~
?' <.,..:
'E
.~ c::¡ lrl 00APPENDIX C: VALUE ADDED, SHARES, SPECIALISATION QUOTIENTS, NUMBER OF PLANTS INREST OF SWEDEN
.S!I Source:Statistics Sweden,Industrial Statistics, 1980,1993 ::,
~
..::: <!"
.sj
~
.;¡ O()'
.=e
:: <.; .g,"
::~
.~~
~
"
V}SNI89 VASOGGVV VA93GGVV SH80% SH93% DVA°¡.GGVV VA80RSW VA93RSW OVAOJoRSW SPECQSO SPECQ93 Q93/QSO Q93.Q80 NOFIRSW80 NOFIRswn NOFICHRSW NOFICHRSW%
323300 33484 53349 14 09 -24,1 42431 31980 -64,1 43709 90421 21 46711 20 6 -14 -70,0 331111 123386 184768 52 31 -287 4204445 7326146 -17,0 1625 1367 08 -25,8 568 334 -234 -412 332010 29599 77084 12 13 24,0 506469 465496 -56,2 323,7 8976 28 5739 81 47 -34 -420 332020 84552 259546 3,5 43 462 1207026 1502682 -407 388O 9362 24 5482 264 106 -158 -598 341210 48801 144174 2,0 24 407 420207 1172715 329 643,3 6664 1,0 231 19 25 6 316 351320 82289 291234 35 48 68,5 911404 2838824 483 5001 5561 1,1 56,0 64 75 11 172 355110 263314 391222 111 65 -292 239161 113935 -77,3 60982 186117 31 12513,5 3 2 -1 -333 355900 171820 589612 7,2 98 63,4 567783 1002993 -15,9 1676,1 31863 19 1510,2 36 33 -3 -83 356010 44548 130232 1,9 2,2 39,2 423122 1472765 657 5832 479,3 0,8 -103,9 46 54 8 174 356090 143181 359703 60 60 19,6 1091950 2547012 11,1 726,3 7655 11 392 186 148 -38 -204 372040 37842 75379 16 13 -46 323221 504061 -25,7 645,0 8106 13 1655 47 29 -18 -383 381200 49828 131900 21 22 261 428119 1012106 126 6447 7064 11 617 71 48 -23 -324 381300 87583 270837 37 4,5 473 3145377 5008889 -242 1542 2931 19 138,9 563 423 -140 -249 381920 38772 141208 1,6 2,3 73,4 493563 561760 -45,8 435,1 13625 3,1 9274 33 23 -10 -30,3 381930 68552 155648 29 26 8,1 455219 390296 -59,2 8341 2161,6 2,6 13275 34 25 -9 -265 381940 58546 131740 25 2,2 7,2 1392789 3422548 17O 2328 2086 09 -242 110 107 -3 -27 381990 255843 827491 107 13,7 54,0 2488516 5488207 50 569,4 8172 1,4 247,8 549 469 -80 -146 382490 32838 172230 14 29 1513 2087098 4578512 45 86,6 2039 2,4 1173 270 188 -82 -30,4 382590 42781 148280 18 25 85,0 430127 599990 -33,6 5509 1339,5 2,4 788,6 28 16 -12 -42,9 382991 20665 117424 09 19 170,6 2309069 4636038 -4,4 49,6 1373 28 877 156 158 2 13 383990 36560 50828 1 5 08 -338 910204 2506251 311 222,5 1099 05 -1126 95 60 -35 -36,8 384320 63154 354008 2,7 5,9 166,9 3581166 9950757 32,3 97,7 192,8 2,0 95,2 227 187 -40 -17,6 SUM 1817538 5057897 76,3 84,0 32,5 27858484 57133963 -1,6 3470 2563 -907 -26,1 o 0\
~
ci. e, Ó O~
NZ
o
e
l
;>~
el)g
.
~
~
c:: O '0g
J
¡
'.0'
"
el) ;> c:: -SNl69=Swedish Standard Industrial ClassificationVA80GGW= ValueAdded1980intheGGW-region (1980SEK)
VA93GGW =ValueAdded1993intheGGW-region (1993SEK)
SH80%=ShareofTotal ValueAddedin Manufacturing 1980inthe GGW-region
SH93% =Shareof TotalValueAddedinManufacturing 1993inthe GGW-region DVA%GGW =Percentage Change inValue AddedintheGGW-region (InFixedPriees) VA80RSW=Value Added 1980intheRestoCSweden (1980SEK)
VA93RSW=ValueAdded1993in theRestof Sweden(1993SEK)
DVA%RSW=PereentageChange inValueAddedintheRest ofSweden (InFixedPriees)
SPECQ80=Specialisation Quotientfor theGGW-region in1980 (InValueAdded Terms)
SPECQ93 =Specialisation Quotient for theGGW-region inl993(1nValue AddedTerms)
Q93/Q80=Ratioof SpeeialisationQuotients (InValue AddedTerms) Q93-Q80=Differenceof Specialisation Quotients(In Value Added Terms) NOFIRSW80=NumberofPlants intheRestofSwedenin 1980 NOFIRSW93 =NumberofPlants intheRestofSweden in1993 NOFICHRSW =ChangeinNumber ofPlants in theRestof Sweden NOFICHRSW% =Percentage ChangeinNumberof Plantsin the RestofSweden
Karlsson,
c.;
Klaesson, J.APPE
N
D
IX
D
:
PRODUCT
I
VITY
AN
D WAGE D
I
STRIBUT
I
ONS
Industry SNI 331111 (1980) 4001000SEKlEmp - Labourproductivity -Wagcg Industry SNI331111 (1993) GGW 100.n. n .n .L 12001000 SEKlEmp - Labourproductivity ,-Wages 1000; 800 : O~~~~~~~~~~~~~~~~~ O 5000 10000 15000 Labourfon:e 20000 Industry SNI341210 (1993) 1000SEK/Emp - LaboIJproductivity -W""" 750
9
! '---1._, L... 500 ~._-, GGW~~
~
i
250 n L l -O O 500 1000 1500 2000 2500 Labourfo<c:e Industry SNI 351320 (1993) O~~~~~~~~~~~~~~~~~ O 5000 10000 15000 Labourforce 20000 1000 SEKlEmp Industry SNI 341210 (1980) 1000 SEKlEmp 250 - Labour productivity -w •••• 200 1000 --w_Lebocr pro<hEtivity L~!
150 W 800 600 ~-~ e, L -..•_-
~
---
--\..-..."""\ L \L-. lOOf--_--' 50 O~~~~~~~~~~~~~~~~~ O 500 1000 1500 2000 Labourfon:e 2500 400 GGW 1ndustrySNI 351320 (1980) 4001000 SEKIEmp - Labourproductivity-
w
_
-,¡;-GGW 300l
.
~
._._-_. __._--~ ...•~-_
.
~
~
1---""""--.. nU
~
~
O
~===
=
========================
~
O 200 1000 2000 3000 Labourforce 4000 5000 200 O~~~~~~~~~~~~~~~~~ O 1000 2000 3000 Labourforce 4000 5000 86 Investigaciones Europeas,Vol.6,N°2,2000, pp. 65-90Sucess inManufacturing Employment inanIndustrial District... Industry 355110 (1980) lOOOSEKIEmp 200 __ Labourproduciivit;y -w•••• ...._-~ GGVY ISO L-~ ....
--
-
._-.
-t
-
...-.-.---lOO~L---'-_---l 50o
~~~--~~~
-
-~
~
--~~~
-
-
~~
~
o 1000 2000 Labocrforee Industry SNI355900 (1980) 2501000SEKlEmp -- Labourproducti vily1
-
Wages 200¡ o~~~~~~~~~~~~~~~~~~ o 1000 2000 3000 4000 Labowforce 5000 IndustrySNI356010 (1980) 1000 SEKlEmp -~ Labourproductivity 250._-W •••• ¡\
200 ! 1.1.. 150 ~ oL-~~~~--~~~~--~~~~~~ o 1000 2000 Labourforce 3000Investigaciones Europeas, Vol. 6,N°2,2000, pp.65-90
3000 IndustrySNI 355110 (1993) 1501000SEKJEmp - LabolIproductivity -W •••• 500
I
l
VYL
250 o o 1000 2000 3000 Labourforce Industry SNI355900 (1993) IOOOSEKlEmp .~ LAbour productivity j-W•••• 500 . L.··-·--l ."--, """'--_.~ L-, o~~~~~~~~~~~~~~~~~ o 1000 2000 3000 4000 Labourlorce IndustrySNI 356010 (1993) IOOOSEKlEmp oL-~~~ __L-~~~ __L-~~~ __L-~-' o 1000 2000 Labourl'orce 5000 3000 87Karlsson, C; Klaesson, J.
Industry SNI 356090 (1980)
2SO1000 SEKJEmp
-Labou<pro<!ucti.;ty
-W •••• 200 1 1. 150~
~
~
-
~
50 o~~~~~~~~~~~~~~~~~ O 2500 5000 Labcerforee 7500 Industry SNI 372040 (1980) 2501000 SEKJEmp -- Labour productivity -W•••• 200 150 ---'-'L...., ----;..- -l00r--_,GG •..-1
• r...VV-'·~
·
,
~
·
_
--···
I
·-
-
---
,
·
.-
Ir
50 oL-~~--~~~ __~~ __~~~ __~~ o 1000 2000 IndustrySNI381200 (1980) 1000SEKlEmp 200 _ LabowproductiYity -w••••\_
---
_.
_
._
.
~
... ISO oL-~~~--~~~~ __~~~~ __~~ o 1000 2000 Labourforce 3000 88 Industry SNI356090 (/993) 1200 1000 SEKJEmp- Labourproductivity
-w•••• o~~~~~~~~~~~~~~--~~ o 2500 5000 Lebocrfcrce 7500 IndustrySNI 372040 (1993) 7SO1000 SEKJEmp
-··I..abourproductivity -w •••• 500
1
I L ---lVV ~-""L...""""L.-., 250;
:;
.... J u-o o 1000 2000 3000 Labourforce 3000 Industry SNI381200 (1993) 1200 1000 SEKJEmp - Labourprodudivity -w•••• 1000 800 600•~
GGVV 400 .'----....•.1
.
,-
---
.
~
rt
i
:
:
200 ~ U o o 1000 2000 3000 LabourforceSucess in Manufacturing Employment inan Industrial District.:
Industry SNI 381300 (1980)
300 1000 SEKJEmp
- Labour productivity -w.,... 250 200
8
~---
l
oovv ISO~
-
-100~
'
'0
-~
~-u <llJ --"..yu ~ 50 o o 5000 10000 15000 20000 Labccrforce lndustry SNI 381940 (1980) 2501000SEKJEmp - LaboI.."productivity -w•••• 200 . --~.. GOVV ISO l~T
~h "-..'-""'-c.. 100~
f
~
-
-
-
.._-'
~
SO o o 2000 4000 6000 8000 10000 !.abourli>= Industry SNI 381990 (1980) 300 1000 SEKJEmp- Labour productivity
-
w
.,.
..
250 o~~~~~~~~~~~~~~~~-" o 5000 10000 15000 Labocrforce 20000 Investigaciones Europeas, Vol. 6,N° 2,2000, pp. 65-90 Industry SNI 381300 (1993) 10001000SEKJEmp - Laboo<pn><Iuoti,;ty -w.,... 150 o~~~~~~~~~~~~~~~~~ o 5000 10000 15000 Labourforce 20000 Industry SNI 381940 (1993) 1SO1000 SEKlEmp -t....abowprodur:tivity -w•••• o~~~~~~~~~~~~~~~~~ o 2000 4000 6000 Labourforce 8000 100001ndustry SNI 381990 (1993)
10001000 SEK/Emp - Labourproductivity
-
w.
".
.
150 500t
---
---
-
-
-
.
--
-
.
.
_--
--
.
..
.
"
"\
.
-.
OOVV--
"
250~, J. l-.n. \ o o 5000 10000 15000 20000 Labourforce 89Karlsson, C; Klaesson, J. lndustry SNJ382991 (1980) 4001000SEKIEmp :- Labour pt"oductivity ;-Wages Industry SNJ383990 (1980) 10001000 SEKIEmp .~ Lahourproductivity
-
w"",
800 600 400,
200~
,_
.._
.
_
_
.. 2SOO 5000 Labourforce Industry SNI 384320 (1980) 250 1000 SEKIEmp- LabourprochEtivity -w•••• .
,
200!
-1"., QGVV 50 5000 10000 15000 20000 Labowforce 90 25000 Industry SNI382991 (1993) 10001000 SEKIEmp - L.abowproductivity -w•••• O~~~~~~~~~~~~~~~~~ o 5000 10000 Labourforce Industry SNI 383990 (1993) lOOOSEKlEmp -L.abotxproductivity ~Waget 600 .~ 450 "\ ¡VV \ 300 -_._-,:
J
~~-~
~-150 O O 2500 5000 Lebocrforce Industry SNJ384320 (1993) 10001000SEKlEmp-l.abouproductivity
-W•••• 750 500 !.-'---,