An event study on acquiring firms listed on the Swedish stock market
MASTERS THESIS WITHIN BUSINESS ADMINISTRATION THESIS WITHIN: Finance
NUMBER OF CREDITS: 30 ECTS
PROGRAMME OF STUDY: Civilekonomprogrammet AUTHOR: Bergman, Jonatan & Kilit, Kevin
JÖNKÖPING May 2018
The Announcement Effect of M&As
and the Impact on Short-Term
Acknowledgements
Firstly, sincere gratitude is directed towards our supervisor, Andreas Stephan, who throughout this thesis has directed and helped us over different obstacles. Through your experience and guidance, we were able to have interesting discussions, and as a result put this thesis together.
Secondly, we would like to address appreciation to the students in our seminar group, who through constructive criticism have highlighted essential areas of improvements. For this, we
thank you for your time and effort.
Lastly, we thank our respective families and friends for the support throughout this period, encouraging us to maintain focused about the goal and the future ahead of us.
Jonatan Bergman Kevin Kilit
Master Thesis in Business Administration
Title: The Announcement Effect of M&As and the impact on Short-Term Performance Authors: Bergman Jonatan, Kilit Kevin
Tutor: Stephan Andreas
Date: 2018-05-21
Key terms: M&A (merger and acquisition), short-term performance, event study, announcement effect, abnormal return, performance factors
Abstract
M&A has for decades been an important topic within the corporate world as well as financial research, due to its performance and the impact it generates. The main objective of this study is to explore the effect of M&A announcements on the short-term performance of acquiring firms on the Swedish stock market. By conducting an event study with a sample of 194 M&As in various industries from 2007-01-01 to 2018-02-07, we are able to retrieve abnormal returns, analysing cumulative abnormal returns in order to measure the effect the announcements have on the stock price. Three performance factors are included in order to get an understanding of the potential impact they have, and if so, how strong that impact is. The performance factors are (1) payment method, (2) diversified versus focused M&As, and (3) cross-border versus domestic M&As. The empirical findings tell us that the abnormal returns are significant for most industries, and to a great extent positive. The performance variables only show significance for cash as a payment method where it generates a negative effect on the main event window (-1, +1). With these findings we hope to contribute to existing research by creating higher awareness to society and organisations about the performance M&As bring.
Table of Contents
1.
Introduction ... 1
1.1 Background ... 1 1.2 Problem Definition ... 2 1.3 Purpose ... 3 1.4 Research Question ... 4 1.5 Delimitations ... 42.
Theoretical Framework ... 6
2.1 Definitions of M&A ... 6 2.2 M&A Waves ... 62.3 Common Theories Linked to Motives for M&As... 7
2.3.1 Synergy Motive ... 8
2.3.2 Managerial Hubris and Self-interest ... 9
2.3.3 Efficient Market Hypothesis (EMH) ... 10
3.
Literature Review ... 12
3.1 Previous Research on Stock Performance and Determinants in M&As ... 12
3.1.1 Payment Method ... 13
3.1.2 Domestic versus Cross-border M&As ... 14
3.1.3 Focused versus Diversified M&As ... 15
4.
Method ... 17
4.1 Methodology ... 17
4.2 Sample ... 18
4.2.1 Industry classification based on SIC codes ... 18
4.2.2 Data Collection... 19
4.3 Hypotheses ... 21
4.4 Event Study Methodology ... 22
4.4.1 Event and Estimation Windows ... 22
4.4.2 Measuring Normal Returns ... 24
4.4.3 Measuring Abnormal Returns ... 25
4.5 Standard Deviation ... 27
4.6 Correlation and multicollinearity ... 27
4.7 Significance Test ... 28
4.8 Regression Model ... 29
5.
Results ... 31
5.1 M&A activity within full sample in Sweden ... 31
5.2 Descriptive Statistics ... 32
5.3 Sample Results AAR and CAAR ... 33
5.4 Significance test for abnormal returns ... 35
5.5 Significance test between different industries... 36
5.6 Regressions for performance variables ... 37
6.
Analysis ... 38
6.1 Abnormal returns produced by the Event Study ... 38
6.2 Differences between industries ... 39
6.3 Performance variables ... 40
6.3.1 Payment method ... 40
6.3.3 Diversified versus Focused ... 41
7.
Conclusions ... 43
8.
Discussion ... 45
Reference list ... 47
Figures
Figure 1 - Distribution of performance factors ... 20
Figure 2 - Distribution of sample within selected industries ... 21
Figure 3 - Time-line of event and estimation windows... 24
Figure 4 - Sample M&A activity in Sweden during the years 2007-2018 ... 31
Figure 5 - AAR Day-to-Day for full sample and respective industry ... 33
Figure 6 - CAAR in the different industries ... 34
Figure 7 - CAAR in different event periods for the full sample ... 34
Tables
Table 1 - Descriptive statistics of the full sample ... 32Table 2 - Mean significance of the different industries... 35
Table 3 - Mean significance of the full sample ... 36
Table 4 - Estimated results from multiple regression model... 37
Appendix
Appendix 1 - List of acquiring firms, announcement date and SIC Codes ... 54Appendix 2 - Descriptive statistics of the individual industries ... 58
Appendix 3 - Day-to-day AAR ... 59
Appendix 4 - Mean significance of differences ... 59
Appendix 5 - Correlation matrix of the full sample ... 59
Appendix 6 - Collinearity test (VIF) ... 60
Appendix 7 - Histogram of the regression model, full sample ... 60
Appendix 8 - Chart of Swedish Krona to Euro (EUR/SEK) ... 62
1. Introduction
_____________________________________________________________________________________
The first chapter of this thesis gives a short introduction to the topic of M&As. The problem definition will be developed and presented, as well as the research questions and the purpose of the thesis. Lastly, the delimitations are discussed.
______________________________________________________________________ 1.1 Background
Being crucial in a time characterized by continuous change, companies are frequently looking for development opportunities. This leads companies to pursue acquisitions and/or mergers of other firms as a growth and expansion strategy. In a merger, two or more companies decide on a unification into a new legal entity and can be seen as a collusion of two independent firms, while in an acquisition one firm take over another after making an offer. The main goal is to find interesting acquisitions where the expense of value produced should not be higher than the actual value. In the end, the long-term idea is that an acquisition or merger will result in increased revenues, being the major rationale and main cause for increasing M&As. However, finding a perfect target that will fully suit the acquirer is known to be a rather unattainable goal (Shah & Arora, 2014).
Over the last decades, one can notice an increasing interest for, and number of M&As in the global corporate world. Approximately 30,000 acquisitions were done in 2004 with a total estimated value of $1,900 billion. This development would come to reach its peak three years later with more than the double amount (JP Morgan, 2017; Schoenberg & Carthwright, 2006). Looking at more recent data and observations, the trend of acquisitions as a business development strategy is still strong, with estimations of $4,700 billion in 2015, passing the peak in year 2007. We are now back at the peak momentum of amount invested in M&As globally, both in volume and value, and the trend has recovered from the declining numbers during the period of financial crisis in 2008-2009 (JP Morgan, 2017). For many reasons, the impact of the announcement of M&As varies within the existing literature, in many cases even showing value disruption. Looking simply at the acquiring shareholders, Boston Consulting Group (2007) mentions that this was the case for more than half of 3,207 M&A deals from 1992-2006.
Taking into account economic, regulatory, and financial factors, Sweden ranks as number five among markets with highest transaction activity and attractiveness for M&As, according to Baker McKenzie (2017). They estimate an upsurge of M&A deals for the upcoming year of 2018, with total acquisition deals worth $20.3 billion for Swedish firms, an increase with 62.4% from 2017. Looking at 2017 as a whole, Sweden experienced 972 majority stake acquisitions, with 620 of these targeted towards other Swedish firms, and the rest against firms in a foreign country (Zephyr, n.d). Although political uncertainty caused a decline in global M&A activity in 2016 compared with the previous year (Baker McKenzie, 2017), any major hesitation did not appear to be present on the Swedish market in 2017, still maintaining an increase from previous year. To put the numbers into context, it is worth noting that in 2017, Sweden alone accounts for almost as many M&A deals as the three neighbouring countries Denmark, Finland and Norway together, with the Nordic neighbours accounting for 1040 deals in total.
1.2 Problem Definition
The performance of M&As is a vastly explored area and the results of the studies are mixed. A majority of the previous studies on shareholder wealth surrounding the announcement of an M&A finds that the targeted firm’s shareholders typically enjoy positive wealth effects (Campa & Hernando, 2004; Huang & Walkling, 1987; Roll, 1986). However, from the acquiring firm’s perspective the findings are a bit more divergent. There are studies suggesting that the shareholders of the acquiring firm obtain small but positive wealth effects (Campa & Hernando, 2004; Georgen & Renneboog, 2004; Jarrell & Poulsen, 1989) whereas others find zero or negative abnormal return for the acquiring firms shareholders (Andrade, Mitchell & Stafford, 2001; Healy, Palepu & Ruback, 1992; Jensen & Ruback, 1983).
Previous studies have commonly been made on short- and long-term performance of the acquiring firms. The thick base of literature and research within the topic have mainly had the focus on the U.S., UK, European, or Asian markets. However, fewer studies have been conducted with a perspective of Swedish acquiring firms. To the authors’ knowledge, no greater research has been done comparing returns between industries or sectors for acquiring firms in Sweden.
Within previous research, numerous factors and their effect on the performance of an M&A have been examined. Amongst these factors there are three that are constantly brought to light. The first factor is payment method, more specifically cash or other (stock or a mix of the both). Secondly, domestic versus cross-border, namely whether the target company is from the same country or not. And lastly, focused versus diversified, in other words if the target firm operates in the same industry or not. Despite their constant occurrence, to the authors’ knowledge, these factors have not been tested together in research focused on the Swedish M&A market. Furthermore, the results of these performance factors have been varying, and for this reason it would be of interest to study them further.
Since the topic of M&As has always been present in the corporate world in general, it is important for the society and business world to be aware of, and recognise the outcomes of pursuing these kinds of activities; especially within an M&A-active market as the Swedish.
1.3 Purpose
The purpose and aim of this thesis is to find significant and relevant differences in the share price movements of acquiring firms located in Sweden, based on M&A announcements. Mainly, we are seeking for potential abnormal returns around the announcement day for Swedish acquirers. The focus will be on acquiring firms due to the fact that many of the targeted firms are private companies and not publicly listed on an exchange, hence not having any available information about stock prices. Further analysis will be done to investigate if there are differences in the announcement effect for particular sectors or industries. Lastly, components and performance factors such as; payment method, domestic versus cross-border and focused versus diversified acquisitions, will be considered in order to understand if they have any effect on the stock price returns surrounding the M&A deals. By investigating these different factors along with previous research, we hope to receive a better understanding of the M&A performance within the different industries in Sweden, and of the potential factors that might create an underlying effect on the performance to a certain direction.
1.4 Research Question
The main research question will serve as a point of departure for the thesis. It will be used as benchmark in terms of the empirical study, data collection and choice of methodology. Moreover, aim of this study is to contribute to the exiting literature by answering the following research question:
• Do the announcements of M&As create any abnormal stock return from the
perspective of Swedish acquiring firms?
Sub-questions that will be addressed:
• Are there any differences in the short-term performance from the announcements
of M&As between industries?
• Do the factors; payment method, domestic versus cross-border, and focused
versus diversified, have any impact on the short-term performance surrounding the announcements of M&As?
1.5 Delimitations
In order to focus the study, limitations to the research have been implemented. These limitations will be highlighted in this section.
There are several approaches on measuring the wealth effect from an M&A, depending on which stakeholder point of view one might take. In this study, the approach will be from the shareholder’s perspective. By stating this limitation, the stock price movement can be used in order to measure the shareholder value. Further, this will also be a sound reflection of the company performance, since managers should be representatives and act in the best interest of the company’s stakeholders, in this case, the shareholders.
Moreover, there are several other performance factors next to those that will be looked upon in this study that affect the outcome of an M&A, which will not be taken into consideration. Furthermore, the focus will solely be on the short-term performance and will not consider the long-term perspective of M&As or the potential long-term synergy that might occur as a result of these activities.
Lastly, M&A is a composite of two expressions with similar but nevertheless different meanings. In this study however, there will not be any differentiation of the two. The M&As in this sample have to be announced and completed; merely rumoured M&As will be excluded. In addition, the focus will solely be on acquiring firms listed on the Swedish stock exchange due to many of the targeted firms not being publicly listed.
2. Theoretical Framework
_____________________________________________________________________________________
The beginning of the second chapter consists of a brief definition of M&As. Thereafter follows a discussion of the phenomenon of M&A waves. The chapter ends with a discussion of the common theories within the area of M&As, which will also function as a foundation of this thesis.
______________________________________________________________________ 2.1 Definitions of M&A
According to Schoenberg (2006) M&As is a growth method and strategic approach for firms trying to accelerate expansion. Mergers and acquisitions are commonly used in a composed expression, i.e. “M&As”. However, the definition and meaning of the two concepts are different. An M&A could occur within or across industries, with the assets of each firm being combined and shareholders in each firm eventually becoming joint owners of the new merger. In comparison to this, an acquisition or takeover is the notion of an acquiring firm offering cash or shares in order to get access and control over a target firm. After an acquisition the bidding firm will own a majority of the targeted firm’s shares (Jensen & Ruback, 1983; Piesse, Lee, Lin & Kou, 2013; Schoenberg, 2006). A merger should only be of interest when the value of combining the two firms is greater than the value of them separately (Erel, Liao, & Weisbach, 2012).
2.2 M&A Waves
Due to the high number of M&As occurring in different periods, it is important to understand the underlying reasons why they occur. Since the late 1800s, the world has been faced with several merger waves which have been followed by periods of lower M&A activity. The first wave is estimated to have occurred from 1895 to 1904 and the sixth and most recent one from 2003 to 2008, according to Martynova and Renneboog (2008) and McCarthy (2013). Both of them argue for the many implicit and shared reasons for the respective waves, with the latter wave seen as more worldwide than previous ones. It has been argued that the last wave was mainly caused by private equity companies capitalizing on all-time low interest rates and inexpensive credits, which was pursued in order to recover from the dot-com bubble (McCarthy, 2013).
Looking at the merger waves during the last century, certain characteristics have been noticed with common occurrence during periods of economic, political, and regulatory change, although all being diverse and unique with respective implicit reasons (Harford, 2005; Martynova & Renneboog, 2008; Mitchell & Mulherin, 1996). A common characteristic identified by Martynova and Renneboog (2008), is that prior to all merger waves, the given market has experienced a recent crash and advances from an economic depression through a restructuring. Eventually, this leads to periods of recovering financial markets and quick credit growth. Finally, the result from disruptive innovations within respective sector, mainly technological, financial, and industrial along with regulatory transformations, has been a strong driver for the past waves (Martynova & Renneboog, 2008).
By comparing M&A activity in different industries over time, Andrade, Mitchell and Stafford (2001) find that the industries dominating the M&A activity varied to some extent. They argue that this could be due to industry-level shocks such as supply shocks, deregulations or technological innovations, which corresponds with what Martynova and Renneboog (2008) state in their research. Many previous researchers argue for these shocks as potential drivers of merger waves (Andrade et al., 2001; Harford, 2005; Kaplan & Holmstöm, 2001; Mitchell & Mulherin, 1996). Harford (2005) however, argues for the improbability of it being a sole reason for increased merger activity. He also points out that restructuring occurs more frequently in periods of highly available liquidity, causing relatively high resource allocation and incentives for investments and acquisitions in periods of economic optimism. However, companies with lower liquidity will not face the same incentives even though they are in a positive economic condition.
2.3 Common Theories Linked to Motives for M&As
There are two main perspectives that are used in order to understand the implicit reasons for the M&A activity and their impact. Harford (2005) examines and defines the two different perspectives; (1) neoclassical and (2) behavioural. The neoclassical perspective emphasizes the impact of a generally changing environment, with respective industry trying to adjust to this by creating new synergies as a reaction. On the other hand, the behavioural perspective puts focus on the notion of misguided valuations and managerial hubris along with the self-interest of management (DePamphilis, 2009; Harford, 2005).
Berkovitch and Narayanan (1993) and Nguyen, Yung, and Sun (2012) divide the motives to engage in M&A activity into two different categories; (1) value-increasing and (2) value-decreasing; stating the three main motives to be synergies, agency, and hubris. The increasing has mainly been linked to the neoclassical perspective and the value-decreasing with the behavioural perspective.
2.3.1 Synergy Motive
Shah and Arora (2014) state that many companies that survived the latest major financial crisis in 2008-2009, view M&As as an option to restructure their current business to survive further. As a part of the neoclassical perspective and value-increasing motives, restructuring is seen as a method to continue staying competitive and interesting in a changing environment. However, it is necessary to consider the costs, benefits, and likelihood of constructing a prosperous change in the long run when undertaking such a strategic action. The main definition behind synergy is the interaction of two or more entities as a whole produce something greater than the sum of its parts. The synergy motive has been referred to as the main motive behind positive gains where there should be a focus on maximizing shareholder wealth for both bidder and target firm (Berkovitch & Narayanan, 1993).
It is clear that what interests firms to engage in M&A activity stems from the potential growth and synergy gains that may arise by conducting a takeover. Mainly, firms look for operational synergies as a more convenient and reasonable synergy motive, where financial synergies have been more challenged as a sustainable motive, focusing on e.g. capturing tax benefits (Gaughan, 2002). The synergies can result in further positive impacts which may include increased market share, decrease in costs as an effect of better economies of scale and scope, broader product supply, and can in many cases help to obviate competitors within a similar field of operation (Campa & Hernando, 2004; Ross, Westerfield & Jordan, 2009; Roughan, 2002; Shah & Arora, 2014).
As a result, the synergy motive is relevant to consider since many firms evidently seek to diversify into other industries, both in order to restructure and to differentiate. Consequently, we believe factors such as industry focus and if the acquisitions are
directed towards firms domestically or abroad could be connected to this theory when evaluating M&A announcement impact.
2.3.2 Managerial Hubris and Self-interest
M&As may face some challenges, often referring to the synergy issue between the acquiring and targeted firm, where an over appraisal of the synergy gains by the managers of the acquiring firm is a common scenario. Evidently this leads to overestimation of the value of a bid, and underestimation of the exercise of running a bigger business, often referred to as hubris (Roll, 1986). The hubris and agency theory are two large components of the behavioural perspective that are, arguably, to be seen as common challenges within M&As. Nguyen, Yung, and Sun (2012) believe that the hubris and agency theory are two value-decreasing motives for firms, compared to the synergy motive and the neoclassical perspective. Roughan (2002) states that the adverse behaviour of a management acting in hubris potentially causes long-term issues, focusing on this rather than on motives such as enhancement management and tax benefits. Certain managers tend to neglect important details and have an attitude to the result of the acquisition considered to be over-optimistic (Schoenberg, 2006). In a market where managers are not explicitly taking into account the theory of market efficiency, which Roll (1986) empirically argues for, managers are trying to estimate the value of a firm and evidently end up paying too much for the target firm. The efficient market theory states that the market is perfectly valued, which conflicts the action of managers trying to generate a better estimation of a firm’s value (Roll, 1986).
Looking from the acquirer’s perspective, Roll (1986) makes the case of overpayment and overconfidence by many managers as a reason behind conducting takeovers. It is estimated that one third of all European acquisitions in the 1990s were made under the influence of managerial hubris, which tends to result in less successful takeovers (Goergen & Renneboog, 2004). However, there are other reasons pointed out, which could potentially create negative value from an M&A, such as managers acting in self-interest. This also corresponds with the agency theory and the core concept that one acting (a principal) on the behalf of someone else (an agent), is unable to provide the expected value of the principal due to non-mutual interests which can create a conflict (Bosse & Phillips, 2016). If it is possible to point out the M&As which are derived from positive
incentives, one might find that shareholders actually do benefit but are often ruled out due to hubris and self-interest (Andrade et al., 2001).
Managers sometime tend to seek their own personal interests within the bid rather than to optimize the benefits for the shareholders. It can consequently lead to an overestimation of the target firms’ value by the managers, which might eventually have a negative effect on the acquiring firms’ value (Morck, Shleifer & Vishny, 1990). Morck et al. (1990) and Goergen & Renneboog (2004) mention the thought-process of many managers when valuing a target firm, contemplating between their personal motives and the best sake of the company. Hence, managers tend to overvalue deals influenced by personal motives than deals motivated by the best sake of the company.
One of the early researchers in the field of managerial self-interest was Jensen (1986). He argues that managers use free cash flow to build an empire, rather than focusing on generating maximized shareholder value. The management would prefer using the free cash flow to make acquisitions, a strategic action to catch company growth opportunities with managerial benefits correlating with company growth, rather than using available cash to distribute to shareholders. This can potentially lead to acquisitions which might affect shareholder value negatively.
The theories mentioned above implicate the gravity of factors such as payment method or deal size, since they can affect the deal performance and the share prices from the M&A announcements. It eventually creates incentives to look further into acquiring firms rather than target firms, and whether the market values the M&A the same as management (as highlighted by the performance of the announcement), or if there is a potential over-optimism or hubris by management as implicit factor.
2.3.3 Efficient Market Hypothesis (EMH)
The Efficient Market Hypothesis (EMH), developed by Fama (1970), assumes that stock prices completely reflect all accessible information at any given point in time. The information may take three different forms; strong, semi-strong, and weak, with a strong form contending an inclusion of private and non-disclosed information, such as insider information, being incorporated in the stock prices. The semi-strong efficiency however
gives no justification for fundamental analysis, taking into account all other public information and the immediate reactions of releases of new available and public information such as M&A announcements or report information, with investors reacting instantly to it. The weak form takes into account public information factors such as past prices and volume data, giving no justification for technical analysis as a method to find abnormal returns or undervaluations. Exploring this theory in greater depth, it states that the market is efficient due to information being available to everyone. Attempts to find undervalued stocks, being a chief function for many acquiring firms when finding target firms, and having an advantage over the market would hence be unfeasible since the market correctly values them.
By investigating the abnormal returns from M&A announcements from the perspective of acquiring firms at the announcement date, the theory of market efficiency remains relevant for this study in order to create an explicit apprehension of the results. This is mainly due to the immediate impact new information creates when being incorporated in the stock prices. Hence, it is possible to draw relevance to the effect new information has on the change of stock prices from the M&A announcements with the efficient market theory taken into account, giving incentives for a further analysis.
3. Literature Review
_____________________________________________________________________________________
In the third chapter, a review of previous studies on M&As relevant to this thesis is presented, starting with general research on stock performance surrounding M&As and continuing with a review of the performance factors studied in this thesis.
______________________________________________________________________ 3.1 Previous Research on Stock Performance and Determinants in M&As
Comparing the different event studies conducted around the topic of M&A announcement performance, it can be said that the results differ to a broad extent. Most noticeable is the fact that target firms tend to receive higher abnormal returns than acquiring firms. In the study made by Eckbo (1983), evidence is presented that target firms enjoy statistically significant abnormal returns of 6.24% with an event window of (-1, +1), i.e. one day before until one day after the announcement date, whereas the bidding firm enjoys no abnormal return. In a more recent paper which finds negative bidder returns with the same event window, Campa and Hernando (2004) from their empirical findings conclude further that a positive average abnormal return for the target firm shareholders exists, being less successful for the acquirer’s shareholders experiencing a negative return 55% of the cases.
Jarrell and Poulsen (1989) find in their sample on U.S. firms from 1963-1986 that the target firm shareholders experienced vast abnormal returns, at estimated 28.99%, comparing with the 1.29% return of the bidding firm, using a longer event window of 31 days. Other studies that have found positive returns for both target and bidding firm are Goergen and Renneboog (2004) and Yilmaz and Tanyeri (2016). However, the returns for the target firm are significantly higher as the authors calculate the 5-day and 3-day cumulative abnormal returns (CARs) respectively. In the latter study, they review M&As globally between 1992-2011 with a sample of 263,461 deals.
Andrade et al. (2001) finds that when combining the acquiring and targeted firms, the abnormal return is positive in both the short- and long-term with an average of 1.8% and 1.9% respectively. However, only the short event window of (-1, +1) is found to be statistically significant. For targeted firms the abnormal return is considerably higher at
16% and 24% for the short and long event window respectively, both being statistically significant. In the case of acquiring firms, the abnormal returns are negative both short- and long-term, -0.7% and -3.6% respectively. Yet, neither of them is proved to be statistically significant.
However, due to these studies’ varying results, with most observed abnormal returns falling on the target firms’ shareholders, we believe that examining the abnormal returns for Swedish acquirers is of interest. Previous studies have examined numerous variables that affect the performance of an M&A. This study examines; (1) payment method, (2) diversified versus focused, and (3) domestic versus cross-border, all of these being linked to the different theories previously mentioned.
3.1.1 Payment Method
In M&As there are various payment methods used in the transaction. The methods commonly used are cash, stock, or a hybrid of the both (Gaughan, 2011). Davidson and Cheng (1997) find that the target firm’s shareholders tend to be more beneficial in cash acquisitions, earning a higher abnormal return. Other researchers concluding a better return when cash is used instead of stocks are Danbolt (2004), Fuller and Glatzer (2003), Huang and Walking (1987), Wansley, Lane and Yang (1983). The latter find evidence of almost twice the return from a bidder’s point of view, when using cash compared to stock acquisitions. Davidson and Cheng (1997) argue that the acquiring firm has to make up for costs that the target firms’ shareholders might face, such as tax liabilities which is a factor influencing the decision to offer a higher bid premium. The target shareholders need to be compensated due to the tax payment that will occur (Huang & Walking, 1987). Further reasoning for the use of cash, which accords with the theory of Ang and Cheng (2006) and Schleifer and Vishny (2003), who conclude that in a stock offer the target firm may anticipate the bidder’s stock to be overvalued, since a bidder would not make an acquisition with undervalued stocks. Hence, cash offers may mitigate the asymmetric information risk. However, after controlling for relative size of the deal, Davidson and Cheng (1997) find that it could actually be the larger deal sizes that directly affect the abnormal return, rather than the method of payment.
Different from previously stated research, Fuller, Netter and Stegemoller (2002) conclude that the higher returns when acquiring a private firm using stocks as a method of payment
may be caused by tax concerns, where a delay of tax liabilities is a matter of fact until a potential liquidation is in place for the ownership stake for the acquiring firm. This coincides with Gaughan (2011), mentioning the tax delay from using stocks, as a reason and advantage for more use of this method. Actions like these can create motives for the acquiring firm to offer a lower bid for the acquisition. In a study made by Andrade et al. (2001), the authors find evidence of increasing use of stocks as payment method, almost doubling from the 80s to the 90s. Loughran and Vijh (1997), Nguyen, Yung, and Sun (2003) and Schleifer and Vishny (2003) state that it is common that managers of a bidding firm prefer share payments as an acquisition method when stocks are overvalued, and hence using cash when stocks are undervalued. Harford (2005) carries on with this as a sole explanation to merger waves, using overpriced stocks to capitalize on lower-valued companies, from a behavioural perspective. They conclude that it creates incentives for management taking possible actions in order to receive an overvaluation on existing firm equity, ultimately leading to “less expensive” payment method than cash in acquisitions. This can eventually be connected to the theory of managerial hubris along with the agency theory.
3.1.2 Domestic versus Cross-border M&As
Vasconcellos and Kish (2013) believe that there are several factors, both advantageous and disadvantageous, relevant to the topic of cross-border M&As. For example, diversification and exchange rates are favourable variables. By acquiring a firm in another country one will be able to reduce risk even within the same industry. In a global perspective it is estimated that around a third of all M&As are cross-border deals, with two thirds taking place in a domestic context. In countries with depreciated currencies, acquisitions tend to increase (Erel et al., 2012). What Doukas and Travlos (1988) find support for, is that shareholders of multinational companies engaging in cross-border M&A to countries in which they are not currently operating, receive a positive wealth effect. This effect is particularly strong when the M&A is made in a less developed country. Erel et al. (2012) state a higher likeliness of companies finding investment and synergy opportunities within countries close to the own, due to cultural and geographical similarities and connections.
In research conducted by Danbolt (2004) it has been stated that cross-border acquisitions tend to achieve a better return than domestic activities. This is in agreement with what Goergen and Renneboog (2004) state about the theories of foreign direct investments where the latter find that cross-border M&As should create more value to the acquiring firm and their shareholders. The reasoning behind these theories is that firms investing in foreign markets should enjoy extended market power and diversification, due to the presence of assets or markets which might not be accessible in the home country (Tripathi & Lamba, 2015). This would, if the theories hold, increase the expected premiums in cross-border M&As. However, the findings of Goergen and Renneboog (2004) actually state the opposite; namely that domestic M&As premiums are lower and that they create more value, which contradicts studies by Danbolt (2004) and Doukas and Travlos (1988).
From another point of view, Vasconcellos and Kish (2013) point out challenging factors such as government restrictions, regulations as well as unavailable information, which need to be taken into consideration in cross-border M&As. They also state that in most countries, an approval from the government prior to an M&A is necessary, where regulations and restrictions in that country needs be taken into account. Before engaging in an M&A, information about for example corporate structure, key figures or corporate culture, are vital for a successful deal. This information might not be revealed by a foreign firm. Dutta, Saadi, and Zhu (2013) mention the synergism and integration of the new acquired business with the current business in this new area as a vital challenge which needs to be overcome in order to realize the potential benefits.
3.1.3 Focused versus Diversified M&As
Roughan (2002) mentions in his publication the lack of success when diversifying into other business segments than the primary one. However, he points out that there are indeed successful cases, with expansion to segments not too differentiated from the primary, historically being more successful with better opportunities for gaining market share, as confirmed by Goergen and Renneboog (2004). Campa and Hernando (2004) name the correlation between diversified M&As and negative returns, and focused M&As being more connected with positive returns. This aligns with the findings of Doukas, Holmén and Travlos (2002), who propose that focused rather than diversified acquisitions are preferred when it comes to creating synergies, confirming this empirically with
positive returns for focused and negative for diversified. They also point out that investments into diversified businesses are often associated with the agency theory; that diversified investments tend to have higher agency costs in which they commonly offset the diversification advantages. The performance of the diversified investments tends to be unfavourable, thought to be caused by management not always prioritizing value-creation for shareholders but rather focusing on diversifying businesses, relating to the theory of managerial self-interest. Shleifer et al. (1990) claim diversifying businesses to be more harmful to acquiring firms’ shareholders, questioning the action and objective of management, finding empirical evidence for less return when diversifying. However, they did find diversifying businesses in their U.S. sample to have slightly positive returns in the beginning of their estimation window from 1975-1979, while facing negative returns during 1980-1987. However, the returns from the businesses conducting M&As with firms in their respective SIC 4- digit code, i.e. focused, did have positive and higher returns than diversified in both time-periods. A similar conclusion was made by Comment and Jarrell (1995) in almost the same time period with less diversified M&As during the 1980s. They find in their results that there were higher observed market values and returns for M&As that where focused rather than diversified, although diversified tended to be more active. Healy et al. (1992) in their study suggest that operating cash flow increases for merged firms, as compared to the industry as a whole. This is especially true for M&As of closely related businesses, i.e. focused.
4. Method
_____________________________________________________________________________________
The following chapter describes the method used in this thesis. It includes descriptions of the methodology, the chosen sample and data collection. Further, the hypotheses are introduced as well as justifications of the use of the event study methodology, the market model, and the regression model.
______________________________________________________________________ 4.1 Methodology
As stated previously, this research will look further into the short-term performances by looking at the abnormal returns for Swedish acquiring firms surrounding the M&A announcement date, along with different performance factors and return differences in selected industries. When conducting a research within the field of M&A, a necessary distinction is whether to use a deductive or inductive approach. For this research a deductive approach is most relevant, with existing hypotheses or theories being tested in order to find a logical conclusion (Bryman, 2012). For this study, main focus lays on the stated hypotheses, which can be found in section 4.3. They have been formulated based on previous research and existing theories within the field of M&A in order to measure and understand the effect of Swedish M&A announcements in the short-term, along with potential factors affecting the returns for acquiring firms. Further, the use of a deductive approach normally evolves into the utilization of quantitative data, in which it is the approach of this study as well (Bryman, 2012). As relevant secondary data from other parties has in our opinion been eligible, accessible, and trustworthy, it has been the main source of data collection. Secondary data is simply referred to the concept of somebody else gathering information, while primary data is the commitment of self-gathering of data by the author. This study will take on a modern positivistic perspective, ruling out any misleading interpretations in order to receive realistic, truthful, and solid information. With this approach often being related to the deductive approach, hypotheses are being tested based on knowledge conducted from previous theories and reports, being summarized in the theoretical framework and literature review (Bryman, 2012). Generally seen as the preferable method of data collection, retrieving primary data is in many cases not a viable method, being time-consuming and requiring resources not easily
accessible (Bryman, 2012). Since the databases Zephyr and Thomson Reuters Datastream are considered reliable, common, and well-recognized sources of financial information for research within the field of M&A, they provide the relevant information and secondary data needed in order to further progress with this study. Other secondary data, e.g. relevant literature, has been retrieved from databases, such as Google Scholar and Primo. Being aware of possible bias in secondary data, we have tried to contain this problem by making use of sources found in well-known journals and peer-reviewed articles in order to ascertain the information’s relevance as well as the original purpose of respective research.
4.2 Sample
The full sample consists of 194 Swedish M&As in which the acquiring firm is publicly listed. These companies will be divided into five different industries based on SIC codes, the top 35-45 M&A deals based on deal value in each industry. Further, the M&As must be announced and/or completed. The information and characteristics about the M&As and the announcement date was collected from Zephyr and the stock price data was gathered from Thomson Reuters Datastream.
4.2.1 Industry classification based on SIC codes
In order to analyse the different industries targeted, we will follow the US SIC division structure according to the U.S. Department of Labor (n.d). The Standard Industrial Classification (SIC) is a system based on codes varying from two to four digits, with four digits being a rather narrowed and specific industry and two digits a more general classification (Doyle, 2016). We will be looking at the five industries from Zephyr with the highest M&A activity, with the other industries having too low levels of activity to be deemed relevant. Barber and Lyon (1996) argue for the use of SIC codes when analysing different industries, mainly focusing on the trade-off between two-digit and four-digit SIC codes. A main argument for researchers, such as Peck and Temple (2002), is that by using four-digit codes it leads to more niche industries and fewer firms within a sample, while two-digit will be more broad and able to have larger samples. The reason why we will mainly be looking at the two-digit SIC classification follows the same argument as Doukas et al. (2002) and Doukas and Kan (2004), where they make distinctions from the different SIC classifications and groupings. Simply, they state that an acquisition is
labelled as focused when there exists a match of the first two-digit codes in the core business of the firm. If this is not the case, it is deemed diversified. A main rationale behind this usage is based on the fact that industries within the same two-digit classification are considered to be closely affiliated with a difficulty in distinguishing the industries apart.
Therefore, the industries which will be compared are: Manufacturing (SIC 20-39), Transportation, Communications, Electric, Gas, and Sanitary Services (SIC 40-49), Wholesale Trade and Retail Trade (SIC 50-59), Finance, Insurance, and Real Estate (SIC 60-67), and Services (SIC 70-89).
4.2.2 Data Collection
Gathering secondary data is a necessity in order to conduct this study. To be able to do this, access to a database containing M&A transactions and deals is of relevance. Zephyr is a database by Bureau Van Dijk providing valuable information and details about this, being updated hourly (Bureau Van Dijk, 2012). Zephyr lets one follow M&As in most countries, from completed to rumoured, in which it is possible to sort based on certain characteristics such as country, M&A type, deal value, method of payment, industry etc. Of interest for this study was Swedish M&As from 2007-01-01 to 2018-02-07, announced or completed, with a minimal final stake of a target firm of 51%. It is important that the acquiring firm is listed on the Swedish Stock Exchange, while the target firm could be either privately owned or publicly listed with no restriction on country of operation. The fundamental reasoning behind why the acquiring firm has to be listed is due to the observation of stock price movements as a measurement tool of performance. Inserting these requirements and limits into Zephyr along with the observed industries, it gives a sample of 2,579 deals. Taking into account necessary factors such as method of payment being either cash or share payment (or hybrid), it gives us a final sample of 691 deals. After omitting deals with missing values from Zephyr and Thomson Reuters Datastream, the usable amount equals to 194 deals. These are within the selected industries and have a clear majority in amount of transactions, showing that industries outside of these targeted are considered too small to compare.
(Source:Zephyr (n.d.))
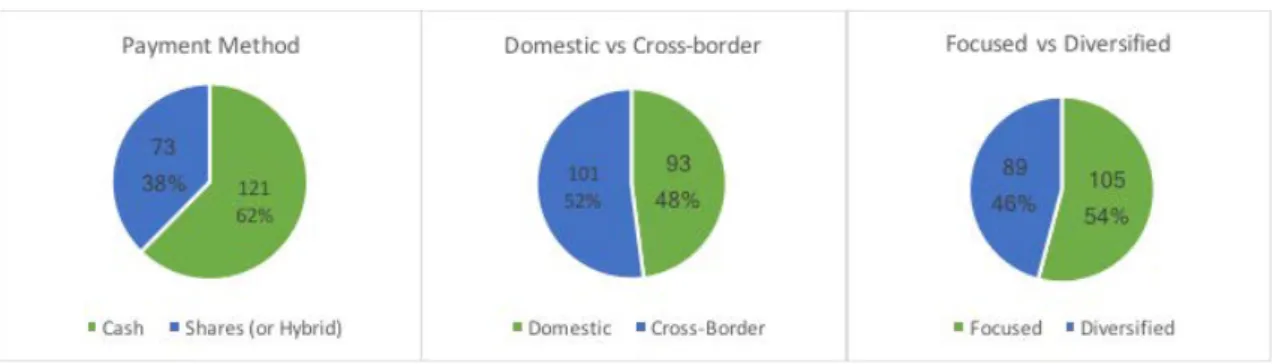
Looking at Figure 1 we can see how it varies between the different M&As when looking at the different aforementioned characteristics or variables. Looking at payment, we notice 121 deals being conducted with the use of cash while 73 deals are conducted using shares or a hybrid of both. There were 93 deals where both acquirer and target firm were based or listed in Sweden, while 101 were Swedish listed acquirers targeting firms operating in another country of origin. Of the 194 observations, 89 were firms differentiating into another industry than the home industry of operation, and 105 with acquirers investing into another firm operating in the same industry.
Observing the chosen five industries, we have decided to look at the top 35-41 deals within each industry. The major reasoning behind this is that there exists an uneven frequency of deals within the selected industries; adjusting for this making the sample size more equally weighted, we are able to make a more just comparison. Furthermore, according to the central limit theorem a larger sample size (n > 30) one can presume a normally distributed sample (Brooks, 2008). To collect stock prices for the relevant dates around the specific event day, Thomson Reuters Datastream has been the main database and source where we have also omitted deals where acquiring firms’ stocks contain missing values from the data obtained from Thomson Reuters Datastream. The sample that we will be using is divided per industry as follows:
Figure 2 - Distribution of sample within selected industries
(Source:Zephyr (n.d.))
4.3 Hypotheses
Based on previous literature and theories on the respective effect on the performance of M&As, five hypotheses have been developed in order to statistically investigate and understand some potentially relevant factors.
Hypothesis #1: The bidding firm will experience a positive abnormal return during the period surrounding an M&A announcement.
Hypothesis #2: There will be no dissimilarities in the abnormal stock return between the different industries in the period of an M&A announcement.
Hypothesis #3: The bidding firm will experience a higher return in the period of an M&A announcement when using cash as a payment method, rather than shares (or hybrid).
Hypothesis #4: The bidding firm will experience a higher return in the period of an M&A announcement when conducting a domestic M&A, rather than cross-border.
Hypothesis #5: The bidding firm will experience a higher return in the period of an M&A announcement when it is targeting a firm in a focused industry, rather than diversified.
4.4 Event Study Methodology
According to Armitage (1995) there is a large set of research within the area of financial economics looking to measure the abnormal return of stocks, i.e. the difference between the actual return and the expected return. He further explains that the procedure of estimating the abnormal return and testing for the significance has come to be known as event study methodology. Since the main objective of this thesis is to find whether the announcement of an M&A has an effect on a company's short-term performance, it will take on an event study approach. The event study methodology of this thesis will follow the approach presented by MacKinlay (1997). He states that the first step of an event study is to identify the specific period surrounding the event of interest being examined. This is referred to as the event window. Further, one uses financial market data, i.e. the company stock, to measure the impact of the event, in which the use of Microsoft Excel has been applied in order to measure these. The given rationality in the marketplace, i.e. that the market is efficient, is an important assumption to the usefulness of the event study. This implies that any new information should be fully reflected and incorporated in the company’s stock price. Using this data, one can calculate the abnormal returns during the event window, which will be examined in order to find evidence for the impact of the studied event.
4.4.1 Event and Estimation Windows
In accordance with the presented approach by MacKinlay (1997) this study uses an event window to examine changes in the company’s stock prices during the announcement period. Additionally, an estimation window is used to predict the expected return of the companies. The expected return will be calculated using the market model which is recommended by MacKinlay (1997), where the process will be further explained in section 4.4.2.1.
Continuing, some notations about the period studied need to be defined and clarified. The M&A announcement day is defined as t = 0, the days prior, leading up to the event day are defined as -t and the days after the event are defined as +t.
The event window, according to MacKinlay (1997), is usually based on a few days surrounding the actual event date. The effect of the event study approach is most effective
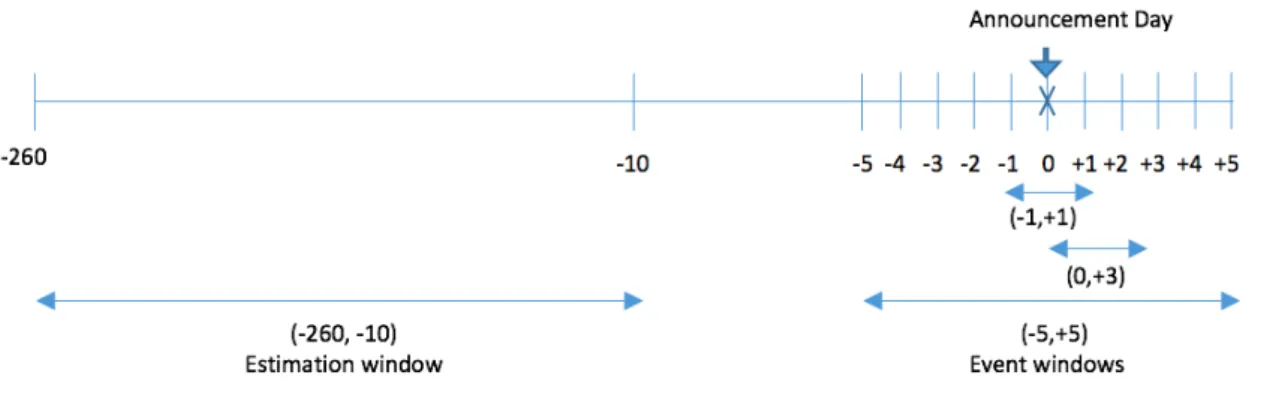
when the event window is held short. When creating the event windows of this thesis we found inspiration in Martynova and Renneboogs’s (2008) review on previous studies on short-term effect of M&A announcements. The main event window is (-1, +1) in order to capture the effect of the actual M&A announcement. To support the main event window, we created two more, (0, +3) to see if the effect lingers the days following the announcement, and (-5, +5) in order to capture possible information leakage before the announcement and corrections post the announcement. One main rationale for using a relatively short event window is to decrease the possibility of other events or information having an effect on the stock price when using a longer window, leading to misleading result (McWilliams & Siegel, 1997).
As stated above, an expected return or normal return of the company stock is needed to calculate the abnormal return. Therefore, an estimation window must be defined and used to estimate the expected return. The estimation window generally occurs prior to the event window. Besides that, it should not include the event itself as to avoid the event from influencing the estimation of the expected return (MacKinlay, 1997). The estimation window of this event study will consist of 250 days (-260, -10), the choice of the length was inspired by Corrado (2011) which corresponds to the approximate number of trading days in a calendar year.
A graphical presentation of the timeline of the event study, including the estimation and event window, is represented by Figure 3 below.
Figure 3 - Time-line of event and estimation windows
4.4.2 Measuring Normal Returns
The main objective of this study is to analyse the abnormal returns in stock prices related to the M&A announcement reactions. In order to do this, a consideration needs to be taken into account of what the normal return would be predicted to be without any major occurring news (MacKinlay, 1997). There are several different approaches one can use to calculate the normal return, categorized as statistical or economical models. The first group is using statistical assumptions of the behaviour of the stock. In the second group assumptions of the investor behaviour is added, with the advantage of this being the more accurate calculations of the normal returns that comes from the allowance of further restrictions (MacKinlay, 1997). Nevertheless, according to Armitage (1995), the more complicated (economical) models may have larger explanatory power but are not commonly used in empirical work due to the lack of evidence of the benefits received from them.
4.4.2.1 Market Model
MacKinlay (1997) presents two statistical models, the constant mean return model and the market model. The first model is probably the simplest one where you basically use the average return from the estimation window as the normal return. Despite the simplicity of the model, Brown and Warner (1980) argue that it consistently yields similar results as more complex models. The second model is an example of a one factor model and states a linear relation between the return of a stock and the return of the market portfolio. The market model is an improvement to the constant mean return model in the sense that the estimation error and variance of the abnormal return is decreased by the detachment of the part of the return that is affected by the systematic risk. This implies that the ability to capture the abnormal return that actually is affected by the event is
increased (MacKinlay, 1997). Moreover, he states that there are limited gains from applying a multifactor model, such as the Fama-French Three-Factor Model or the Capital Asset Pricing Model, in an event study. This is mainly due to the minimal explanatory power these additional factors hold. Furthermore, the market model has become a standardized model for estimating the normal returns (Armitage, 1995).
Following the arguments above and the justification by MacKinlay (1997), we will use the market model to estimate the normal return using Nasdaq OMX30 as the market portfolio. Further, the model assumes normal distribution. The approach to estimation of the normal return is presented in the following formula:
𝑅𝑅𝑖𝑖𝑖𝑖 = 𝛼𝛼𝑖𝑖 + 𝛽𝛽𝑖𝑖𝑅𝑅𝑚𝑚𝑖𝑖+ 𝜀𝜀𝑖𝑖𝑖𝑖
𝐸𝐸(𝜀𝜀𝑖𝑖𝑖𝑖) = 0 ; 𝑣𝑣𝑣𝑣𝑣𝑣(𝜀𝜀𝑖𝑖𝑖𝑖) = 𝜎𝜎𝜀𝜀2𝑖𝑖 (1)
Rit = actual return of the security at time t of security i
Rmt = return of the market, OMXS30, at time t
αi = alpha of the market model
βi = beta of the market model
𝜎𝜎𝜀𝜀2𝑖𝑖= sample variance of the market model
εit = the zero mean disturbance term
4.4.3 Measuring Abnormal Returns
In order to calculate the abnormal return surrounding the event window, the expected return first has to be estimated. This is done using the market model formula on the estimation window. The prices for the individual stocks as well as for the Nasdaq OMX30 during the estimation window (-260, -10) were collected from Thomson Reuters Datastream, also done for the event windows (-1, +1), (0, +3) and (-5, +5).
The returns are continuous and were calculated by using the LN function in Excel, more specifically LN(Pt/Pt-1), for both the stock and the market returns on each specific event.
The last components are the alpha and beta from each individual stock, which were derived from a One-Pass regression of the estimation window. The expected return is calculated using the following formula:
𝐸𝐸(𝑅𝑅𝑖𝑖𝑖𝑖) = 𝛼𝛼𝑖𝑖 + 𝛽𝛽𝑖𝑖𝑅𝑅𝑚𝑚𝑖𝑖+ 𝜀𝜀𝑖𝑖𝑖𝑖 (2)
Having the expected return, we are able to calculate the abnormal return (AR) for any given stock at time period t. The AR is given by subtracting the expected return from the actual return. The AR tells us how the value of the firm is affected by the investigated event. The formula is as follows:
𝐴𝐴𝑅𝑅𝑖𝑖𝑖𝑖 = 𝑅𝑅𝑖𝑖𝑖𝑖− 𝐸𝐸(𝑅𝑅𝑖𝑖𝑖𝑖) (3)
In order to capture the overall total-firm specific effect and stock movement during our event windows in which the market might respond to new information, the cumulative abnormal return (CAR) was calculated. In this thesis we employ three different CARs, one for each event window namely, CAR (-1, +1), CAR (0, +3), and CAR (-5, +5) which is obtained by the sum of all ARs of each event window:
𝐶𝐶𝐴𝐴𝑅𝑅𝑖𝑖(𝑖𝑖1,𝑖𝑖2) = � 𝐴𝐴𝑅𝑅𝑖𝑖𝑖𝑖 𝑖𝑖2 𝑖𝑖=𝑖𝑖1
(3)
The usage of CAR is known as a suitable function in order to calculate the short-term effect on returns, in which it is the more common approach due to the compounding of returns. CAR is a more widely used and preferred estimate compared to the buy-and-hold abnormal returns (BHAR) when analysing returns with a short-term perspective, with BHAR being more common during long-term return studies (Fama, 1998).
This thesis investigates the abnormal returns over several days (event window) and across different company stocks, which can be seen as two dimensions. According to MacKinlay (1997) one needs to aggregate the abnormal return along these two dimensions in order to draw conclusions for the event of interest. An aggregation over time is already made in (3) so the next step is to add the dimension across company stocks. In order to do so
one first needs the average abnormal return (AAR), obtained through the following formula where N represents the number of observations:
𝐴𝐴𝐴𝐴𝑅𝑅𝑖𝑖= 𝑁𝑁 � 𝐴𝐴𝑅𝑅1 𝑖𝑖𝑖𝑖 𝑁𝑁 𝑖𝑖=1
(5)
The two dimensions are represented by the cumulative average abnormal return (CAAR). CAAR exhibits the total average abnormal return for the entire event window as well as across company stocks. This can be obtained in the same way as calculating the cumulative abnormal return, hence the following formula:
𝐶𝐶𝐴𝐴𝐴𝐴𝑅𝑅(𝑖𝑖1,𝑖𝑖2) = � 𝐴𝐴𝐴𝐴𝑅𝑅𝑖𝑖 𝑖𝑖2 𝑖𝑖=𝑖𝑖1
(6)
4.5 Standard Deviation
The standard deviation is a measure of variation, or in other words the dispersion and average amount of variation around the mean (Bryman, 2012). The standard deviation represents a description of the data, rather than indicating whether the data is right or wrong. It should be used as a descriptive statistic indicating how the data of the sample is distributed around the mean but is also needed for statistical tests on estimated parameters.
4.6 Correlation and multicollinearity
The use of correlation is to determine whether there is a relationship between two different variables, taking the value between -1 as perfect decreasing correlations, and +1 as perfect increasing correlation. When conducting an analysis using independent variables, there is a potential risk of the explanatory variables, two or more, being highly correlated (Brooks, 2008). This is known as the notion of multicollinearity, which can be detected by using the variance inflation factor (VIF) and Tolerance level. The VIF and Tolerance are used as estimations of how much overvaluation there may be on the variance on the regression coefficients, being caused by the potential multicollinearity (O’Brien, 2007). The Tolerance is obtained by one minus the R for the specific
independent variable, where a low Tolerance may show signs of multicollinearity. Receiving a value close to one using the VIF, which is simply one divided by the Tolerance, simply tells us that there is no detected multicollinearity between the variables that are being tested for, while a value of around 4 to 10 may show signs of multicollinearity according to O’Brien (2007).
4.7 Significance Test
The main rationale behind conducting t-tests is to infer whether the CARs are significantly different from zero. Mainly, what is being tested is most commonly a hypothesis normally being stated previously, referred to as a null hypothesis, with a desire to be either rejected or accepted. Conducting a t-test is the most common version of doing a parametric test within the field of event studies and abnormal returns (MacKinlay, 1997).
The following equations, stated in the report by MacKinlay (1997), will be utilized in order to conduct the parametric t-tests. These tests are performed in order to test the significant levels on the CARs for each event window in the different industries. Due to the fact that the σε2 is considered unknown, an estimator had to be used in order to calculate the variance of the abnormal returns. Following MacKinlay (1997) this thesis used the sample variance estimator of σε2 from the market model regression of the estimation window. 𝑣𝑣𝑣𝑣𝑣𝑣(𝐴𝐴𝐴𝐴𝑅𝑅𝑖𝑖) =𝑁𝑁12� 𝜎𝜎𝜀𝜀2𝑖𝑖 𝑁𝑁 𝑖𝑖=1 (7) 𝑣𝑣𝑣𝑣𝑣𝑣�𝐶𝐶𝐴𝐴𝐴𝐴𝑅𝑅(𝑖𝑖1,𝑖𝑖2)� = � 𝑣𝑣𝑣𝑣𝑣𝑣(𝐴𝐴𝐴𝐴𝑅𝑅𝑖𝑖) 𝑖𝑖2 𝑖𝑖=𝑖𝑖1 (8) 𝑡𝑡 = 𝐶𝐶𝐴𝐴𝐴𝐴𝑅𝑅(𝑖𝑖1,𝑖𝑖2) √𝑉𝑉𝐴𝐴𝑅𝑅�𝐶𝐶𝐴𝐴𝐴𝐴𝑅𝑅(𝑖𝑖1,𝑖𝑖2)� (9)
In order to test significance on the differences in return between the different industries the following formula was used:
𝑡𝑡 = 𝐶𝐶𝐴𝐴𝐴𝐴𝑅𝑅(𝑖𝑖1,𝑖𝑖2)1 − 𝐶𝐶𝐴𝐴𝐴𝐴𝑅𝑅(𝑖𝑖1,𝑖𝑖2)2
�(𝑉𝑉𝐴𝐴𝑅𝑅(𝐶𝐶𝐴𝐴𝐴𝐴𝑅𝑅(𝑖𝑖1,𝑖𝑖2)1) + (𝑉𝑉𝐴𝐴𝑅𝑅(𝐶𝐶𝐴𝐴𝐴𝐴𝑅𝑅(𝑖𝑖1,𝑖𝑖2)2))
(10)
4.8 Regression Model
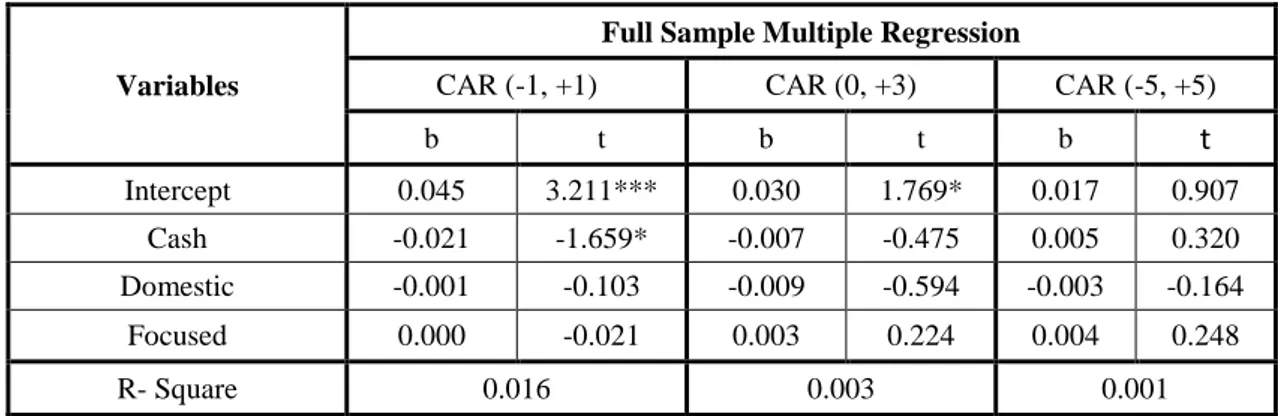
To be able to test how the chosen performance factors of this thesis affect the stock performance during the announcement period of the M&A, a multiple regression was conducted using the statistical analysis programme SPSS. With a multiple regression we are able to establish if there is any relationship between the dependent (CAR) and independent (performance factors) variables using quantitative cross-sectional data. A regression of the full sample, all industries combined, was also conducted in order to test the robustness and validity of the results. The regression model is assumed normally distributed and linear and is structured as follows:
𝐶𝐶𝐴𝐴𝑅𝑅𝑖𝑖,(𝑖𝑖1,𝑖𝑖2)= 𝛼𝛼 + 𝛽𝛽1𝑋𝑋𝑃𝑃𝑃𝑃𝑃𝑃𝑚𝑚𝑃𝑃𝑃𝑃𝑖𝑖 𝑀𝑀𝑃𝑃𝑖𝑖ℎ𝑜𝑜𝑜𝑜𝑖𝑖 + 𝛽𝛽2𝑋𝑋𝐶𝐶𝐶𝐶𝑜𝑜𝐶𝐶𝐶𝐶−𝑏𝑏𝑜𝑜𝐶𝐶𝑜𝑜𝑃𝑃𝐶𝐶 𝑣𝑣𝐶𝐶 𝐷𝐷𝑜𝑜𝑚𝑚𝑃𝑃𝐶𝐶𝑖𝑖𝑖𝑖𝐷𝐷𝑖𝑖
+ 𝛽𝛽3𝑋𝑋𝐹𝐹𝑜𝑜𝐷𝐷𝐹𝐹𝐶𝐶𝑃𝑃𝑜𝑜 𝑣𝑣𝐶𝐶 𝐷𝐷𝑖𝑖𝑣𝑣𝑃𝑃𝐶𝐶𝐶𝐶𝑖𝑖𝐷𝐷𝑖𝑖𝑃𝑃𝑜𝑜𝑖𝑖+ 𝜀𝜀𝑖𝑖𝑖𝑖
(11)
The constant or the intercept of this model is the alpha, which is the expected mean of CAR when all the independent variables are equal to zero. The dependent variable is as stated above the CAR of the specific event window. Since this thesis is using three event windows each industry will have three models with different dependent variables, that is: CAR (-1, +1), CAR (0, +3), and CAR (-5, +5).
Moreover, (11) specifies three independent variables. First, a dummy variable that indicates what payment method was used in the M&A deal. 1 was allocated to all deals that was paid with cash and 0 for deals using other types of payment methods, e.g. shares. The impact of payment method is estimated by 𝛽𝛽1. Second, a dummy variable that states whether the target company was from a foreign country or was from the same country of operation as the acquiring company. 1 was allocated to the domestic deals and 0 for all the cross-border deals, and the impact of this is displayed by 𝛽𝛽2. The third independent
variable is also a dummy variable that denote if the M&A deal is directed within the same or a different industry than the acquiring company. 1 was given to a focused deal and 0 to a diversified deal. The effect of this independent variable is stated by 𝛽𝛽3. 𝜀𝜀𝑖𝑖𝑖𝑖 is the residual term of this regression model.
5. Results
_____________________________________________________________________________________
This chapter presents the empirical results of our research displayed by charts, figures and tables.
_____________________________________________________________________________________
5.1 M&A activity within full sample in Sweden
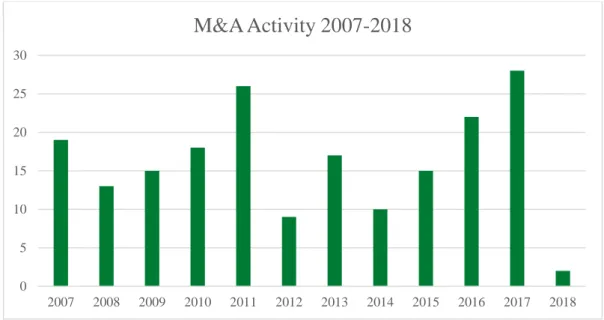
Looking at Figure 4, we can see how our sample of 194 M&As is distributed throughout the years of the selected timeline from 2007-01-01 to 2018-02-07. Taken into consideration is the low number in the most recent year 2018 where full information is not yet available. Taking a median and average of these years we receive a yearly number of M&As of 16. Noticeable is a relatively stable pattern throughout all the years, with slight decreases in 2008, 2012 and 2014 and upward trends 2011, 2013, and 2016.
Figure 4 - Sample M&A activity in Sweden during the years 2007-2018
(Source: Zephyr (n.d.)) 0 5 10 15 20 25 30 2007 2008 2009 2010 2011 2012 2013 2014 2015 2016 2017 2018
M&A Activity 2007-2018
5.2 Descriptive Statistics
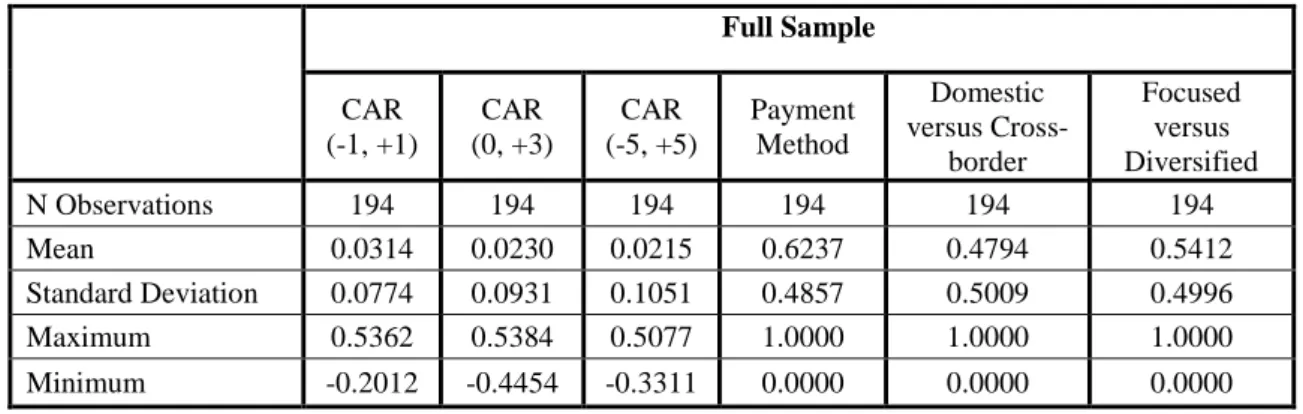
Table 1 - Descriptive statistics of the full sample
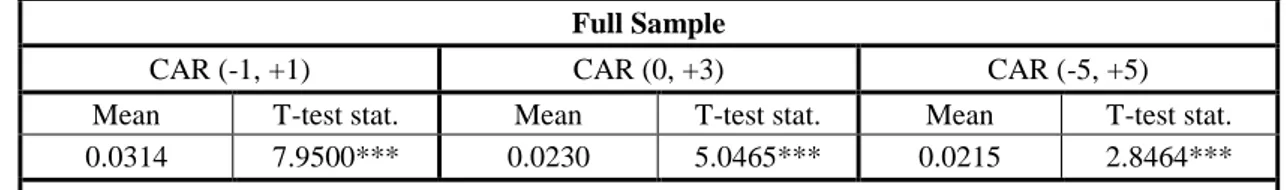
Looking at the above statistics we notice some varying results. Firstly, the statistics show the results from the full sample, taking into account all industries. Secondly, the different industries are presented separately in order to get a composed appreciation of the varying results in appendix 2. The mean simply shows the average of that specific variable, and standard deviation shows the variation as a dispersion from the mean. The maximum and minimum simply demonstrate the largest and smallest value observed within that sample and variable. Looking at the full sample, once can find that the mean of CAR (-1, +1) to be the highest with the lowest standard deviation. This may be related to larger deviations in the sample data between minimum and maximum for CAR (0, +3) and CAR (-5, +5) than for CAR (-1, +1).
Interesting is the relatively even distribution of the performance variables. 62.37% conducted an M&A with cash, and 37.63% with another form of payment. The distribution of domestic and foreign M&As has been the most even and almost equals, with foreign having a slight advantage of 52.06% versus domestic with 47.94%. 54.12% conducted M&As within the same industry of operation, while 45.88% diversified.
Full Sample CAR (-1, +1) CAR (0, +3) CAR (-5, +5) Payment Method Domestic versus Cross-border Focused versus Diversified N Observations 194 194 194 194 194 194 Mean 0.0314 0.0230 0.0215 0.6237 0.4794 0.5412 Standard Deviation 0.0774 0.0931 0.1051 0.4857 0.5009 0.4996 Maximum 0.5362 0.5384 0.5077 1.0000 1.0000 1.0000 Minimum -0.2012 -0.4454 -0.3311 0.0000 0.0000 0.0000
5.3 Sample Results AAR and CAAR
(Source: authors’ calculations)
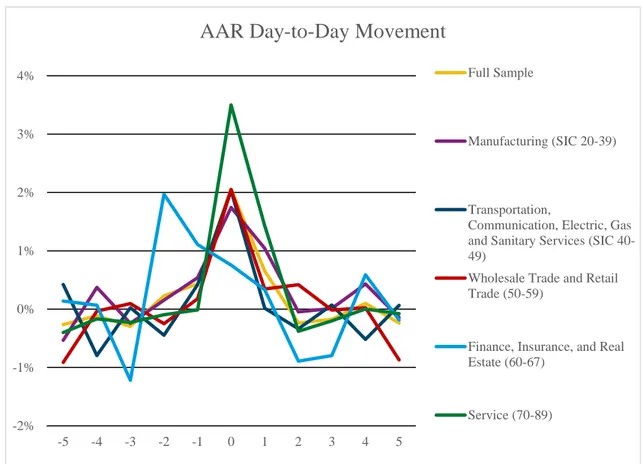
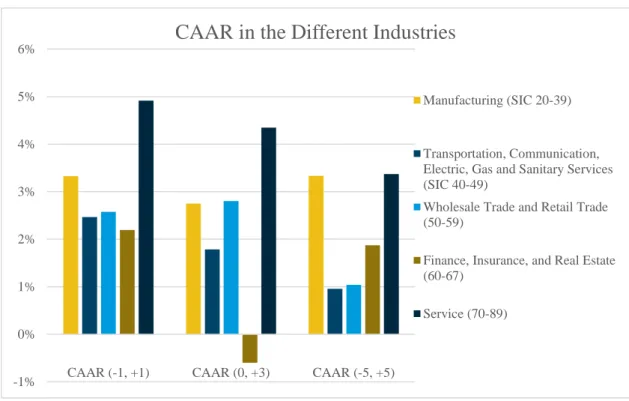
When observing the different day-to-day movement with respective industry abnormal return, we may notice a consistent pattern. The major increase tends to occur in the actual event date followed by a decline which is considered relevant because of the release of M&A announcement occurring that day, information that eventually is being incorporated in the stock price. This is true in all cases except for the industry Finance, Insurance, and Real Estate (60-70) which peaks around two days prior to the actual event date. Looking at Figure 6, it is clear that the performance of industry Service (SIC 70-89) is the most dominant one in all event periods measured in CAAR for the observed sample. The only negative return occurring in the results is within industry Finance, Insurance, and Real Estate (SIC 60-67) and its CAR (0, +3), namely the post-announcement period of the M&A. However, the same industry experience positive returns the other event periods of study. -2% -1% 0% 1% 2% 3% 4% -5 -4 -3 -2 -1 0 1 2 3 4 5
AAR Day-to-Day Movement
Full Sample
Manufacturing (SIC 20-39)
Transportation,
Communication, Electric, Gas and Sanitary Services (SIC 40-49)
Wholesale Trade and Retail Trade (50-59)
Finance, Insurance, and Real Estate (60-67)
Service (70-89)