Tick Size Reductions effect on provisions of Liquidity
Research on the Stockholm Stock Exchange
Master’s thesis within Financial Economics
Author: Fritjof Kjell
Tutor: Agostino Manduchi
I
Master’s Thesis in International Financial Analysis
Title: Tick size regulations effects on provisions of Liquidity Author: Fritjof Kjell
Tutor: Agostino Manduchi
Date: 2015-05-11
Subject terms: Tick size, Public limit order book, bid-ask spread, depth, trade volume, liquidity
Abstract
The tick size of a security has acted as powerful tool for regulators to improve market quality, encourage trade, and create fair competition in trading venues. As a result, The Federation of European Securities Exchange (FESE) has long been concerned with finding an optimal tick size regime to implement across exchanges in Europe. From 2009-2010, The FESE and the Stockholm Stock Exchange (SSE) implemented the FESE tick size table 2 for 81 Large Cap stocks in a collaborative effort to enhance the overall market quality for all of its partic-ipants. This study investigates the FESE tick size table 2 that was implemented in October 2009 and June 2010 on the SSE and its impact on Large Cap stocks in term of liquidity. Through the measurement and analysis of the three commonly used features of liquidity (bid-ask spread, depth, and trade volume), the study suggests that the provisions of liquidity in-creased due to the implementation of the FESE tick size table 2 overall, improving market quality and encouraging trade amongst its participants.
II
Contents
1 Introduction ... 1
1.1 Purpose and Contribution... 2
1.2 Research questions ... 2
2 Market Microstructure ... 3
2.1 Tick Size ... 3
2.1.1 Optimal Tick Size ... 4
2.2 Provisions of liquidity on the PLB ... 5
2.3 Stockholm Stock Exchange ... 7
2.3.1 SSE Tick sizie structure ... 8
2.4 Regulation Debate ... 9 3 Literature Review ... 11 3.1 Bid-Ask Spread ... 11 3.2 Depth ... 12 3.3 Volume Traded ... 13 4 Method ... 14 4.1 Data Collection ... 14 4.1.1 Time Frame ... 14 4.1.2 Stock Selection ... 15 4.2 Methodology ... 16 4.2.1 Bid-ask spread ... 16 4.2.2 Depth ... 17 4.2.3 Trade Volume ... 17
4.2.Wilcoxon Signed-Rank Test ... 18
4.3 Hypotheses ... 18
4.3.1 Hypotheses 1: Bid-ask spread ... 19
4.3.2 Hypotheses 2: Depth ... 19
4.3.3 Hypotheses 3: Trade Volume ... 19
5 Empirical Findings & Discussion ... 20
5.1 Bid-ask Spread ... 21
5.1.1 Event 1: 2009 – 26 – 10 ... 21
III 5.2 Depth ... 23 5.2.1 Event 1: 2009 – 26 – 10 ... 23 5.2.2 Event 2: 2010 – 7 – 6 ... 24 5.3 Trading Volume ... 24 5.3.1 Event 1: 2009 – 26 – 10 ... 25 5.3.2 Event 2: 2010 – 7 – 6 ... 25 6 Concluding Remarks ... 27 7 Future Research ... 28 List of Reference ... 29 Appendix ... 32 Tables Table 1 ... 8
Table 2: Stock Selection ... 32
Table 3: Absolute Bid-Ask Spread ... 33
Table 4: Relative Bid-Ask Spread ... 34
Table 5: Absolute Depth ... 35
Table 6: Relative Depth ... 36
1
1 Introduction
Tick size, or the minimum price variation, of a security has been an important topic for regulators in equity markets around the world since the 1990’s. A vast amount of studies have been produced to analyse the effects that these tick size changes have had on the overall market quality of different capital markets. The general trend has been to lower the tick size in order to enhance market quality and encourage a higher volume of trade. This study aims to investigate the FESE tick size table 2 that was implemented in October 2009 and June 2010 on the Stockholm Stock Exchange (SSE) for Large Cap stocks, more specifically the change in provision of liquidity for stocks that experienced a tick size reduction. This is done through the three commonly used features of liquidity; bid-ask spread, depth, and trade vol-ume. Furthermore, this study will address the current regulatory debate concerning tick size and how these historical event might be tied into the present.
In the past the tick size has acted as a powerful tool for regulators to adjust the bid-ask spread, market depth, and trading activity. Harris (1994) started the debate on tick size re-duction, arguing that a reduction in the bid-ask spread through a lower tick size would lower transaction costs and in turn improve trade volume. Studies by Jones and Lipson (2001) and Goldstein & Kavajecz (2000) on the USA stock exchanges proved to be consistent with Harris’ argument that a smaller tick size decreased bid–ask spreads and lessened liquidity provision. However Cordella & Foucault (1996) developed a model that suggests that a zero minimum price variation never minimizes the expected trading costs. Evidently, this argu-ment leads a serious debate amongst regulators, practitioners, and academics about the opti-mal minimum price increment.
Harris (2003) finds that the effect of the tick size for provisions of liquidity is twofold. If it is too large the bid-ask spread could become unnecessary large, imposing a cost increase for market participants. Alternatively, if the tick size is too small, it may decrease the depth in the order book seeing as market participants will be reluctant to display their orders due to it being easier to front-run orders in the Public Limit Order Book. Hence, a too small tick size may reduce the profitability of supplying liquidity. Despite the growing interest on the matter there is still no uniform tick size regime in place ensuring optimal tick size for a stock.
2 1.1 Purpose and Contribution
In an effort to harmonize the tick size across trading venues in Europe, the SSE adopted the FESE tick size table 2 which reduced the tick size for Large Cap stocks and was imple-mented in October 2009 and June 2010. One of the main purposes for this change was to enhance the overall market quality for its participants. A critical component in achieving this is the nourishment of provision of liquidity. Hence, the purpose of this thesis is to study the effect that the tick size reduction had on liquidity (i.e. features of liquidity). In order to contribute to the current regulatory debate for tick size, this study provides in-sight to how Large Cap stocks on the SSE reacted to the tick size reduction. In addition, it introduces unfamiliar readers to the topic of tick size as a whole and the importance of the effects it might impose.
1.2 Research questions
The two main research question that this paper will attempt to answer are as follows:
1. Is there significant evidence that proves a change in the features of liquidity fol-lowing the implementation of the FESE tick size table 2?
3
2 Market Microstructure
Tick size falls in the field of market microstructure is, in broad terms, explained as the trading rules and systems used by a capital market (Harris 2003). Market microstructure is concerned with the actual trading process and how the specific mechanisms of a capital market affect market quality as a whole (Johnson 2010). Studies in the field focus on analysing these effects and shed light on whether or not these mechanics work towards an efficient capital market. Provisions of liquidity play a key role in achieving an efficient capital market. In literature it is widely recognized that liquid markets offer trading with little or no impact on price. Hence, the interest in provisions of liquidity for different capital markets has grown over the last two decades due to rapid changes in structure and technology. These changes arose with the demutualization of many exchanges, making them profit based enterprises, and an increase in intra-market competition (Johnson 2010).
The applied tick size regime is an important mechanism of capital markets. A fair amount of research in the field have addressed its relationship to market quality and in particular the provisions of liquidity on the market. The effects of tick size change on provisions of liquidity will act as this paper’s foundations.
2.1 Tick Size
The tick size of a particular security is defined as the minimum price increment, meaning the smallest amount by which a trader can improve a price. For example, a Large Cap stock trading at 140 before June 2010 on the SSE had a tick size of 0.25 and could assume prices such as 140.25, 140.50, 140.75 and so on. Directly following the change to the tick size re-gime, that same stock would have a tick size of 0.1 and could assume prices such as 140.1, 140.2, 140.3 and so on. When regulators change the tick size regime for stocks, they do so in an attempt to harmonize the public limit order book (PLB) with regards to the two priority rules of the PLB:
Price Priority Rule
Time Priority Rule
The price priority rule simply states that the better price on the PLB is executed before the worst price. The Time priority rule means that the oldest price, or the one that “came there
4
first”, is executed first when there are separate orders for the same price. This creates a bal-ance between the two rules when setting the tick size as a trader might find that the cost of “waiting” due to the Time Priority rule to be too long with regards to the price risk of un-dercutting the current price. Therefore, if the tick size is too small then too much bias is given to the price priority rule meaning that market participants will have less of an incentive to place limit orders as other participants can undercut them with a small fraction, also known as “front running”. If instead the tick size is too large then the opposite happens and the time priority rule has an advantage over the price priority rule (Harris 2003). It is because of this reason that the tick size cannot be zero, as it would diminish incentives to post limit orders to the PLB.
2.1.1 Optimal Tick Size
The topic of an optimal tick size is something that has been frequently debated over the last two decades. Today, the idea of a uniform tick size that fits all has been cast aside. Instead, the trade-offs from setting a tick size regime on a particular capital market is the main topic of debate.
When the tick size is large it creates a greater incentive for market participants to place a limit order, thereby enhancing displayed orders and provisions of liquidity. However, the conse-quence of this is a larger bid-ask spread which increases participant transaction costs when executing an order. This, in turn, diminishes the trading incentive and the provisions of li-quidity (Angel, 2012). Furthermore, the model developed by Cordella & Foucault (1996) suggests that a zero minimum price variation never minimizes the expected trading costs. The reason for the difficulties when defining an optimal tick size is mainly because it is not necessarily the same for all securities traded. Smaller capitalization securities in particular can benefit from a larger tick size relative to price, resulting in a liquidity boost due to the in-creased incentives to place limit. In contrast, Large Capitalization securities in general are naturally more liquid. If a larger tick size was imposed on Large Capital securities, then li-quidity could suffer due to the increase in transaction costs that would follow. Alternatively, the provisions of liquidity might gain from a lower tick size. (Seppi 1997)
Finally, capital markets across the world do not have the same market structure which makes an optimal tick size across markets difficult to envision. On a dealers market, the tick size sets the minimum spread, i.e. the profit realized by the dealers. In these markets, dealers incur
5
inventory costs, adverse selection costs, and order processing costs. Thus, when a larger tick size is applied incentives for dealers to place limit orders could increase as they realize a greater profit covering potential costs. (Angel, 2012)
2.2 Provisions of liquidity on the PLB
The incentive to post limit orders on the PLB is closely related to what tick size regime is imposed, and the trade-off between the two different priorities consequently affects the pro-visions of liquidity. In broad terms, liquidity is recognized as the level of ease that one can convert a given asset into cash. Moreover, the level of liquidity provision on a PLB can reflect the ease of doing so for a given security. This dates back to Harold Demsetz’s (1968) view that expresses liquidity in terms of immediacy, meaning it reflects the ability to trade imme-diately by executing at the best available price.
The level of liquidity provisions on a capital market can therefore be seen as the ability to trade quickly at prices that are reasonable with regards to supply or demand conditions. Hence, if a capital market is considered to be liquid, it can be regarded as a meeting place where buyers and sellers can buy and sell large volumes quickly without effecting share prices (Schwartz 1993). In terms of the PLB, the book should have a high trading volume with a low cost of immediacy, i.e. trading cost, to be considered a liquid PLB (Johnson 2010). The estimation of the provision of liquidity on any given security is derived from certain characteristics of the PLB which are referred to as parameters. Johnson (2010) identifies three main features of the PLB used for estimation: Width, Depth, and Resiliency. Another renowned author, Schwartz (1993), presented these same features in his literature but in-cluded two additional features: Breadth and Immediacy. These five features of the PLB are within the amount of previous research that have been most frequently applied when meas-uring provisions of liquidity on capital markets.
Width can also be referred to as the bid-ask spread. The bid-ask spread is an important feature
in financial markets as a whole, however for the common trader it might first and foremost be associated with the transaction cost upon execution. In addition, it is also commonly viewed as an important feature when determining liquidity. This is because the transaction cost is the cost of immediacy, hence the price they have to pay directly. Traders that demand immediacy will buy or sell at the national best ask price (NBA) or national best bid price
6
(NBB) respectively, resulting in the cost being the distance between the two. From the deal-ers’ or market makdeal-ers’ perspectives, the bid-ask spread represents the reward for providing immediacy on the PLB (Harris 2003). An immediacy demanding trader therefore values a smaller bid-ask spread to a larger one, while dealers or market makers value a larger bid-ask spread as it will maximize profits.
Depth measures the order volume at all price levels. In terms of provision of liquidity, depth
is an important feature. When the depth level of the PLB is large, it is considered to enhance liquidity. Harris (2003) defines depth as “the quantity of shares that can be traded at a given cost of liquidity”. Another way to define it is by a PLB’s ability to handle larger market orders with little price impact.
Notable about depth is its relationship to tick sizes and institutional investors, which is dis-cussed further in section xx in regards to previous research findings. When the tick size is small, a trader placing a large order faces an increased exposure to the risk of other traders front-running them. Other traders might think that the trader possesses superior infor-mation, because of the large order, and will then attempt to “free-ride” on that information. With the tick size being small, other traders are able to place orders that are slightly higher at relatively low costs based on the price priority rule. If that is the case then it might diminish institutional investors incentive to place larger orders, thereby having a negative effect on depth (Harris 2003).
Breadth is defined as the how much volume is available at the best bid and ask price. A PLB
is considered to be broad when there is a large order volume at NBA and NBB. The rela-tionship between tick size and breadth can be closely linked to how the tick size effects bid-ask spread. The incentive to undercut the NBA or NBB is large when a small tick size is applied, which most often causes the new NBA or NBB to have a lower order volume than before. This could result in the liquidity provisions on the top of the book to diminish (Harris 2003).
Resiliency is the measurement of how quickly the PLB recovers from a shock on the market.
A resilient PLB will suffer less price discrepancies from trading, meaning changes in price would have little effect on trading volumes or order volumes (Johnson 2010).
Immediacy is the measurement of the time it takes to execute an order of a given size. When
7
feature is a useful parameter in regards to dealers markets as it is dependent on dealers and market makers to undertake the risk of the order before execution. Their willingness to do so contributes to the immediacy level of the PLB (Schwartz 1993).
This paper will use the first two features of the PLB to determine the provision of liquidity; width (bid-ask spread) and depth. These two measures are most commonly used in previous research papers when measuring liquidity. The breadth is at times held equally as important as width and depth, but due to a lack of resources this study will not incorporate this feature. Although a powerful tool in theory, resiliency is harder to define in practice. This is due to the uncertainty surrounding what constitutes a temporary or permanent imbalance caused by a particular event. immediacy is excluded in this study as it might be possibly unnecessary. Both depth and width (bid-ask spread) represents similar measurement in regards to handling different order sizes.
2.3 Stockholm Stock Exchange
The Stockholm Stock Exchange (SSE) is the primary securities market in Sweden. In 1998 the SSE merged with NASDAQ OMX and is today run as NASDAQ OMX Stockholm. As of the beginning of the 2000’s, the SSE had an electronic order-driven market which displays all bid and ask quotes from market participants, where market makers/dealers compete on equal terms with other market participant for liquidity. The benefit of this type of market is said to be its transparency, while its disadvantage is a lower degree of liquidity compared to a quote-driven market. In contrast, a quote driven market depends on market makers/dealers quoting bid and ask quotes, meaning that they can more easily manipulate the degree of liquidity on the market. (Harris, 2003)
The SSE consists of three market capitalization segments: Small Cap, Mid Cap, and Large Cap. The different segmentations are defined by their value of market capitalization. The Large Cap segment includes companies with a market capitalization equivalent to EUR 1 billion or more, the Mid Cap segment includes companies with a market capitalization of EUR 150 million or more, and the Small Cap segment includes companies worth a market capitalization of less than EUR 150 million. (NASDAQOMX Stockholm, 2015)
8 2.3.1 SSE Tick Size Structure
On the 25th of September, 2009, NASDAQ OMX Stockholm announced through an
Ex-change Notice that the FESE tick size table 2 would be introduced for all OMXS30 stocks as of 26th of October, 2009. As of October 2009, 43 Large Cap stock were incorporated in
the OMXS30 and were affected by the implementation of the new tick size regime. Approx-imately 8 months later, the same tick size table was implemented for the remaining 36 stocks in the Large Cap stocks segment. The decision to implement the tick size change was made in cooperation the Nordic Securities Dealers Association and the Association for Financial Markets in Europe, in an attempt to further harmonize tick sizes across Europe. The aim of the change was to lower the transaction costs of trades on the Nordic, while simultaneously increasing provisions of liquidity.
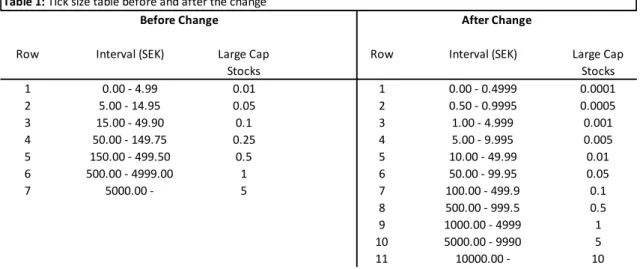
The tick size structure on the SSE for affected stocks directly before and after the imple-mentation of the FESE tick size table 2 is shown in table 1 below:
The changes affected a significant portion of Large Cap stocks on the SSE. Stocks in price interval 0.00 – 999.50 SEK experienced a reduction in tick size, as did all stocks in price interval 5000 – 9995 SEK. This means that a stock with a trade price between 100-149.75 SEK experienced a reduction in tick size from 0.25 to 0.1.
For the purpose of this study, theses tick size implementations will act as the event to study for a number of reasons. Firstly, the reasoning behind the implementation was highly related to changing the liquidity for a certain group of stocks. This is ideal for our study as it aims to study the change in liquidity, which makes this historical event highly relevant to use as an example. Secondly, the FESE tick size table 2 is the most recent guidelines for European
Table 1: Tick size table before and after the change
Row Interval (SEK) Row Interval (SEK)
1 0.00 - 4.99 0.01 1 0.00 - 0.4999 0.0001 2 5.00 - 14.95 0.05 2 0.50 - 0.9995 0.0005 3 15.00 - 49.90 0.1 3 1.00 - 4.999 0.001 4 50.00 - 149.75 0.25 4 5.00 - 9.995 0.005 5 150.00 - 499.50 0.5 5 10.00 - 49.99 0.01 6 500.00 - 4999.00 1 6 50.00 - 99.95 0.05 7 5000.00 - 5 7 100.00 - 499.9 0.1 8 500.00 - 999.5 0.5 9 1000.00 - 4999 1 10 5000.00 - 9990 5 11 10000.00 - 10
Before Change After Change
Large Cap Stocks
Large Cap Stocks
9
Exchanges and is therefore relevant to analyse in today’s regulatory debate. Finally, there is a benefit of analysing Large Cap stocks as they are in general more frequently traded then other stocks. This is beneficial when establishing a usable sample for this type of study. 2.4 Regulation Debate
The regulatory debate concerning market microstructure in recent years have focused on two things in recent years: how the general market quality can be improved and how the markets can attract more IPO’s. In this section, I take a closer look at how the tick size has been used in the past in an effort to improve market quality and how the tick size might play a part in attracting IPO’s.
Over the last two decades there has been an international trend of tick size reduction. The starting point of which can be traced back to the United States equity market in 1997, with the enactment of Security and Exchange Commission’s Order Handling Rule (OHR). This effectively lowered the tick size from 1/8th to 1/16th of a dollar. In the years following, a
series of regulatory changes were made until finally reaching “Decimalization” in 2001. Dec-imalization, or a one-penny increment, is the most recent change in tick size on the US equity market making today’s quotation increment in National Market System (NMS) stocks $.01 for prices over $1.00 and $.0001 for prices less than $1.00. The same trend could be seen on European equity markets as well, with markets reaching decimalization in 2004. (SEC, Report to Congress on Decimalization, 2012)
Researchers have raised concerns on the effect that these changes have had on the market quality. One of many examples is Jones and Lipson (2001) who studied the effects that tick size reduction had on the U.S. capital markets and found that these regulatory changes de-creased provisions of liquidity for small cap stocks. Still today’s findings this is of grave con-cern for regulators. The signing of the JOBS Act in 2012 highlighted the importance of the issue through its indication of a link between the lowering of tick size for small cap stocks and the number of small cap IPO’s on the U.S. capital market. Section 106(b) of the JOBS Act required the SEC to put together an “IPO task force” with the main purpose of “exam-ining the effects of decimalization on initial public offerings (IPOs) and small and middle capitalization companies”. In their report they conclude that the market structure changes associated with decimalization favour short-term trading strategies over long-term funda-mental strategies. For small cap stocks with lower liquidity, the lack of fundafunda-mental strategies
10
results in trading volume that is too low “to make money for the investment bank’s trading desk.” (SEC, Report to Congress on Decimalization, 2012)
On the European markets, the Federation of European Securities Exchanges (FESE) have conducted similar studies through their appointment of a European IPO Task Force which released their final report the 24th of March 2015. In the report they encourage the FESE to
develop a pilot project to test the effects of the current tick size regime for small cap stocks. (EU, IPO REPORT, 2015)
The main concern regarding tick sizes for the FESE in recent years have been the harmoni-zation of the tick size regime across exchanges in Europe. Since March 2009, the FESE has been negotiating with exchanges such as the SSE to improve the general market quality across Europe. When the tick size regimes are different for trading venues, there is a stronger incentive to undercut each other in terms of tick sizes. This could potentially lead to “exces-sively reduced tick sizes in the market … can have a detrimental effect to market depth (i.e. to liquidity)”. (FESE tick size regime, 2015). As a result, the SSE implemented the FESE tick size table 2 which shared in the views of the FESE and of which this study concerns.
11
3 Literature Review
The theoretical literature on tick size is fairly limited and usually focuses on one of two things; how a tick size change effects the market quality and how it effects market makers' profits. The relevant literature concerning this study will mostly consist of papers investigating the effects on market quality, seeing that the provisions of liquidity is an important determinant of the market quality. Due to the fairly limited amount of research on this matter, most previous studies that mostly concern the North American markets have been conducted on markets larger than the SSE. Following the tick size reduction trend on the North American markets in the 1990’s, researchers found a growing interest for the tick size effect on market quality. One of the most quoted authors on the subject is Lawrence Harris (1994) who, with his studies on the Toronto Stock Exchange (TSE), contributed to an increased awareness on the matter.
Out of the previous literature, this study’s main concern will be regarding literature on the features of liquidity used; Width, Depth, Trade Volume. The following sub-sections will con-sist of previous findings on these features following a tick size reduction.
In line with Niemeyer and Sandås (1994) research, this paper recognizes that although pre-vious studies are critical in performing a study of this sort, most of them are conducted on markets with a different market structure than that of the SSE. North American markets such as the New York Stock Exchange (NYSE) and NASDAQ are today considered to be hybrid markets, meaning a combination of both an order driven market and a quote driven dealers market. In contrast, the SSE is an electronic order-driven market with its main dif-ference being the influence of market makers / dealers. Furthermore, while the SSE’s tick size regime is different depending on stock segmentation, North American markets have a uniform tick size regime consisting of two different tick sizes.
3.1 Bid-Ask Spread
Capital markets and its participants have been concerned with the bid-ask spread ever since Amihud and Mendelson (1986) concluded that it is directly related to the cost of capital for market participants. It is the main reason for why capital markets have reduced the tick size since the 1990’s. Harris (1991,1994) predicted that following a tick size reduction the bid-ask spread would decrease, effectively lowering transaction costs for market participants.
12
After the tick size reduction on the TSE, from $0.125 to $0.05 for stocks priced $5 or higher, Harris (1997) found his predictions to be true. His findings showed a decline in bid-ask spread from 2 to 5 cents for effected stocks. Following his research a string of re-searchers published papers investigating the effects of tick size reductions on different North American markets. Goldstein and Kavajecz (2000) found that the bid-ask spread decreased following a tick size reduction on the NYSE. The same findings were made by Ronen and Weaver (1998) on the AMEX and by Jones and Lipson (2001) on the
NASDAQ.
Following the decimalization in the U.S., Bessembinder (2003) studied the effects it had on the bid-ask spread on the NYSE and NASDAQ for the different stock segmentations; Small Cap, Mid Cap, and Large Cap. By comparing the level of bid-ask spread prior to post decimalization he found that mid cap and Large Cap stocks experienced a significant de-crease in the bid-ask spread. As for small cap stocks he was unable to find any statistical significant change in the bid-ask spread.
Previous research has consistently found a positive relationship between the bid-ask spread and the tick size, and many have shown that the significance of this relationship depends on stock characteristics. Research by both Porter and Weaver (1997) and Goldstein and Kavajecz (2000) found that the effect of a tick size reduction, in terms of bid-ask spread, was greater for low priced and low trading volume stocks.
3.2 Depth
In line with the relationship found between the bid-ask spread and the tick size, the major-ity of studies on the matter also found a positive relationship between the level of depth of the PLB and the tick size. Research papers by Harris (1994), Jones and Lipson (2001), and Goldstein and Kavajecz (2000) all found that the decrease of bid-ask spread was, on aver-age, accompanied by a decrease in depth following a tick size reduction. For studies like these that were conducted on North American markets, there seems to be strong evidence that depth decreases along with a tick size reduction. Bacidore (2003) found that traders duced their order size and cancelled their orders more frequently following the tick size re-duction on the NYSE in 2000. In the conclusion of his findings he suggests that the low-ered level of depth causes problems for institutional investors who trade in larger order sizes. This claim is consistent with studies by Jones and Lipson (2001) and Goldstein
13
(2000) who both concluded that institutional trading costs increase due to the decrease in depth.
However, some studies conducted outside of North America presented a different picture. Chan and Hwang (2001) concluded that depth had increased when the tick size was re-duced on the Hong Kong stock exchange. Their explanation to the difference between their study and other studies was that the Hong Kong Stock Exchange (HKSE) has a dif-ferent market structure then the North American studies. The HKSE, like the SSE, is a pure limit order market and not a hybrid market, where market makers have a much greater presence.
3.3 Volume Traded
Previous studies have shown mixed results regarding the relationship between trading vol-ume and the tick size. Harris (1994) anticipated an increase in trading activity on the NYSE following a tick size reduction, due to the effectively lowered transaction cost, and therefore suggesting a negative relationship between the two. Despite the two markets having different structures, similar evidence was also found by Niemeyer and Sandås (1994) when examining the SSE. This negative relationship was confirmed through Bes-sembinder’s (2000) research on the NASDAQ following the series of tick size reductions on the U.S. markets.
In contrast to previously mentioned studies, other research papers have found no significant change in volume traded following a tick size reduction. Ahn, Cai, Chan, Hamao (2001) found no change in volume traded following the tick size reduction on the Tokyo Stock Exchange in 1998. Neither did Bacidore (1997) when investigating the TSE following their switch to decimal trading in 1996.
14
4 Method
This section discusses how the empirical work has been carried out, including the processes of data mining and methodology.
4.1 Data Collection
The primary data collected to conduct this study was gathered from OMX NASDAQ which compiles all the necessary data from the SSE. This study used daily average historical data in the form of bid price, ask price, closing price, displayed volume, and trading volume to create an estimation of provisions of liquidity, much in the same manner as conducted in previous research. In order to measure relative depth, I gathered annual reports to determine shares outstanding for corresponding event periods.
4.1.1 Time Frame
The time frame in which this study will concern is prior and after the implementation of the FESE tick size table 2 on the SSE on two event dates; October 26 2009 and June 7 in 2010. This study will focus on two event dates (October 26 2009 and June 7 in 2010) in which stocks will be analysed prior to and post the implementation of the FESE tick size table 2. The time horizons for the “pre- and post-event periods” differ in regards to the event date;
Event 1 is on the 26th of October, 2009. The pre-event period is from 14-09-2009
to 16-10-2009, and the post-event period is from 02-11-2009 to 07-12-2009.
Event 2 is on the 7th of June, 2010. The pre-event period is from 26-04-2010 to
28-05-2010, and the post-event period is from 14-06-2010 to 19-07-2010.
The time frames for the two events are two equally long time periods prior and post the tick size changes, excluding a short period surround the event date. This is done to avoid any unusual trading behaviour surrounding the event date. The two time frames consist of a 35 day period respectively and with 7 day distance from the actual event day. This is done to replicate the study conducted by Porter & Weaver (1997) and their applied time frame as much as possible. The data gathered and analysed during this time frame will act as the pri-mary data for the estimation of possible changes on provisions of liquidity.
15 4.1.2 Stock Selection
Between the two event dates, 79 Large Cap stocks received a new tick size. 43 of those stocks received a new tick size on October 26, 2009 and the remaining 36 received a new tick size on June 7, 2010. In order to study the effect of the new tick size table, the stocks were divided into two groups: a test group and a control group. The test group consists of stocks that experienced a tick size reduction on the event date, and the control group which consists of the stocks that did not. All stocks included in this study are Large Cap stocks of the NASDAQ OMX Stockholm which allowed me to better compare the two groups. By con-sequence, the stocks that are included in the test group when analysing the first event will then act as part of the control group in the second event. For example, Electrolux B share will be included in the test group for the 2009 event study and will be included the control group in the 2010 event study. Moreover, not all Large Cap stocks in the SSE were incorpo-rated in this study. Only stocks that fulfilled the following two requirements were included in the testing and analysis:
1. The stock had to experience at least one transaction every day during the time hori-zon to be included in the sample. A stock that did not meet this condition was clas-sified as too illiquid for useful contribution to the study.
2. The stock that had been recently listed or delisted surrounding the event date was not included in the sample simply because it lacked the data needed to form applied time frames.
As a result, the sample for the event study that took place in 2009 (2010) had a test group of 38 (30) stocks and a control group of 31 (37) stocks. A complete list of stocks included in the study for the different groups can be seen in table 2 in the appendix. All of the used stocks in the study had a price lower than SEK 990, meaning that the tick size change was effectively a tick size reduction and will therefor henceforth be referred to as such.
4.1.3 Stock Categorization
To perform the analysis, all stocks within the sample were placed into two separate categories with each category dividing all stocks into two separate groups. Firstly, stocks were catego-rised by price and then divided into high price and low price groups which was determined by the median price of the sample group period prior to the tick size reduction. Secondly, the stocks were categorised by trading volume and then divided into high trading volume
16
and low trading volume stocks which was determined in the same manner as the first cate-gory. This was done in order to analyse whether differences in stock characteristics reacted differently to the tick size reduction.
4.2 Methodology
The literature surrounding market microstructure uses a variety of different methods to measure liquidity. This paper will address this issue by using different methods of measure-ments that were commonly used in previous research. As a result, this study utilized differ-ent methods most commonly used in previous research. As stated in previous sections, this study used methods to investigate possible changes on the bid-ask spread and depth fol-lowing the tick size change. In addition, this study also investigated possible changes in trading volume to act as a complementary factor to better understand changes in provi-sions of liquidity.
To check for statistical significance in the results, a Wilcoxon Rank Sum Test was carried out to better reflect the effects the tick size reduction had on the selected features of liquidity. An alternative way of checking this would have been through the use of a t-test. However, this paper did not present such a test as a t-test assumes normality.
4.2.1 Bid-Ask Spread
The quoted bid-ask spread, along with the effective bid-ask spread, are the two most com-monly used measurements in past research. However, due to the availability of data, this study utilized the quoted bid-ask spread, sometimes called the dollar spread, in its analysis. The definition of the quoted bid-ask spread is the same as the definition of the bid-ask spread throughout the paper. It is simply the difference between the NBA and the NBB on the PLB. In terms of liquidity, Porter & Weaver (1997) used the quoted bid-ask spread to express the features immediacy and width. It is with the use of the same method that this paper accounts for those features. The method consists of two definitions of the quoted bid-ask spread: absolute spread and relative spread.
The absolute spread measures the spread in terms of SEK: Absolute Spread = NBA − NBB
17
The relative spread is the absolute spread divided by the midpoint of the NBA and NBB prices, expressed as basis points:
Relative Spread = [(NBA − NBB) (NBA + NBB2 )
] ∗ 10000
4.2.2 Depth
The measurement of depth, like the bid-ask spread, is measured in absolute and relative terms. This paper adapted the quoted depth of the order book to estimate these measure-ments. Another common way of estimating the depth is through the use of a cumulative depth, as can be found in Goldstein & Kavajecz research (2000). However, due to the lack of data needed to use the cumulative depth, a similar approach as the bid-ask spread was applied.
The absolute depth is defined as the total volume of ask side and total volume of bid side on the PLB, i.e. total volume of the PLB:
Absolute Depth = Ask Volume + Bid Volume
The relative depth is a basis point value defined as the absolute depth divided by outstanding shares. The use of the static figure outstanding shares is to give an idea of what proportion is available:
Relative Depth = [ (Ask Volume + Bid Volume)
Number of Outstanding Shares] ∗ 10000 4.2.3 Trading Volume
Although this measurement was used in the simplest way possible, its value should not be diminished. The traded volume is the number of shares that have been bought and sold within a specific time period. When comparing the before and after values of this measure it gives a simple indicator to interpret changes in provisions of liquidity. This is an indicator that is frequently used in research as well as by exchanges. Its undeniable importance is high-lighted by OMX NASDAQ when they define liquidity on the market as being “characterized by high turnover, or a high level of trading activity, in a company’s share”, on their company website.
18 4.2.4 Wilcoxon Signed-Rank Test
The Wilcoxon Signed-Rank Test addressed the question of how features of liquidity have been affected by the tick size reduction. The purpose of the test is to see if there was any significant difference in means from the before and after period of the tick size reduction. The test is a non-parametric statistical hypothesis test used when comparing two related or matched samples to assess if their means rank differently. It is commonly used as an alterna-tive to the paired t-test when the population is not a normal distribution. (Aczel and Sounder-pandian, 2009)
The hypotheses that were tested were:
H0: No significant change occurred after the event date. H1: A significant change occurred after the event date.
With the help of the Z value that this test produced, I was able to determine the p-value which then determined whether there had been a significant change in my confidence level. This study used a 95% confidence level when using the Wilcoxon Signed-Ranked Test, mean-ing that the p-value needed to be smaller than 0.05 to be able to reject the null hypothesis. To run this test, I used the software program SAS, which is a well-recognized statistical soft-ware program used by professionals.
4.3 Hypotheses
The three hypotheses that are tested using the Wilcoxon Signed-Rank Test are tested on both event dates in which the tick size reductions occurred and on all used measurements of the features of liquidity.
4.3.1 Hypothesis 1: Bid-Ask Spread
Based on the findings made by previous studies, the bid-ask spread for the test groups are expected to decrease following the tick size reduction on both events. As addressed in sec-tion 3.1, all previous studies have found a positive relasec-tionship between the tick size and bid-ask spread. Hence the hypothesis for the measures of bid-ask spread for both events is: H1: The bid-ask spread decreased following the event date for tick size reduction.
19 4.3.2 Hypothesis 2: Depth
The majority of previous studies considered in this study experienced a decrease in depth following a tick size reduction, seen in section 3.2. However, the one study that experi-enced an increase in depth was conducted on a market with a similar structure as the SSE. Regardless, this study expects the level of depth to decrease. Hence the second hy-pothesis of this study is defined as:
H2: The level of depth decreased following the event date for the tick size reduction.
4.2.3 Hypothesis 3: Trade Volume
Based on the previous research in section 3.3, the trade volume for the test groups are ex-pected to increase following the tick size reduction for both events. The third hypothesis of the study is therefore defined as:
20
5 Empirical Findings & Discussion
This section presents the overall results of this thesis based on the methods presented in section 4. An in-depth interpretation of the findings is made in the following sub-sections.
In
order to evaluate the impact of the FESE tick size table 2, on the bid-ask spread, depth, and trade volume, the study compares the percentage change in stocks for each variable before and after the tick size reduction. To determine whether or not the provisions of li-quidity experienced a change, the study analyses the changes in the features of lili-quidity in the test group and the control group for both events. The measured change for the features of all groups have been tested for significance with a 95 % confidence level, using the Wilcoxon Signed-Rank test.The overall finding from the study was that the bid-ask spread for both test groups experi-enced a significant decrease following the corresponding event date, while both control groups experienced no significant change. Similar to results found in previous studies, these results suggest a positive relationship between the bid-ask spread and the tick size. The change in depth following the event date suggests that the tick size reduction had no effect on the test group compared to the corresponding control group. This means that either the level of depth for these stocks are unaffected by a tick size reduction, or that the method used to analyse the data is unable to suggest any relationship. If the former is true, then a possible explanation could be that the Large Cap stocks PLBs were relatively deep by nature and that an increased risk of being undercut does not diminish investors' incentives to post limit order. The trade volume on the other hand saw a difference in significance between the test groups and control groups following both event dates. When these finding are ana-lysed together with the average change data, pairwise between the test group and correspond-ing control group, it suggests that the trade volume( i.e. tradcorrespond-ing activity) had been better off for both test groups following the tick size reductions.
This suggest that the overall provisions of liquidity have increased for the Large Cap stocks on the SSE following the implementation of the FESE tick size table 2. This interpretation of the results is done under the assumption that the level of depth for the test group did not change when compared to the control group. Investors will therefore not experience an in-creased price risk, but rather experience a lowered transaction cost on a market segment that
21
now sees a higher price matching rate. Both small and large investors benefit from this envi-ronment and, therefore, effectively suggests that their incentive to invest increases.
5.1 Bid-ask Spread
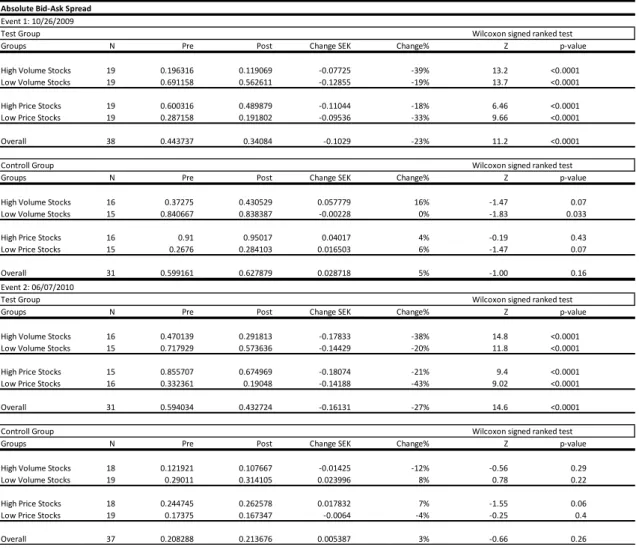
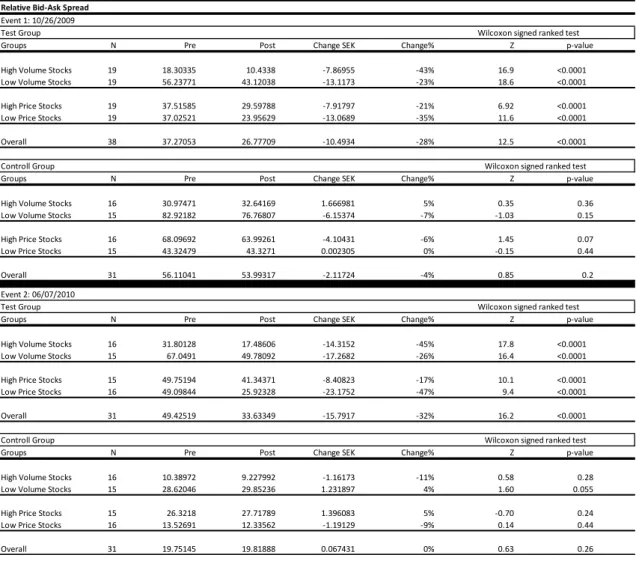
The results of the analysis indicate that the bid-ask spread decreased overall following the implementation of the FESE tick size table 2 for affected stocks. For both the events taking place on October 26, 2009, and June 7, 2010, all categories of stocks experienced a significant 10% decrease or larger. The H1 hypothesis was proven to be true for both events and when comparing these results to its respective control group’s results, it is implied that both tick size reductions had effectively lowered the bid-ask spread. This is consistent with previous studies such as Harris (19977) or Bessimbinder(2003). What stands out in both events is that the categories of stocks that react the strongest to the tick size reduction is the High traded stocks and the low priced stocks, this again is consistent with previous literature. The findings of the bid-ask spread are presented in table 3-4 in the appendix.
5.1.1 Event 1: 2009 – 26 – 10
As shown in table xx, the two measures for bid-ask spread both decreased following the tick size reduction. The overall percentage change of the stocks affected by the tick size reduction was a -23% (-28%) decrease in the absolute bid-ask spread (relative bid-ask spread). When categorised by trade volume activity, High Trade Volume stocks reacted the strongest with a -39% (-43%) decrease in the absolute bid-ask spread (Relative bid-ask spread), while Low Trade Volume Stocks experienced a smaller decrease of -19% (-23%) in absolute bid-ask spread (relative bid-ask spread). When categorized by price, Low Price Stocks experienced a greater decrease in bid-ask spread than the High Price Stocks, with a -33% (-35%) change in absolute bid-ask spread (Relative bid-ask spread) versus a -18% (-21%) change in absolute bid-ask spread (Relative bid-ask spread), respectively. According to the Wilcoxon signed rank test, all of the results for the test group are significant at a 95% confidence level so I am, therefore, able to accept the H1 hypothesis that the bid-ask spread decreased following the event date.
When comparing the results of the test group and the control group, it can be assumed that the implementation of the FESE tick size table 2 had a significant effect on the bid-ask spread. As can be seen in table xx in the appendix, the bid-ask spread in the control group showed little change in 2009, with an overall change of 5% (-4%) in the absolute bid-ask
22
spread (relative bid-ask spread). Moreover, the change in the bid-ask spread across stock categories in the control group was equally as small, averaging a meagre 6.5%. The small, and at times non-existent, variations in the bid-ask spread across the different stock categories suggests that the changes in the control group are statistically non-significant. When exam-ining the changes in the bid-ask spread of the control group with the changes in the bid-ask spread of the test group it suggest that the tick size reduction has effectively reduced the bid-ask spread.
5.1.2 Event 2: 2010 – 7 – 6
In 2010, the overall change in bid-ask spread for stocks affected by the tick size reduction was -27% (-32%) in absolute bid-ask spread (relative bid-ask spread). When categorised by trade volume activity, High Trade Volume stocks reacted with a -38% (-34%) decrease in the absolute bid-ask spread (relative bid-ask spread). Low Trade Volume Stocks experienced a smaller decrease of -20% when comparing absolute bid-ask spreads, but had a larger per-centage decrease (-37%) when comparing relative bid-ask spreads. When the affected stocks were categorized by price, the High Price Stocks experienced a greater decrease in bid-ask spread than the Low Price stocks, with a change of -21% (-27%) versus a -43% (-47%) change in absolute bid-ask spread (relative bid-ask spread) for Low Price stocks. As in Event 1, these changes proved statistically significant and I therefore accept the H1 hypothesis that both measures of bid-ask spread decrease following the implementation of the FESE tick size table 2.
By comparing the results of the test group to the control group, one can be assumed that the reduction in tick size had a direct effect on the bid-ask spread. Table xx in the appendix shows how the stocks that were not affected by the tick size reduction had an overall change of 3% (0%) in absolute bid-ask spread (relative bid-ask spread). Furthermore, the change in the bid-ask spread across the different stock categories in the control group was also small, with the largest percentage change totalling -12% (-11%) in absolute bid-ask spread (relative bid-ask spread) for High Trade Volume stocks. The overall change and the changes in the bid-ask spread for the different categorised stocks are small and at times non-existent, sug-gesting statistical non significance within the control group. When examining the changes in the bid-ask spread of the control group with the changes in the bid-ask spread of the test group it suggest that the tick size reduction has effectively reduced the bid-ask spread.
23 5.2 Depth
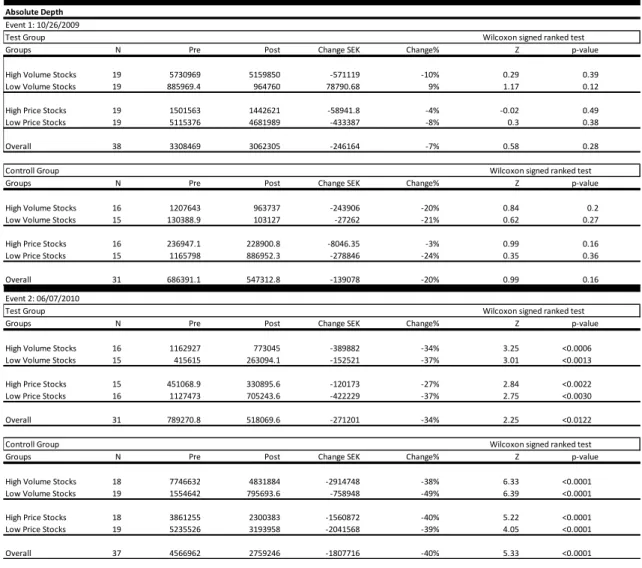
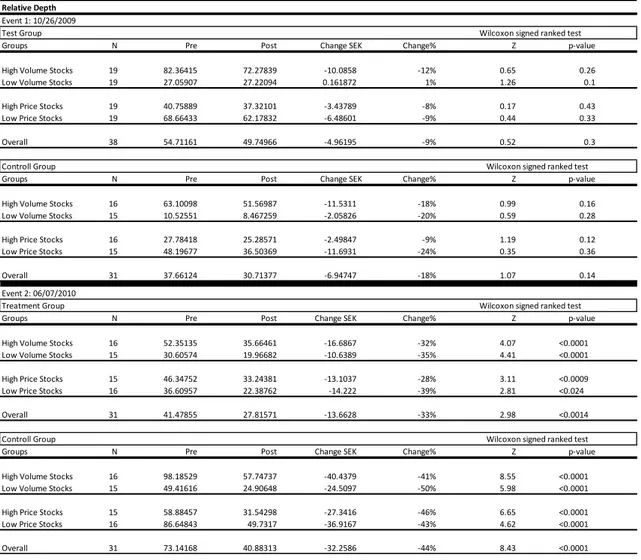
The results of the analysis indicate that depth was less consistently impacted by the imple-mentation of the FESE tick size table 2 on the affected stocks. Depending on how the stocks were categorized, depth saw both non-significant negative and positive percentage changes for the event that took place on October 26, 2009. In contrast, all categories of stocks in the test group experienced a significant decrease in depth (> -20%) following the event on June 7, 2010. The H2 hypothesis was in event 1 accepted and in event two rejected. When com-paring these finding to respective control groups, the results suggest that the tick size reduc-tions had not effected depth in any significant way. This because the control groups experi-enced the same non-significance or significance as corresponding test group. Which suggests that the level of depth for the test groups did not change because of the tick size reduction. These findings are inconsistent with any of the previous studies considered. The findings of depth are presented in tables xx-xx.
5.2.1 Event 1: 2009 – 26 – 10
As shown in table xx, depth demonstrated an overall decreased following the tick size reduc-tion. The overall change for the test group affected by the implementation of the FESE tick size table 2 in 2009 was -7% (-9%) in absolute depth (relative depth). When categorised by trade volume activity, High Trade Volume stocks experienced a decrease of -10% (-12%) in absolute depth (relative depth), while Low Trade Volume Stocks experienced an increase of 9% (1%) in absolute depth (relative depth). When the affected stocks were categorized by price, the High Price Stocks experience a greater decrease in depth than the Low Price stocks, with a -4% (-9%) change in absolute depth (relative depth) versus a -8% (-9%) change in absolute depth (relative depth) , respectively. However, these results showed no statistical significance when using the Wilcoxon test and therefore I reject the H2 hypothesis that the depth decreases following the event date.
As can be seen in table xx in the appendix the control group had a larger decrease in depth across all categorised stock groups, with an overall change of -20% (-18%) in Absolute depth (Relative depth). However, the Wilcoxon test shows that these changes, although large, are
24
not statistically significant. Therefore, I cannot with a 95% confidence level see that the con-trol group experienced any change in depth following the implementation of the FESE tick size table 2 compared to the control group.
These results indicate that there is no statistical difference in significance between in the test group and the control group, therefore suggesting that the tick size reduction did not signif-icantly affect depth in either group.
5.2.2 Event 2: 2010 – 7 – 6
In 2010, the overall change in depth for stocks affected by the tick size reduction was -34% (-33%) when measured in absolute depth (relative depth). When categorised by trade volume activity, Low Trade Volume Stocks experienced a -37% (-35%) decrease in absolute depth (relative depth) compared to High Trade Volume stocks which experienced a -34% (-32%) decrease in absolute depth (relative depth). When the affected stocks were categorized by price, Low Price Stocks experienced a greater decrease in depth than High Price stocks with a decrease of -37% (-39%) versus a -27% (-28%) change in absolute depth (relative depth). These results are considered significant at a 95% confidence level. Therefore, I accept the H2 hypothesis that depth changes following the tick size reduction.
As can be seen in table xx in the appendix the control group had a larger decrease in depth across all categorised stock groups, with an overall change of -40% (-44%) in Absolute depth (Relative depth). However, the decrease in depth for the control group is also regarded as statistically significant and I cannot with certainty prove that the tick size reduction have affected the outcome.
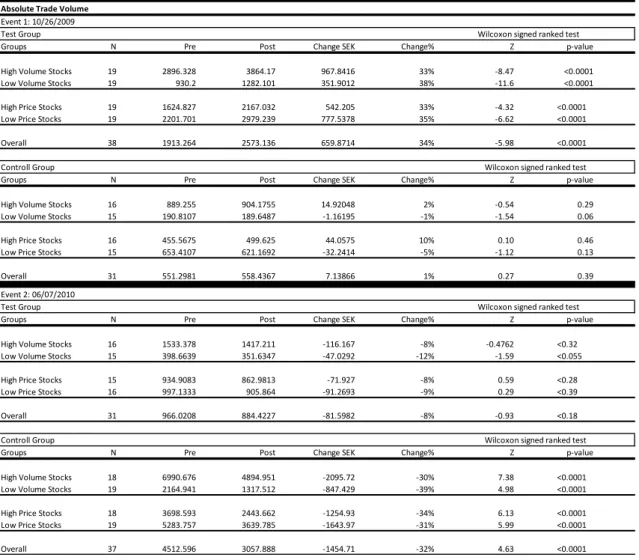
5.3 Absolute Trading Volume
The analysis results indicate that trade volume significantly increased following the imple-mentation of the FESE tick size table 2 for affected stocks on October 26, 2009. However, the trade volume change following the implementation of the tick size table on June 7, 2010, proved to be non-significant. When these findings are compared to its respective control group findings, the results suggest that the change in trade volume for the test group have been consistently better off. The H3 hypothesis is in the event 1 accepted and in event 2 rejected. When comparing these results to the corresponding control groups it suggests that
25
there is a difference between them, in regards to significance and average change, for both events. The test groups averages either increased more or decreased less than their corre-sponding control group following the tick size reduction. This suggests that the tick size reduction had a positive effect on trade volume across all different categorised stock groups. This is consistent with previous studies findings, such as Niemeyer and Sandås (1994) and Bessimbinder (2000). The findings of absolute trade volume are presented in tables xx-xx. 5.3.1 Event 1: 2009 – 26 – 10
In 2009, trading volume increased significantly following the tick size reduction. The overall change for stocks affected by the tick size reduction was 34% in absolute trade volume. When categorised by trade volume activity, High Trade Volume stocks experienced an in-crease of 33% in absolute trade volume, while Low Trade Volume Stocks experienced an increase of 38% in absolute trade volume. When the affected stocks were categorized by price, the Low Price Stocks experienced a greater increase in trade volume than the High Price stocks, with a 35% change in absolute trade volume versus a 33% change in absolute trade volume, respectively. These results are consistently significant at 95% confidence level when performing the Wilcoxon test. Hence, I accept the H3 hypothesis that trade volume increases following the implementation of the FESE tick size table 2.
Comparing trade volume results of the test group and control group, it can be assumed that the reduction in tick size had a direct effect on the trade volume. Table xx in the appendix shows that stocks across all categorise in the control group had an overall change of only 1% in absolute trade volume. According to the Wilcoxon Test, these results proved statistically non-significant. These findings suggest that the implementation of the FESE tick size table 2 in 2009 increased trade volume for the stocks that were affected by it.
5.3.2 Event 2: 2010 – 7 – 6
In 2010, the overall change in trade volume for stocks affected by the tick size reduction was -8% when measured in absolute trading volume. When categorised by trade volume activity, High Trade Volume stocks experienced a -8% decrease in Absolute trade volume while Low Trade Volume Stocks experienced -12% decrease in Absolute trade volume. When catego-rized by price, Low Price Stocks experienced a -9% decrease in depth while High Price stocks decrease by -8%. All of the changes are statistically insignificant with a p-value greater than
26
0.05. I therefore reject the H3 hypothesis that trade volume increases following the imple-mentation of the FESE tick size table 2.
Comparing the results from the test group to the results from the control group, it can be assumed that the reduction in tick size had an effect on the trading volume in 2010. Table xx in the appendix shows how the stocks in the control group had an overall change of -32% in absolute trading volume. This change is larger than the change experienced by affected stocks in 2010. Furthermore, The Wilcoxon Test proves that the change values across all categories presented in table 7 are all statistically significant. The comparison therefore sug-gests that the tick size reduction might have had an effect on trade volume in 2010.
27
6 Concluding Remarks
On the 26th of October 2009, the FESE tick size table 2 was implemented on the SSE for 36
Large Cap stocks and again on the 7th of June 2010 for the remaining 45 Large Cap stocks.
This study investigated the effects of these two events in terms of provision of liquidity for the stocks that were affected by the reduction in tick size. The study investigated the effects of the tick size reduction on the provisions of liquidity for the two separate events. By meas-uring and analysing the three commonly used features of liquidity; bid-ask spread, depth, and trade volume, this study suggests that, overall, the provisions of liquidity increased due to the implementation of the FESE tick size table 2.
As concluded in previous studies, I found that there was a significant decrease in the bid-ask spread following the new and reduced tick size for both event dates. The two groups of stocks that experienced the largest decrease in its bid-ask spread were those categorised under High Trade Volume stocks and Low Price stocks. These findings are consistent with findings made by Porter and Weaver (1997). However, this study was unable to find any significant effect on depth that could be associated with the implementation of the FESE tick size table, as previous studies have shown when the tick size is reduced. In contrast, the affected stocks were relatively better off in both events in regards to trade volume following the tick size reduction
The tick size reduction ultimately lowered the bid-ask spread which effectively lowered the execution costs of trading while keeping the level of depth unchanged. Furthermore, the lower trading costs increased trade volume, which also implies a higher degree of price matching. This change in liquidity benefits both small and large investors and effectively suggests that their incentive to invest increases.
However, the conclusion of this study should only be viewed as an indication or suggestion to how Large Cap stocks reacted to the FESE tick size table 2 as opposed to fact. Due to the methods limitations, the study cannot be certain that the observed changes in the features of liquidity were affected by the tick size change or if an external event is the underlying cause of the results. Hence, in the next section I will address how the study might be im-proved to address this issue.
28
7
Future Research
In order to further investigate the effect that the FESE tick size table had on Large Cap stocks, I suggest that future studies incorporate more features of liquidity, particularly breadth. This feature has been proven by many researchers to be an important feature for a proper liquidity assessment, and one that this study unfortunately lacks due to the availability of data. In addition, future studies on the matter should eliminate possible external factors that effect changes in the features of liquidity to increase the level of certainty of the results. Finally, the effect that such a tick size change has on different types of investors is something of high interest today, particularly larger institutional investors. My suggestion would be to investigate the relationship between tick size changes and levels of IPO’s, with the link being institutional investors.
29
List of Reference
Aczel, A.D., & and Sounderpandian, J. (2009). Nonparametric Methods and Chi-Square Tests. (Eds.7). Complete Business Statistics (p. 639-642). New York: McGraw-Hill Higher Edu-cation.
Ahn, H. Cai, J. Chan, K. Hamao, Y. (2007), Tick size change and liquidity provision on the Tokyo Stock Exchange. J. Japanese Int. Economies, 21, 173-194.
Amihud, Y. and Mendelson, H. (1986). Asset Pricing and the Bid-Ask Spread. Journal of
Fi-nancial Economics, 19, 223-250.
Angel, J. (2012). Tick size regulation: costs, benefits and risks, EIA7. Retrieved in March 2015. From https://www.gov.uk/government/uploads/system/uploads/attach-ment_data/file/289037/12-1068-eia7-tick-size-regulation-costs-benefits.pdf
Bacidore, J. (1997). The impact of decimalization on market quality, Journal of Financial
Inter-mediation, 6, 92–120.
Bacidore, J. Battalio. and R. Jennings. (2003). Order Submission Strategies, Liquidity Supply, and Trading in Pennies on the New York Stock Exchange. Journal of Financial Markets, 6, 337-362.
Bessembinder, H. (2000). Tick Size, Spreads, and Liquidity: An Analysis of Nasdaq Securities Trading Near Ten Dollars, Journal of Financial Intermediation, , 9, 213-239.
Bessembinder, H. (2003). Trade Execution Costs and Market Quality after Decimalization,
Journal of Financial and Quantitative Analysis, 38, 747-777.
Cordella, T. and Foucault, T. (1999). Minimum Price Varietions, Time Priority, and Quote Dynamics. Journal of Financial Intermediation, 4, 141-173.
Demsetz, H. (1968). The cost of Transacting, Quarterly Journal of Economics, 82, 33-53.
Goldstein, M.A. and Kavajecz, K.A. (2000). Eights. Sixteenths and Market Depth: Changes in Tick Size and Liquidity Provision on the NYSE. Journal of Financial Markets, 56, 125-149. Harris, L. (1998). Predicting Contemporary Volume with Historic Volume at Differential Price Levels--Evidence Supporting the Disposition Effect: Discussion. Journal of Finance, 43, 698-99.
30
Harris, L. (1990). Liquidity. Trading Rules. and Electronic Trading Systems. New York
Uni-versity Salomon Center. Monograph Series in Finance and Economics.
Harris, L. (1997). “Decimalization: A Review of the Arguments and Evidence,” University of Southern California Working paper.
Harris, L. (1991) Stock Price Clustering and Discreteness”. The Review of Financial Studies, 4 , 389-415.
Harris, L. (1996). Does a Large Minimum Price Variation Encourage Order Exposure?. New
York Stock Exchange Working paper, Volume 96, Issue 5.
Harris, L. (1990) Estimation of Stock Price Variances and Serial Covariances from Discrete Observations. Journal of Financial and Quantitative Analysis. 25, 291-306.
Harris, L. (2003), Trading and Exchanges: Market Microstructure for Practitioners. New York: Ox-ford University Press, Inc.
Johnson, B. (2010) . Algorithmic Trading & DMA: An introduction to direct access trading strategies. London: 4Myeloma Press.
Jones, C.M. and Lipson M.L. (2001). Sixteenths : Direct Evidence on Institutional Execution Costs. Journal of Financial Economics. 59, 253-278.
FESE. (2015, March 23). EU, IPO REPORT. Retrieved April 20, 2015. From
http://www.fese.eu/images/documents/speeches-reports/2015/Final_re-port_IPO_Task_Force_20150323.pdf
FESE. (2015). FESE tick size regime. Retrieved April 20, 2015. From http://www.fese.eu/tick-size-regimes
Niemeyer. J. and Sandås. P. (1994). Tick Size, Market Liquidity and Trading Volume: Evi-dence from the Stockholm Stock Exchange. Stockholm School of Economics. Working Paper. NASDAQOMX Stockholm. (2015, March 09). Market Model Nasdaq Nordic INET Nordic. Retrieved April 27, 2015. From http://www.nasdaqomx.com/digi-talAssets/97/97551_nasdaq-omx-nordic-market-model-2015_03.pdf
Porter, D.C. and Weaver, D.G. (1997) Tick Size and Market Quality. Financial Management, 26, 5-26.
31
Ronen, T. and Weaver, D.G. (1998). The Effect of Tick Size on Volatility, Trader Behavior, and Market Quality, Rutgers Univesity, Working Paper.
Schwartz, R. (1993). Reshaping the Equity Markets – A Guide for the 1990s. New York: Richard D Irwin
Seppi, D.J.(1997). Liquidity provision with limit orders and a strategic specialist. Review of
Financial Studies, 10, 103-150.
SEC. (2012, July). Report to Congress on Decimalization, As Required by Section 106 of the Jumpstart Our Business Startups Act. Retrieved January 10, 2015. From
Appendix
32
Appendix
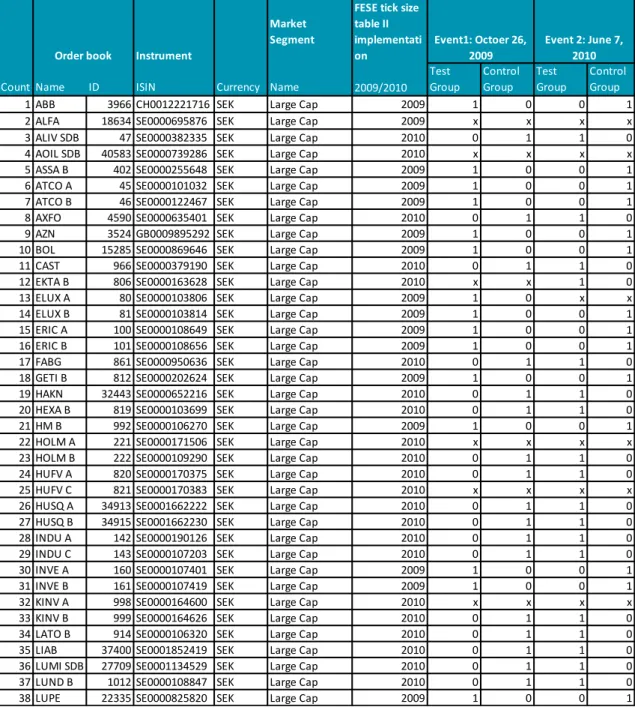
Table 2: Stock Selection
The table below displays what equity stocks that were incorporated in the different sample groups. The table stretches from page 31-32.
Table 2
Instrument
Market Segment
FESE tick size table II implementati on
Count Name ID ISIN Currency Name 2009/2010
Test Group Control Group Test Group Control Group
1 ABB 3966 CH0012221716 SEK Large Cap 2009 1 0 0 1
2 ALFA 18634 SE0000695876 SEK Large Cap 2009 x x x x
3 ALIV SDB 47 SE0000382335 SEK Large Cap 2010 0 1 1 0
4 AOIL SDB 40583 SE0000739286 SEK Large Cap 2010 x x x x
5 ASSA B 402 SE0000255648 SEK Large Cap 2009 1 0 0 1
6 ATCO A 45 SE0000101032 SEK Large Cap 2009 1 0 0 1
7 ATCO B 46 SE0000122467 SEK Large Cap 2009 1 0 0 1
8 AXFO 4590 SE0000635401 SEK Large Cap 2010 0 1 1 0
9 AZN 3524 GB0009895292 SEK Large Cap 2009 1 0 0 1
10 BOL 15285 SE0000869646 SEK Large Cap 2009 1 0 0 1
11 CAST 966 SE0000379190 SEK Large Cap 2010 0 1 1 0
12 EKTA B 806 SE0000163628 SEK Large Cap 2010 x x 1 0
13 ELUX A 80 SE0000103806 SEK Large Cap 2009 1 0 x x
14 ELUX B 81 SE0000103814 SEK Large Cap 2009 1 0 0 1
15 ERIC A 100 SE0000108649 SEK Large Cap 2009 1 0 0 1
16 ERIC B 101 SE0000108656 SEK Large Cap 2009 1 0 0 1
17 FABG 861 SE0000950636 SEK Large Cap 2010 0 1 1 0
18 GETI B 812 SE0000202624 SEK Large Cap 2009 1 0 0 1
19 HAKN 32443 SE0000652216 SEK Large Cap 2010 0 1 1 0
20 HEXA B 819 SE0000103699 SEK Large Cap 2010 0 1 1 0
21 HM B 992 SE0000106270 SEK Large Cap 2009 1 0 0 1
22 HOLM A 221 SE0000171506 SEK Large Cap 2010 x x x x
23 HOLM B 222 SE0000109290 SEK Large Cap 2010 0 1 1 0
24 HUFV A 820 SE0000170375 SEK Large Cap 2010 0 1 1 0
25 HUFV C 821 SE0000170383 SEK Large Cap 2010 x x x x
26 HUSQ A 34913 SE0001662222 SEK Large Cap 2010 0 1 1 0
27 HUSQ B 34915 SE0001662230 SEK Large Cap 2010 0 1 1 0
28 INDU A 142 SE0000190126 SEK Large Cap 2010 0 1 1 0
29 INDU C 143 SE0000107203 SEK Large Cap 2010 0 1 1 0
30 INVE A 160 SE0000107401 SEK Large Cap 2009 1 0 0 1
31 INVE B 161 SE0000107419 SEK Large Cap 2009 1 0 0 1
32 KINV A 998 SE0000164600 SEK Large Cap 2010 x x x x
33 KINV B 999 SE0000164626 SEK Large Cap 2010 0 1 1 0
34 LATO B 914 SE0000106320 SEK Large Cap 2010 0 1 1 0
35 LIAB 37400 SE0001852419 SEK Large Cap 2010 0 1 1 0
36 LUMI SDB 27709 SE0001134529 SEK Large Cap 2010 0 1 1 0
37 LUND B 1012 SE0000108847 SEK Large Cap 2010 0 1 1 0
38 LUPE 22335 SE0000825820 SEK Large Cap 2009 1 0 0 1
Event1: Octoer 26, 2009
Event 2: June 7, 2010 Order book