Author: Robert Westerlund Examiner: Björn Lisper
Date: 2014-07-02 (yyyy-mm-dd)
A tool to facilitate interactive and
collaborative learning of execution flow
and code for novice computer science
students
Contents
Abstract ... 4 1 Introduction ... 4 1.1 Method ... 5 2 Background ... 6 2.1 Engagement Taxonomies ... 6 2.2 Prior Work ... 72.2.1 Online Python Tutor ... 7
2.2.2 Dynalab ... 7
3 Interviews ... 7
3.1 Interview Stage 1 – Identifying Problems and Gathering Requirements ... 8
4 Application Overview ... 9
4.1 The First Tool Design – A Flow Chart Programming Environment ... 10
4.2 The Second Tool Design – Visualizing Execution History ... 10
4.3 Goals for the Visualization Tool ... 10
4.4 Why a Web Application ... 11
4.5 Process Flow for the CT4PL Pages ... 11
4.5.1 The Trace View Page ... 11
4.5.2 The Code Input Page ... 12
5 Graphical Design ... 13
5.1 The Code View Page ... 13
5.1.1 The Code Window ... 14
5.1.2 The Output Window... 14
5.2 The Trace View Page ... 15
5.2.1 The Code Window ... 17
5.2.2 The Console Window ... 18
5.2.3 The Trace Window ... 19
5.2.4 The Locals Window ... 27
5.2.5 The Watch Window... 28
6 Technical Design ... 29
6.1 System Parts Run on the Server ... 29
6.2 System Parts Run on the Client ... 30
6.3 The Semantic Tree ... 30
6.4 The Code Parser Interface ... 30
6.6 The Execution Model ... 31
6.7 The Framework Specific Implementations ... 32
6.8 The Code View Generator ... 32
6.9 The Trace View Generator ... 33
7 Tool Analysis ... 33
7.1 Interview Stage 2 – Feedback and Thoughts on the Interactive Prototype ... 34
7.2 CT4PL – Classification into Engagement Taxonomies ... 35
7.2.1 Classification According to the Extended Engagement Taxonomy ... 35
7.2.2 Classification According to the 2DET ... 35
8 Discussion ... 36
8.1 Method Evaluation... 36
8.2 Suggestions for Future Development ... 37
4
Abstract
Some students reading courses in introductory imperative programming at university level struggle with the course and the drop-out rates from the courses are rather high. One possible reason for this is that some find programming hard to learn. There are many tools which aim to help students learn programming by visualizing the state and execution of code. However, most, if not all, of these tools visualize only the current state of the program being visualized.
The first and foremost result of this project is a look into a way to approach visualizing historic information about previous program states in a program visualization tool, in addition to visualizing the current state. The project also created the Code Tracer for Programming Learners (CT4PL) tool which was used during the project to test, evaluate and communicate around the visualization design.
This report describes the reasoning behind and the design of the CT4PL tool, which tries to extend the common approach to program visualization tools by not only visualizing the current state of the program being visualized, but also provide the learner with an historic trace of the whole program execution.
1 Introduction
The drop-out rates for university programs related to computer science are rather high and a lot of students do not complete their introductory programming course1. Reasons for not completing such a course may of course vary, but one possible reason2 might be if a student finds that programming is not something for him or her; either because the student did not find programming fun or that the student finds programming hard to learn.
There are many software tools which tries to help students who find learning programming is hard; online course material, games which aim to teach programming, program visualization tools and many more. Most of these tools try to help the student by making the learning experience fun and/or a more active experience and studies indicate that the tools might have at least some positive effect on the learning experience (see, for example, Sorva, Lönnberg, & Malmi, 2013b; Hundhausen, Douglas, & Stasko, 2002).
Among the program visualization tools are a class of tools which are commonly referred to as visual debuggers. These work similarly to the debugger tools which can be found in many modern
development environments, with the addition that they try to create some form of visualization of the state of the program being visualized. However, they generally only visualize the current state of the program with the current state of the data the program holds in memory.
This report has the hypothesis that a visualization tool which not only shows the current state of the program but also displays state changes in a historic manner could be beneficial to students reading their first introductory imperative programming course. The aim of the report is therefore to design and prototype one approach to visualizing historic state during program execution in a visual
debugger, with the hope that future studies might include such a visualization approach in studies of the pedagogic effects of visualization tools.
1 The project has not been able to obtain formal statistics supporting this claim, but interviews and conversations with teachers in these programs supports the claim.
5
Section 2, which describes some of the current research in the field, and Section 3, which describes the results of the first interview phase, provide the basis for many of the design decisions made during the project, as well as the initial requirements for the tool.
The next section, Section 4, contains an overview of CT4PL, the tool created as part of the project, the requirements identified for the tool as well as an explanation for some of the choices made during the project.
Since the graphical design, the actual visualization, of the tool is more important than the technical design, Section 5 contains a description on the graphical design and is followed by Section 6 which describes the technical design of the CT4PL tool.
Section 7 analyses the CT4PL tool to see how close to the initial goals the design and tool is and also describes the second interview phase, which tried to evaluate the design and obtain feedback from students.
The final section, Section 8, is a discussion around the information gathering methods used, as well as the applicability of the results. The section finally presents some suggestions on future
development for the CT4PL tool.
1.1 Method
After the initial literary study, which aimed to find current research in the area of program visualization and the effect of program visualization in computer science education, an interview phase was started.
The goal of the first interview phase was to try to find problem areas which students face during their first programming course on the university. Through a university in Sweden, the project got in contact with one teacher, whom taught introductory programming courses, and two students whom, at the time of the interviews, attended their second year of computer science studies. The results of the literary study and the first interview phase together formed the basis for the requirements of the tool.
After these requirements were identified, work begin with creating a graphical design for the visualizations and then an interaction design. These were initially created as rudimentary drawings on paper. Some of these paper drawings were converted to digital form by drawing them again in drawing tools, but this was quickly abandoned. The digital drawings were abandoned in order to instead create an interactive prototype, which displayed the graphical design and interaction design, but which was not a fully functional implementation3.
The interactive prototype was used during the second interview phase, with the goal to gather feedback on the visualization design. The second interview phase was designed as an observational study together with a group interview, which provided a lot of good feedback on the tool, which led to some revisions in the design and the implementation, the final result of which is described in this report.
3 The initial interactive prototype could, for example only visualize a specific code example and not code written by the student.
6
2 Background
The field of computing education has had a lot of recent research, some of it relevant and related to the area of computing education and, more specifically, usage of program visualization in computing education. Most of this research seem to be in line with the pedagogic theory that an active learner has a higher retention potential and/or learning pace than a non-active learner.
A multi-national study performed by Lister et al. (2004) indicate that many students have problems reading and tracing code. The study also claim that experienced programmers frequently draw diagrams or make annotations while trying to understand code execution and that students whom scored better on the tests performed in the study had made trace-like annotations (depicting state changes) while trying to understand the code.
Many visualization tools try to help the learner read and/or trace code. The understanding of the visualization and the learners perception of what is being visualized is highly important to the learning process. While a visualization system can be very beneficial for a learner with a good understanding of what a visualization system visualizes and how it relates to the Program code, a poor understanding can render the visualization system less beneficial or even detrimental to the process of learning programming (Sorva et al., 2013b).
In a meta-study of several studies on the effectiveness of algorithm visualization (Hundhausen et al., 2002), the researches came to a conclusion which is line with the pedagogic theories of cognitive constructivism; that is, learners found benefit in the use of algorithm visualization in the way the visualization let the learner actively engage with the algorithm and through this construct their own subjective understanding of the algorithm.
Hundhausen et al. (2002) also states that how the learner is engaged by the visualization tool is more important than the quality of the visualization, even if a well-designed visualization tool can contribute further to learning.
2.1 Engagement Taxonomies
Based on the theory that the engagement of the learner is very important to the effectiveness of Algorithm Visualization (AV) software, Naps et al. (2002) proposed an Engagement Taxonomy (ET) in which each category presumes the lower categories. The categories proposed in the ET are No Viewing, Viewing, Responding, Changing, Constructing and Presenting. Naps et al. even goes further stating that “Our thesis is that visualization technology, no matter how well it is designed, is of little educational value unless it engages learners in an active learning activity” (Naps, et al., 2002, p. 132). To broaden the ET to be effective for categorization of Program Visualization tool (PV), as compared to algorithm visualization tools4, as well as to include the value of collaboration in a learning process, Myller, Bednarik, Sutinen & Ben-Ari (2009) proposed an extension of the ET, the Extended
Engagement Taxonomy (EET). The EET added a few new categories as well as changed the
definitions of a few of the existing ET categories. The categories proposed in the EET are No Viewing, Viewing, Controlled Viewing, Entering Input, Responding, Changing, Modifying, Constructing,
Presenting and Reviewing. Though Myller et al. (2009) provides little support for the EET as compared to the ET, it adds a higher focus on collaborative processes.
4 The definition of algorithm visualization and program visualization used in this report is the following. While an algorithm visualization tool aims to visualize one or more specific algorithms (e.g. bubble sort) on a higher level, a program visualization tool aims to visualize a program, generally at a lower level and often with a visualization which is closely related to the source code of the program.
7
The 2DET used by Sorva, Karavirta & Malmi (2013a) to classify several AV and PV tools separates the categories related to direct engagement from categories related to content ownership. Content ownership was not part of the ET while the EET contains categories which relate to content ownership. However, since the EET is one dimensional higher levels of content ownership automatically presumes higher levels of engagement. The 2DET holds these two types of categorization apart and instead proposes a separate categorization for engagement level and content ownership (see also (Sorva, 2012) for a more thorough explanation of the 2DET and the reasoning behind the separation). The engagement level categories proposed by the 2DET are No Viewing, Viewing, Controlled Viewing, Responding, Applying, Presenting and Creating, while the content ownership categories are Given Content, Own Cases, Modified Content and Own Content.
2.2 Prior Work
There are many PV systems available for learners and teachers to use. None of these show any representation of the statement execution history5, but rather focus on the current state of the Program begin visualized. The work done by Sorva et al. (2013a) can be used for a larger review on many such systems.
When designing the tool presented in this report, the following existing systems, among others, have had at least some influence on the design of the CT4PL tool.
2.2.1 Online Python Tutor
The Online Python Tutor (Guo, 2013) is a web-based PV application. Given some python code, the server pre-calculates the state of the program after each statement. Since the Online Python Tutor (OPT) pre-calculates this on the server, only non-interactive program flows are supported (i.e. no input from the user). The OPT also supports embedding the visualization of a program on another site, which has been used to embed visualizations in online digital computer science books. The user interface of the OPT consists mainly of three different parts; the code which is being executed, a visualization of the stack frames which show the state of the application and finally an output area which displays the text from print statements.
2.2.2 Dynalab
The work on the Dynalab program animation software (Birch, et al., 1995) discuss the functionality of stepping backward in execution, in addition to forward stepping, saying that students found this functionality very helpful. The backward-stepping functionality helped the students since “Confusing portions of the program can be reviewed repeatedly, reversing through read statements allows different inputs to be tried for effect, and error situations can be backed out of to see what caused the problem” (Birch, et al., 1995, p. 31).
3 Interviews
The project has, during two stages of the project, conducted interviews to gather information in order to create a tool which can better solve the problems students and teachers encounter during introductory programming courses.
The first interview stage, which was performed as individual interviews of one computer science teacher, whom teaches introductory programming courses, and two second year computer science
8
students, focused on finding some of the problem areas which students face and to find requirements for the tool.
The second interview stage, which was performed as a group observational interview study with two second year computer science students, focused on letting the students use an interactive prototype of the tool and providing feedback. The second interview phase and its results are described in Section 7.1, Interview Stage 2 – Feedback and Thoughts on the Interactive Prototype.
These studies were not made to create any predictive data but to gather interpreted information regarding the retrospectively expressed experiences of the interviewed persons. The results of the studies were of great help during the thesis, and furthered the author’s understanding of some potential experiences of introductory programming courses and problematic areas experienced during such courses.
3.1 Interview Stage 1 – Identifying Problems and Gathering Requirements
The interviews of each person interviewed was conducted as individual interviews scheduled on separate days, starting with the Teacher followed by Student A and then Student B. Before the interview, the person being interviewed were assured their participation will be anonymous and that they can, at any moment during the interview, say that they do not want to continue, without needing to provide any reason for this.
The interview guides used during the interviews differed for the teacher (see Appendix A - Interview Guide for Interview with the Teacher) and the students (see Appendix B - Interview Guide for Interview with students) and the sound was recorded during the interviews.
The amount of students whom drop out from introductory programming classes is, according to the Teacher, hard to get an exact number for, since it depends very much on how drop-out is defined and which students should be counted as actually attending the course. However, the Teacher still mentioned a very large drop-out rate. The students did not know how many students actually passed the course, since the course was both on-campus and for remote students, but they did state that they had spoken to a lot of students who had not successfully completed the course one
semester after they had attended the course.
In lectures, the Teacher did not frequently use visualizations other than code with output-statements. Neither during assignments did the course include usage of any visualization tool. However, on more than one occasion, the Teacher had received e-mail messages from students suggesting usage of a program visualization tool, which would indicate that at least some students actively request such tools.
During the interview, the Teacher mentioned that students frequently have problems understanding recursion. One example of a problematic area with recursion is in creating an understanding that the variables created through parameter passing are unique for each function call. This means that if a function calls itself, the students frequently believe that the variables which change in the inner function execution will also be changed when the execution comes back to the outer function execution.
Many languages have value types (passed by copying the value) and reference types (passed by copying the pointer). The Teacher discussed this as another problematic area for many students, that two different variables can be a reference to the same place in memory, making changes to either variable value visible on the other variable.
9
A third common problem area for students which the Teacher discussed was object orientation. However, classes in introductory imperative programming rarely work extensively with object oriented programming, focusing more on the imperative parts to begin with.
Neither of the students had seen a lot of visualizations during their first programming course. Student A could only remember code output being used during lectures and Student B could only remember a single static flow chart which the teacher had discussed briefly during one lecture. One of the students, however, mentioned that the student did attend another course at the same time as the introductory programming course, a course related to object oriented analysis and design, in which the teacher did show some visualizations. The student did not, however, mention this course when answering questions about which programming related courses the student had attended.
Student A and Student B both had previous experience of basic programming, from before the first programming course at the university. Student A especially, mentioned that there was mainly one assignment which had been a problem. The approach Student A used to solve the problem was to change minor things and observe the change in the output.
Both Student A and Student B described following the logical flow and finding logical errors as being one of their larger problems during the course. Student A was very clear on this, explaining that the compiler can show compilation errors but it does not show logical errors. Student A also described that a tool which could more clearly show the steps which are performed and why it performs the steps it does (e.g. which branches in if-statements the Program chooses and why) would likely be very helpful, since this is what students needs to learn to do internally.
Regarding the other students, Students B briefly discussed that the students without previous programming experience struggled greatly, often with following the logical flow of the code they had written.
Student B also mentioned that the syntax of the language could sometimes be a problem and wanted further help from the development environment in finding solutions to syntax errors. However, their teacher had not presented any information about which help the development environment could give, nor pointed to any resources containing such information, something that Student B would have wanted.
4 Application Overview
Two main tool designs were worked on as part of this project.
The first design was a flow chart programming environment. This design was abandoned after the first interview phase, since the interviews seemed to suggest that this was not what neither the Teacher nor the students wanted.
The second tool design, which is the output of this project, focused on visualizing the execution history as well as the current state of the application. This seemed more in line with what would have helped the students during their first course in imperative programming at university level. The CT4PL tool, which was created as part of this project, is a working early stage implementation of the second design. The only language which is currently supported by the CT4PL tool is C#, but adding support for Python is planned.
10
The current version has not been given a semantic versioning number, but it could be considered being in alpha stage. It is working well (though it has some known bugs), but support for some common language constructs, e.g. for-statements and some binary operators, still need to be added, and more framework methods need to be implemented (see Section 6.5, The Code Parser
Implementation, and Section 6.7 The Framework Specific Implementations for more information about these parts of the application).
4.1 The First Tool Design – A Flow Chart Programming Environment
The first visualization imagined for the project was to separate learning of the programming language syntax from learning to think about program execution flow. On possible way to achieve this would be to have the learner create the application in a graphical flow chart editor. The learner would then think about execution flow instead of the syntax of the code. To allow learning code through this, it would be beneficial if such an application would generate code and let the learner see the code generated for each part of the flow chart, tying together the two concepts.
However, even if this could let the learner focus on the program flow instead of the syntax, it would create another syntax for the user to learn, albeit a graphical syntax. Additionally, it could raise the risk to end up in a situation where the learner would feel that the visualization is not relevant for learning to code (compare e.g. Sorva, et al., 2013b).
4.2 The Second Tool Design – Visualizing Execution History
During the interviews (see Section 3.1 Interview Stage 1 – Identifying Problems and Gathering Requirements) it became clear that both interviewed students had found problems in trying to follow the execution of programs.
The annotations classified as Trace and Synchronized Trace, which were the more successful annotations described in Lister et al. (2004), could be interpreted as an attempt to create the information necessary to follow the state changes while trying to understand the code, in order to use historic state to reason about future states.
The fact that the interviewed students had experienced problems following the execution of the code, together with the successful trace annotations mentioned above led to designing another visualization approach, one focusing more on trying to visualize the execution history of the application.
Most visual debuggers show the current state of the Program being visualized, but none6 visualize the history of the execution state. Most of these visual debuggers do a good job of showing to the user the current state of the Program and some let the user manually step forwards and backwards to try to understand how the Program came to that state. However, they do not, given a specific point in the execution of the Program, visualize to the user how the program execution came to that specific point.
4.3 Goals for the Visualization Tool
The information discussed above lead to trying to design a tool which could achieve the following:
Visualize execution history – To allow the learner to understand not only the current state of the Program, but also how the Program got to that state, we want the tool to be able to visualize the Program execution history.
11
Visualize recursion clearly – During the interview, the Teacher identified one problem area for students is to understand recursion and the state of variables during a recursive call.
Allow the User to step forward and backward in execution – The work behind Dynalab (Birch, et al., 1995) identified that students had great use of the step backward functionality as well as stepping forward.
Explorable – Should allow the user to click on most any element in the trace and view information about the execution of that element.
Allow interactive programs – At least one category in each engagement taxonomy mentioned previously in the report (Naps, et al., 2002; Myller, et al., 2009; Sorva, et al., 2013b) relates to working actively engage with the application, making it as interactive as possible is beneficial. At the very least, support interactive functionality, e.g. changing input in the Program, like the .NET command System.Console.ReadLine().
Support sharing code – Since a lot of programming courses these days are a mix of on-campus students and remote students, supporting sharing code is important.
Support asynchronous communication around visualized code – As part of sharing code, it can also be beneficial if the tool supports communication around the code, e.g. comments on specific points in the execution.
Be easily accessed – It should be easy to start using the visualization tool, so that installations or other similar processes do not become a hindrance to adoption
4.4 Why a Web Application
The university at which the interviews were held allows students to choose freely between using a Windows OS and a Linux OS. By making the visualization tool a web application the client only needs to support HTML, CSS and Javascript of at least semi-recent version, which most platforms support, making the tool platform agnostic.
The Online Python Tutor (Guo, 2013) has had great success in usage numbers. This is likely helped by the fact that it is very easily accessed by being a web application which doesn’t require any add-in installation. Not requiring any installation or user accounts in order to use the tool, the steps to try the tool is simply to navigate the browser to the specific URL, making the amount of work required to try the tool very small.
The Online Python Tutor (Guo, 2013) also supports embedding the visualization of a specific program into your own web page. This makes the visualizations easier to include in online course instructions and online manuals. By making the visualization tool a web application, the project opens up the possibility to add support for embedding visualizations later.
4.5 Process Flow for the CT4PL Pages
The application consists of two separate pages, the Trace View page and the Code Input page. The Trace View page is the page navigated to when the user wants to view the trace of a specific Program. The Code Input page is used to input and save new code for the visualization tool to visualize.
4.5.1 The Trace View Page
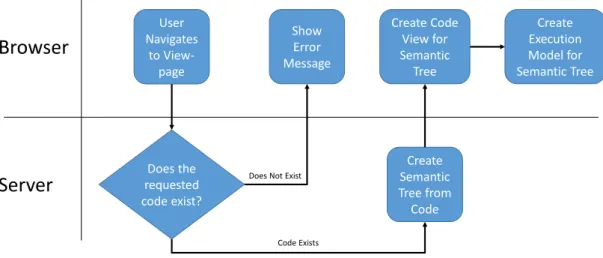
When the user wants to view the trace of an application the user will have a URL which points uniquely to that specific program (and when storing execution flow, state and comments have been supported, the URL will uniquely identify that program execution and comments). The process started when navigating to the Trace View page is depicted in Figure 1.
12
Browser
Server
User Navigates to View-page Does the requested code exist? Show Error Message Create Semantic Tree from Code Create Code View for Semantic Tree Create Execution Model for Semantic TreeDoes Not Exist
Code Exists
Figure 1 - Process for loading a stored Code entry in order to begin Tracing
When the user navigates to a Trace View URL, the browser sends a request to the server which will check if the requested code (based on the URL) exists or not. If the URL is incorrect an error message will be displayed.
If the URL is correct, the server will provide the client browser with a semantic tree representing the code. The client will then use that semantic tree to render a code view and an execution model for the Program. For more information about the technical aspects of these different parts, see Section 6 Technical Design.
4.5.2 The Code Input Page
To add new code for tracing the user navigates to the Code Input page. On this page, the user can enter code (and view any code compilation errors or code parse errors) which, if correct, will be stored on the server and a Trace View URL for the code will be generated.
Browser
Server
User enters Code User presses Start Trace Compile and/or Parse Code Did Compilation /Parsing find errors? Display Errors for User Create Semantic Tree Save Code on Server Redirect User to View-page Errors Found No ErrorsFigure 2 - Process for adding new Code for Tracing.
When the user has entered the code and pressed the Start Trace button the code is sent to the server. The server will compile (if it is a compiled language) and parse the code.
13
If there are compilation errors or the code uses some unsupported feature from the language (the tool will generally only support subsets of languages, see 6.5 The Code Parser Implementation for more details) the server returns information about the compilation error or the parse errors to the browser and the browser displays these to the user.
If the compilation and parse steps completes successfully, the server will store the correct code on the server and return a Trace View URL to the browser. The browser will then navigate to the Trace View URL for the given code.
5 Graphical Design
The focus on the graphical design was to try to be as easy to understand as possible, and also to provide help for users if there is something the user does not really understand. Therefore, most elements in the user interface is clickable to get additional information and/or help regarding that element.
All screenshots in the sections below are taken from the current, early, version of the CT4PL tool implementation, visualizing programs in the C# language.
5.1 The Code View Page
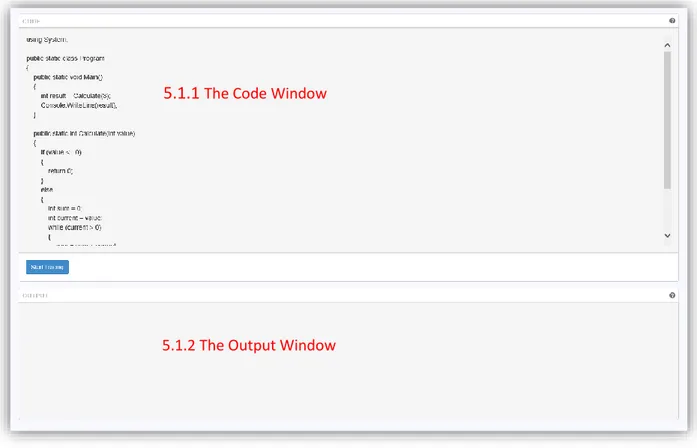
The Code View Page consists mainly of three different parts; the Code Window, the Output Window and the Start Tracing button. The user can also click on the headers on either Window (or on the help symbol on the upper right of the window) to get a short help description for the window.
Figure 3 - The Code View Page consists of two different windows, the Code Window and the Output Window, as well as the Start Tracing button.
5.1.1
The Code Window14
5.1.1 The Code Window
The Code Window lets the user to enter the code which he or she wants to trace. When the user is satisfied with entering code, the user clicks the Start Tracing button which sends the code to the server. If the server finds any compilation errors or parse errors with the code sent, these are displayed in the Output Window.
If the user click on the help symbol on the upper right (or any other part of the header) a small help window is displayed, explaining the usage of the window.
Figure 4 - Clicking on the help icon on the upper right of the Code Window displays a small help window explaining the usage of the Code Window.
5.1.2 The Output Window
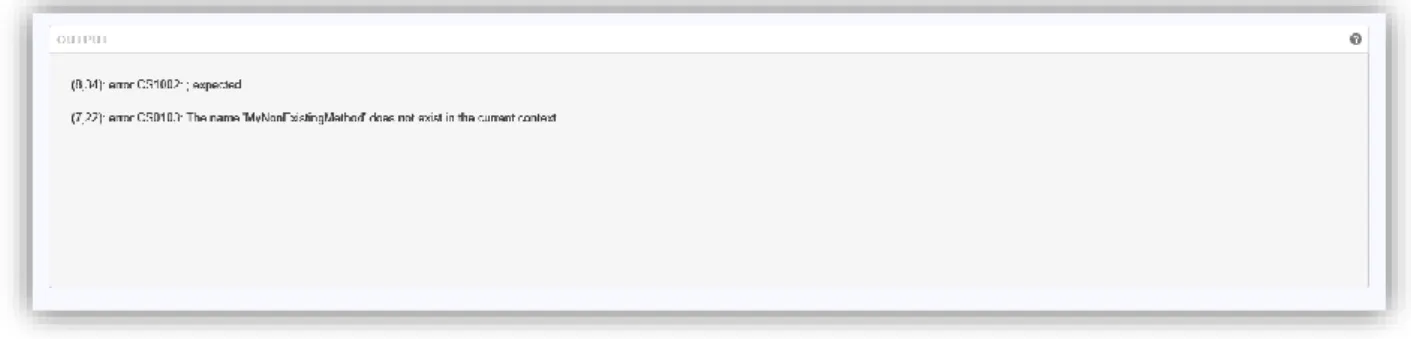
The Output Window displays information about compilation errors or parse errors, if the user enters code which has compilation errors and then clicks the Start Tracing button.
Compilation errors are only shown for compiled languages, e.g. C#, and describes the compilation error as well as the compilers suggestion on where the error was found. An example of a
compilation error can be seen in Figure 5 below.
Figure 5 - An example of the compilation errors shown for code missing a ";" character and calling a method which does not exist.
Even if the compilation is successful, there is a possibility that the code uses language features or framework methods which are not supported (read more about supported language features and framework methods in Section 6.5 The Code Parser Implementation and Section 6.7 The Framework
15
Specific Implementations respectively). In these cases, the parse error messages are displayed like displayed in Figure 6.
Figure 6 - Parse errors shown when using a type declaration which CT4PL does not support and a framework method which CT4PL does not support.
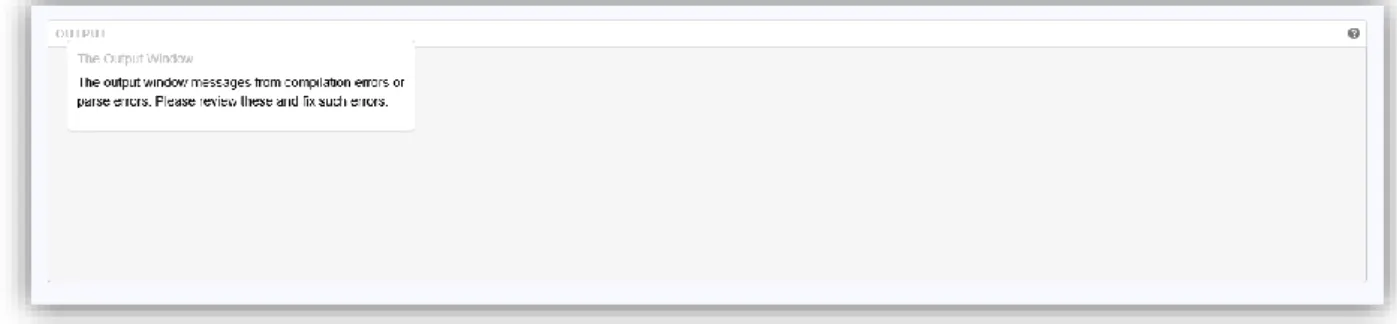
Clicking on the help icon on the top right (or any other part of the window header) will display a small help window explaining the usage of the Output Window.
Figure 7 - Clicking on the Output Window help icon opens a small help window describing the usage of the window.
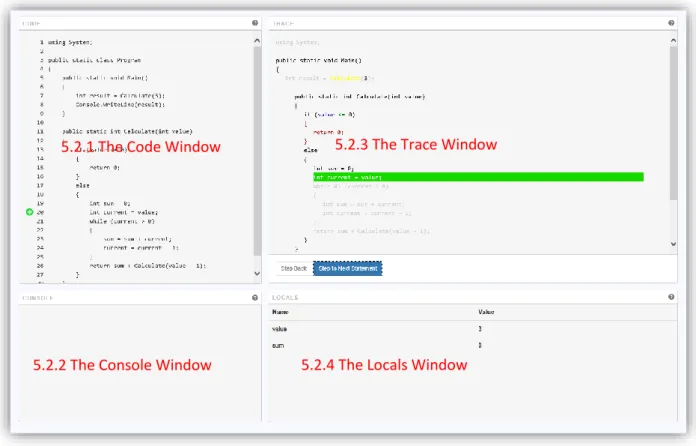
5.2 The Trace View Page
The trace view consists of five different windows. The first four of these are the Code Window, the Console Window, the Trace Window and the Locals Window. There is also an additional window, the Watch Window, which isn’t displayed unless the user has added a variable watch.
16
Figure 8 - The Trace View Page with no Watch Window
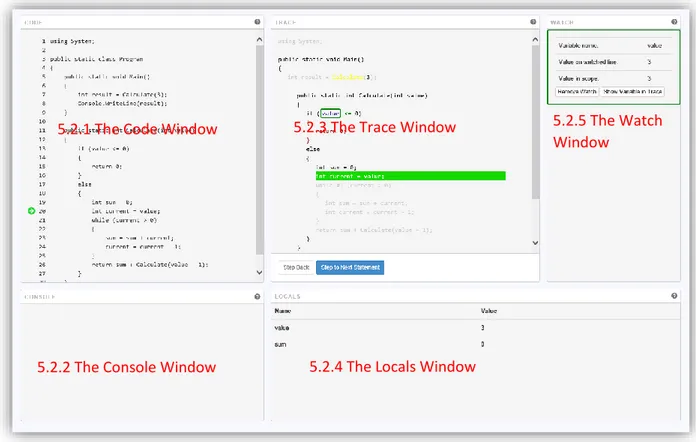
If the user adds a variable watch (see Section 5.2.3 The Trace Window for information on how to add a watch) the Watch window opens and the page looks similar to Figure 9.
5.2.1 The Code Window 5.2.3 The Trace Window
17
Figure 9 - Adding a variable watch opens the Watch Window
5.2.1 The Code Window
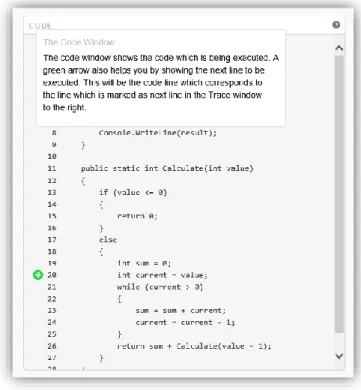
The Code Window shows the code which the user entered. However, the code here will be well formatted with brackets on new lines, each new level indented and one statement per line, even if the user did not input well formatted code.
As the user steps through the trace of the Program, the green arrow moves to indicate which line is the next line to execute. This will correspond to the line highlighted in green in the Trace Window. Clicking on the header or on the help icon on the top right opens a help window for the code window.
5.2.3 The Trace Window
5.2.4 The Locals Window
5.2.5 The Watch Window
5.2.2 The Console Window 5.2.1 The Code Window
18
Figure 10 - The Code Window with the help window opened.
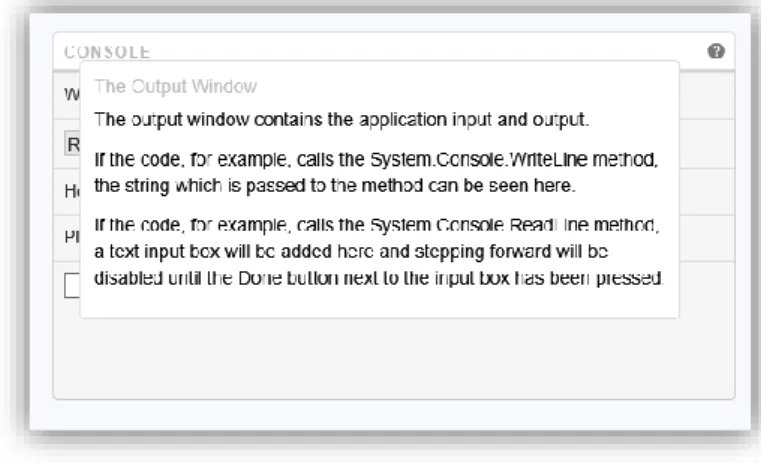
5.2.2 The Console Window
The Console Window handles input and output from the Program being run.
If, for example, the code contains a call to a framework method which prints text to the console, e.g. System.Console.WriteLine in a .NET language like C#, the text will be output in this window. If the code contains a call to a framework method which reads text from the console, e.g.
System.Console.ReadLine in a .NET language like C#, a textbox will open here and the focus will move to this textbox. Once the user has input the text and want to continue the execution, the textbox will be disabled.
Figure 11 - The Console Window handles output and user input for the program.
Clicking the header or the help icon on the top right corner of the window will open the help window for the Console Window.
19
Figure 12 - The Console Window with the help window opened.
5.2.3 The Trace Window
The Trace Window contains the history of the execution, and also the currently planned execution, for the Program. For more information about what is considered history of the execution and planned execution, see Section 6.6 The Execution Model.
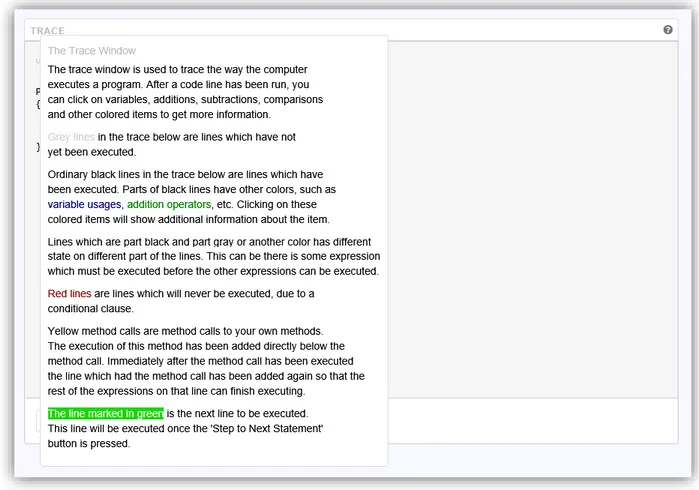
The Trace Window is the largest window on the CT4PL tool and contains many elements which the user can interact with. It also uses different colors to indicate the state of different entries. This is explained in the help window for the Trace Window, which is displayed if the user clicks the header or the help icon in the top right corner.
20
Figure 13 - The help window for the Trace Window explains the different colors used in the Trace Window and also informs the user that most code elements are clickable to get more information.
The aim is that everything on the Trace Window should be clickable to get more information about the element itself and also about the execution state of the element, e.g. clicking on a part of the code which reads the value of a variable should let the user know that the code reads the value of a variable and it should also let the user know whether that code has been evaluated yet and, if so, the value of the variable when it was read.
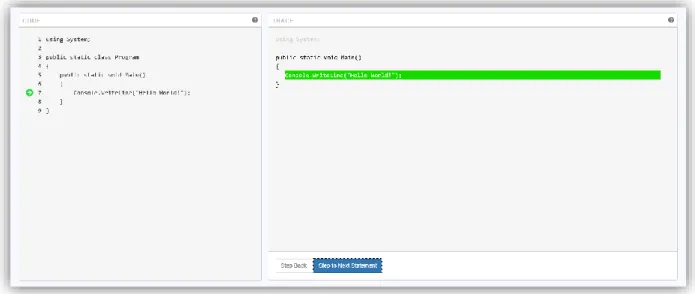
The line highlighted in green is the current line to be executed. This will match up with the line on the Code Window (see Section 5.2.1 The Code Window for more information about the Code Window), as can be seen on Figure 14.
21
Figure 14 - The next line to execute is indicated by a green arrow on the Code Window and the line is highlighted in green on the Trace Window.
There are many interactive parts in the Trace Window (and the number will likely increase) and only some of them will therefore be included in this document.
Figure 15 - Light gray text indicates code which has not been executed.
Lines with light gray text is part of the planned execution, but is code which have not yet been executed. When all the code on the line has been executed, the code will be black or another color. The color of the code is determined by what the code does, e.g. reading a variable value or
comparing two values; for information about colors used see the help text in Figure 13.
Figure 16 - When code has been executed it will change color to black or another color, depending on what the code does.
Clicking on code which reads the value of a variable shows additional information about that code entry. The information displayed also differs depending on whether the code line has been executed or not. Clicking on unexecuted code which reads a variable shows a window like the following:
22
Figure 17 - The window which is displayed if the users clicks on code which reads a variable but hasn't been executed yet.
Clicking on the same code entry after the code has been executed shows a slightly different window. In Figure 18, the execution has continued and changed the value of the variable current after it was read (from 3 to 1).
Figure 18 - The information displayed for code which reads a variable value, after the code has been executed.
When the variable has been read, the user can also click the Add Watch button, which adds a watch for the specified variable usage. More information about adding a Watch can be found in Section 5.2.5 The Watch Window.
Clicking on the + character (the addition sign) in the code above would yield information about the addition operator, such as which values were added and the result of the addition. The same goes for other similar operators like the subtraction operator and comparison operators (e.g. the “less than or equals” operator <=).
23
Figure 20 - The information displayed for an executed 'less than or equals' comparison operator.
If statements create branches in the code in which one branch is executed while the other is not. To indicate which branch is executed and which branch is not executed, the non-executed branch will be colored red while the other will use the default colors.
Figure 21 - Statements which will never be run, e.g. the else part of an if-statement where the condition evaluates to 'true', have a red color, to indicate that they will never be executed.
In order to constantly create and show execution history, it is important that the execution
constantly flows in one direction and never “jumps up” in the execution. Because of this statements which are iteration statements, e.g. while-statements, will be duplicated. This means that if the condition for a while statement is true, the Trace knows that the while statement body will be executed and then the condition will be evaluated again. Therefore the while statement is copied and placed immediately after the first while statement.
To indicate that the while statement is copied, the instances of the while statements are numbered, starting with #1 for the first instance and increasing with one for each instance of the same while-statement.
When the condition of the while-statement evaluates to false, the body of the while-statement is colored red (to indicate that it will never be executed) and no new instance of the while statement is added.
24
Figure 22 - A while statement which has the condition evaluated three times will be copied to three instances in the trace.
There are two types of method calls; framework method calls and custom method calls. Framework method calls are calls to methods which belong to the framework (read more about framework method calls in Section 6.7 The Framework Specific Implementations) while custom method calls are method calls to methods which is part of the user code.
Framework method calls are evaluated immediately and will not have any representation in the trace except for the code which calls the method.
Figure 23 - Supported framework method calls are evaluated immediately.
When the code calls a custom method, however, the method is added below the method call and the rest of the current function is moved below the inserted custom method. The code line which calls the method is copied and inserted below the custom method to let code on the same line which is executed after the custom method to execute.
25
Figure 24 - Code sample for calling a custom method with more code after the method execution completes.
When CT4PL has started execution of the GetNumber() custom method call, line number 8 will still be light gray, except for the parts of the line which has already executed, which will be their default color, and the method call itself, which will be colored yellow.
After the body of the custom method the line has been added again, to ensure that the second occurrence of the value variable can be evaluated.
Figure 25 - The custom method has been added on the line beneath the call to the custom method and the code line which called the custom method has been copied to below the custom method to allow continued evaluation.
26
Figure 26 - Clicking the yellow method call placeholder displays help information regarding why the method has been added below.
Once the method has finished execution, the execution through the trace will continue on the line below, allowing the rest of the line which called the method to execute.
When the line has finished execution it is clear which parts of the code line were evaluated before the custom method call, and which were evaluated after, by the light gray color of the code which was not executed, and also which method call was added (which is useful if the code calls the same method multiple times on the same line, e.g. GetNumber() + GetNumber()).
Figure 27 - Once the line containing a custom method call has finished executing, it is possible to see which parts of the code were executed before the method call and which parts were executed after, by looking at the colors on the code line before the custom method body.
If the user wants to know which line in the code a specific line in the trace is, the user can hover the mouse over the line in the trace and the corresponding line in the Code Window will be highlighted in yellow as can be seen in Figure 28.
27
Figure 28 - When hovering with the mouse over a code line in the Trace Window, the corresponding code line in the Code Window is highlighted.
5.2.4 The Locals Window
The Locals Window shows the variables which are currently in scope. Both the name of the variable and the value of the variable is displayed in the Locals Window. Since CT4PL currently does not support global variables, this window shows all the variables in the local scope.
Figure 29 - The Locals Windows shows variables and their values for the current stack frame.
Clicking on the header or on the help icon in the top right shows the help window for the Locals Window.
28
Figure 30 - The Locals Window with the help window open.
5.2.5 The Watch Window
The Watch Window allows the user to add a watch to a specific variable read usage. The watched variable will be framed with a colored border and a border of the same color will be added to the Watch for the variable.
The Watch Window can be useful for comparing the value of the same variable on different lines, by adding a Watch to the variable on each line of interest. The sample on Figure 31 has added two Watches to the same variable, but on different stages of execution, to compare the value of the variable on the different lines.
Figure 31 - Watches have been added to two different occasions of reading the 'value' variable, to make comparing the values of the two easier.
29
6 Technical Design
Technically, the system consists of several different parts. These different parts are depicted in Figure 32 below. The green rectangles in the picture are parts which are generically implemented and do not need specific implementations for new languages or frameworks. The blue rectangles are parts which are specific to a language or framework.
Semantic Tree
Code Parser Interface
Code Parser Implementation
Execution Model
Framework SpecificImplementations_
Code View
Generator
Trace View Generator
Figure 32 - High Level Technical Architecture - The green parts are generic while the blue parts will be implemented either per-language or per-runtime.
The tool runs on two different locations, the server which hosts the CT4PL server application and the browser on the client for the user whom uses CT4PL.
6.1 System Parts Run on the Server
The server is responsible for receiving code from the client (or reading previously stored code) and create the semantic tree for the code. If the code is not valid, either not accepted by the compiler (for compiled languages) or not accepted by the Parser (see Section 6.5 The Code Parser
Implementation for more information), error information is returned instead of the semantic tree. The reason to why the server is responsible for creating the semantic tree is that this allows the system to use the real language compilers if that is appropriate for a specific language (very few compilers are written in JavaScript and can run in the browser).
The server also stores the code which has been added to the Code Store (current implementation stores the code in JavaScript Object Notation (JSON)7 formatted files on the server), making it possible to generate a URL which can open a trace of that specific code every time a browser navigates to that URL.
30
This means that the server is partly or wholly responsible for the Code Parser Interface, the Code Parser Implementations and the Semantic Tree. The Code Parser Interface, as exposed by an
ASP.NET Web API8 REST9 endpoint (currently using a JSON format for communication), together with the Semantic Tree contracts, are the contracts between the server and the client implementations.
6.2 System Parts Run on the Client
The client in the case of the CT4PL tool is the browser. The client is wholly responsible for the Execution Model, the Framework Specific Implementations, the Code View Generator and the Trace View Generator. The client is also dependent on the Semantic Tree, which the Execution Model and the Code View Generator both use (see their respective sections below for more in-depth
explanations) and which is part of the contract for the communication with the server.
The client parts are written in JavaScript (and of course uses HTML and CSS for rendering) and also use the following third party libraries:
Angular – A JavaScript Single Page Application library, in this case used mainly for data-binding.
Bootstrap – A CSS framework
jQuery – A JavaScript DOM manipulation library, used mainly for a few animations and in some places for the jQuery implementation of the CommonJS promise specification10.
FontAwesome – A font image library, used for some images in the CT4PL tool.
6.3 The Semantic Tree
The semantic tree is a representation of the code structure in tree format, with some metadata, e.g. types for typed languages). The aim is that the semantic tree in CT4PL should support most common language constructs which might be used in introductory imperative programming courses. A few examples of such code constructs could be the if-statement, addition expression, code block, variable assignment and the method call expression.
The Semantic Tree is written in C# but it is also used as part of the contract for the communication between the server and the client, in which case the Semantic Tree objects is served in JSON format to the client.
6.4 The Code Parser Interface
The Code Parser Interface is responsible for loosely coupling the Code Parser Implementations from the rest of the system and exposes a single method; Parse. The Parse method takes a code string as input and returns ParseResults as output. The ParseResults object contains either a list of errors (if the code contained got compilation or parse errors) or the Semantic Tree for the code.
6.5 The Code Parser Implementation
Each language that the CT4PL tool supports must have its own Code Parser Implementation, which receives a string of code and must return the ParseResults as described in Section 6.4 The Code Parser Interface, above. Currently the only implementation created is a Code Parser Implementation for C#; the CSharpCodeParser.
8 See http://www.asp.net/web-api for more information about ASP.NET Web API 9 See http://en.wikipedia.org/wiki/Representational_State_Transfer or
http://www.ics.uci.edu/~fielding/pubs/dissertation/rest_arch_style.htm for more information about Representational State Transfer (REST)
31
The Code Parser Implementation is responsible for determining which subset of the language is supported. The aim is to support a subset of the language large enough for an introductory imperative programming course, but not to support the whole languages.
It is important that the Code Parser Implementation for a language supports the language constructs which are generally used during introductory programming courses. The following is a (not
necessarily exhaustive) list of language constructs which seem to be commonly used during such courses11. At least the following statements should be supported: if-statements, while-statement, for-statements, variable declarations, and expression statements. Among the important expressions to support lie variable assignments, additions, subtractions, multiplication, comparisons (‘less than’, ‘less than or equals’, ‘greater than’, ‘greater than or equals’ and finally ‘equality’), division, modulus, method calls, constants and getting variable values.
The CSharpCodeParser internally uses the newly open sourced C# compiler Roslyn12 to compile the code and generate a syntax tree. It then uses this syntax tree to create the Semantic Tree (the Roslyn compiler is again used to gather additional type information for variables and method return values).
6.6 The Execution Model
The Execution Model is a virtual machine, written in JavaScript, which is capable of executing a Program described by the Semantic Tree. As the user steps through the trace the Execution Model performs the actions the code expresses; performing additions, updating variable values, writing output to the Console or getting input from the user.
The Execution Model is generated from the Semantic Tree, starting with the Program start point. For a C# Program, the Program start point is a method with the form like public static void Main(). From this point the Execution Model is generated based only on that specific method. This means that even if the Code View contains the entire Program, e.g. all methods the user defined, the Execution Model, and thus the Trace View, will only contain the code which has already been executed and the steps which are known to be planned for execution. If a method is never called by the Program it will never appear in the Execution Model nor the Trace View.
When the execution of the Program steps forwards, the Execution Model might add additional entries, again by parsing the Semantic Tree. An example of such a case would be the cloned iterative statements and custom method calls which parses and adds a whole new method; both of these are described in Section 5.2.3 The Trace Window.
Objects in the Execution Model can be in a few different stages, once they are added to the Execution Model (by the Execution Model virtual machine parsing the semantic tree and creation Execution Model objects for the different parts of the semantic tree which are planned for execution).
The initial state of an Execution Model object is that it has not been executed, i.e. it is planned for execution later. This is what is considered to be statements and expressions which are part of planned execution.
When a statement or expression has been executed, the state of the Execution Model object will change to indicate that it is executed. The state of the operands and results of the expression
11 The list is generated based on the authors personal experience, not any extensive study of language constructs which are actually used during introductory courses.
32
execution will from this point forward be stored for this Execution Model object in order allow showing what is called historic execution state.
If the virtual machine determines that a specific statement or expression will never be executed, e.g. from being inside the else-body of an if-statement where the condition evaluated to true, the Execution Model object for that statement or expression will indicate that the Execution Model will never execute. This is also stored and showed to the user in order to keep a clearer connection with the actual code which the user wrote.
6.7 The Framework Specific Implementations
When the virtual machine that is the Execution Model executes code there are a lot of things that behave exactly the same, no matter the framework or language used; for example, if you add 2 to 2 it generally results in 4, no matter which framework or language you use. However, some languages might have idiosyncrasies, such as allowing to add a string and a number together and what the result of that would be (commonly it would be concatenating a string representation of the number to the first string). Most clearly among framework specific behavior, however, is calling framework methods.
The different framework generally has methods with specific behavior, such as13
System.Console.ReadLine which reads input from the user, or System.Math.Abs which calculates the absolute value of the passed in value. These two are pretty common methods, which probably have equivalents in just about any framework. However, the Framework Specific Implementations part of the CT4PL tool is allowed to support none or any of the methods in the framework. The aim is, of course, to support those which are commonly used in introductory programming courses, and for those which are not supported the user has to write their own implementation as custom methods.
For each framework supported by the CT4PL (not necessarily for each language, since the same framework could potentially be run using multiple languages, such as the .NET framework which supports a multitude of languages) there needs to be an implementation of framework
idiosyncrasies and supported framework methods for that framework.
The current implementation of CT4PL supports only the following methods from the .NET framework: System.Console.WriteLine(string):void System.Console.WriteLine(int):void System.Console.ReadLine():string System.Math.Max(int, int):int int.Parse(string):int.
6.8 The Code View Generator
The Code View generator consists of implementations of visitors for the different types of nodes in the Semantic Tree. One such visitor visits a single type of Semantic Tree node and generates a code view.
By generating this code from the Semantic Tree instead of using the user input code directly, the CT4PL tool achieves two things. First; it can format the code well, even if the user input all the
13 All examples in this section are for the .NET framework and the C# language syntax, unless otherwise explicitly specified.
33
program code on a single line. Second; since the code is well formatted, the CT4PL tool can number the code lines and identify which exact line in the Code View a specific line in the Trace View corresponds to, and highlight that code line on mouse-over in the Trace View (see Section 5.2.3 The Trace Window for more information on this highlighting).
6.9 The Trace View Generator
The Trace View Generator is implemented as different Angular templates, all data-bound to the Execution Model objects which should be shown. Since the templates are bound to the Execution Model objects they have constant access to the runtime state of the Execution Model.
Since the Trace View Generator has access to the runtime state of the Execution Model, and the Execution Model contains historic execution information, it is possible for the Trace View to display not only the current state of the Program, but also the state as it was in all specific time periods before (see Section 5.2.3 The Trace Window for an explanation of the historic execution view on the Trace View).
Since the Execution Model is actually separate from the Trace View Generator, the CT4PL tool could actually support generating a view in a different programming language than was originally input. However, language idiosyncrasies and framework methods (as described in Section 6.7 The Framework Specific Implementations) would not translate correctly, so it is beneficial if the
languages use the same framework. This could be beneficial if the user would like to compare what the same code would look like in two different languages in order to understand that there most imperative languages are actually very much alike, only with slightly different syntax (and frameworks).
7 Tool Analysis
Section 4.3 stated some clear goals which the CT4PL tool should meet, which infers the question on how well the current design and implementation meet these goals.
The CT4PL tool does provide a visualization not only of the current state of the Program being visualized but also shows the execution path which made the program come to the current state, which was one of the goals for the tool. Providing a view on the exact code which has been executed during the whole execution history of the Program could help the user find logical errors in his or her code.
During the first interview phase, the Teacher also mentioned that recursion is an important concept to visualize and that it is common that students have problems learning the scope of variables when executing a function recursively. The CT4PL tool allows the user to view all recursive function calls and lets the user click on the variables in the different stages of execution, hopefully showing clearly the scope of the variables.
Previous studies have showed that students use the backward button as well as the step-forward button. The design of the CT4PL tool does support step-backward. On the other hand, the current implementation of the CT4PL virtual machine is limited in its functionality for stepping backwards, where some statements are not possible to step back through. This, however, could be considered a bug in the current implementation which needs to be fixed. But since the actual design was more important, the focus was on improving the design instead of fixing this bug.
34
To help the student along learning what is happening during the execution of the Program, the CT4PL tool allows the user to click on nearly any token in the execution trace to view more information about the token and the execution of the token.
In comparison to, for example, the web based Online Python Tutor (which pre-executes the Program on the server and only renders the execution on the client), the CT4PL tool allows visualization of Programs which asks for input from the user. It is not uncommon for assignments during the initial programming course to use input from the user (e.g. calculating ticket prices based on entered age) or other forms of non-deterministic behavior.
Since every Program entered into CT4PL tool is saved on the server and a URL which uniquely identifies that specific Program is generated, sharing code between students or between student and teacher is as easy as sending the URL to the other part. However, the CT4PL tool does not yet support communication around the code, but requires such communication to be performed via other channels (e.g. e-mail, Skype, phone or co-located meetings). Support for such communication is among the suggested future development later in this report.
To use the CT4PL tool, all that the user needs is a web browser supporting the JavaScript, HTML and CSS used, which should be all at least semi-recent browsers (during development, the CT4PL tool has mainly been run in Firefox 27.0.1, Firefox 29.0.1, Internet Explorer 10 and Internet Explorer 11). This makes the barrier to entry to use the tool very small, since all that is needed is to start the web browser and navigate to the URL for the specific code part.
However, following the results of the study done by Sorva et al. (2013b), it could be important that teachers discuss what is being visualized in the CT4PL tool, before the students use the tool, to increase the chance that students’ have a beneficial understanding of the visualization. Most things in the CT4PL tool does include explanations and additional information, to help the user, which are generally shown just by clicking on the element that the user wants more information regarding. It is important to note that the CT4PL tool is not, in any way, supposed to be the sole tool for learning programming, but a tool which can be used during the first introductory imperative programming course.
7.1 Interview Stage 2 – Feedback and Thoughts on the Interactive Prototype
After the initial design of the CT4PL tool had been done, an interactive prototype was developed (using JavaScript, HTML and CSS), to allow for a more real feeling for the interaction with the tool during the second interview stage, instead of using only static images of the design. This initial design prototype could only visualize a specific pre-created program instead of code written by the user.
This interactive prototype was used during the second interview phase, which was performed as an observational group study where two students sat together using the interactive prototype while discussing what they saw on the screen and what that meant. The interviewer also asked questions regarding the thoughts expressed, to get clarification if things were unclear. After the observational study, the students discussed with each other what was good and what was less good in the
prototype, as well as which features they would have liked to have seen. The interviewer then asked follow-up questions regarding the previous discussion. Finally, the students asked questions
35
During the observational study, the interviewer continuously made notes with pen and paper14. Due to the limitations of the notes made, the study results described below are mostly a summary of the thoughts expressed by the students during the interview.
The students both explained that they thought that having access to a tool which visualized that which the prototype visualized would have been beneficial during their studies, would have likely helped them in identifying logical errors in their code and would have been a good way to learn how to think when trying to identify such logical errors.
During the observational study, the students also alerted the interviewer on some things which were less easy to understand and a lot of additional functionality that they would have liked to see in the tool. The feedback provided by the students during this observational study gave reason for added clarifications in the tool, some additional features to be added and also some additional features to be planned for future improvements.
7.2 CT4PL – Classification into Engagement Taxonomies
Since the active engagement of students is an important part of a PV tool, it would be interesting to know how the CT4PL tool would be classified according to the different engagement taxonomies presented in Section 2.1 Engagement Taxonomies. The original Engagement Taxonomy is aimed at AV tools, not PV tools, but the EET and the 2DET are aimed at PV tools. This Section therefore holds a naive attempt for classifying the CT4PL tool according to these two taxonomies.
7.2.1 Classification According to the Extended Engagement Taxonomy
Since the CT4PL tool allows users to visualize Programs that the users him- or herself has created, the CT4PL tool would be classified in the category of Constructing according to the Extended Engagement Taxonomy, the third highest category. However, it could be argued that the CT4PL tool does not, in its current state, have any built-in support for the Responding category, but this
category is lower according to the EET and therefore not considered in that classification (though the section on future development contains a suggestion which adds this functionality).
The second highest category of the Engagement Taxonomy, Presenting, is of course a matter of usage and is achievable by, for example, presenting and explaining the Program for a laboratory assistant. The highest, Reviewing, is basically a matter of usage too, but the CT4PL tool would be more assisting of this category if the suggestions for future development are carried out, mainly regarding commenting on lines in the Trace View, since support for Reviewing would then be built into the tool itself.
7.2.2 Classification According to the 2DET
Classifying the CT4PL tool in the Content Ownership dimension of the 2DET is pretty easy. Since the CT4PL tool visualizes Programs made by the student him- or herself, the CT4PL tool clearly belongs to the Own Content category of the 2DET.
On the Direct Engagement dimension it is not exactly as easy. Most of the PV tool reviewed by Sorva et al. (2013a) fall into the Controlled Viewing category, which is the third category (of seven
categories). One reason for this might be that the Controlled Viewing category is pretty wide. The CT4PL tool would likely also fall into the Controlled Viewing category in the state it is now.
14 Only making manual notes of things which needed to be changed was an unfortunate choice. Had the study been redone, it would probably be recorded.