XXX-X-XXXX-XXXX-X/XX/$XX.00 ©20XX IEEE
BLIND SYMBOL RATE ESTIMATION FOR COGNITIVE RADIO USING
WAVELET TRANSFORM AND DEEP LEARNING FOR FSK MODULATED
DIGITAL SIGNALS
Inna Valieva, Mats Björkman, Johan Åkerberg, Mikael Ekström School of Innovation, Design, and
Engineering Mälardalen University Vasterås, Sweden inna.valieva@mdh.se Iurii Voitenko Electronics Development Wireless P2P Technologies Falun, Sweden iurii.voitenko@wp2p.org
Abstract —This paper is focused on the blind symbol rate estimation for the digital FSK modulated signals. Symbol rate estimation is based on the classification between three symbol rate classes: 10, 100 and 1000 KSymbol/second using the scalogram images obtained from time-frequency analysis performed using the continuous wavelet transform with Morse wavelet. Pretrained deep learning AlexNet has been transfer learned to classify between symbol rate classes. Training, testing and validation data sets have been composed from the artificial data generated using Bernoulli binary random signal generator modulated into FSK signal corrupted by additive white Gaussian noise (AWGN) noise with SNR ranging from 1 to 30 dB. The average classification accuracy during validation has reached 99.7% and during testing 100 % and 96.3 % for the data sets with SNR 25-30 dB and 20-25 dB respectively. Proposed algorithm has been compared with cyclostationary and has shown improved classification accuracy especially in conditions of low SNR. Central frequency estimation has been performed using a modified periodogram estimate of the power spectral density with a rectangular window.
Keywords—deep learning, blind symbol rate classification, signal-to-noise ratio, cognitive radio
I. INTRODUCTION
Cognitive radio (CR) is actively addressing the efficient utilization of the electromagnetic spectrum [1]. Spectrum sharing and dynamic spectrum access are techniques used in CR to optimize the use of the electromagnetic spectrum. Spectrum sharing enables interference free access to the same frequency bands between multiple users’ categories. Dynamic spectrum access enables sensing of the free channels and allows devices to communicate in underused parts of the spectrum. Intelligent signal processing and decision-making is used to dynamically select spectrum band, time diversity, spatial diversity options and generate a cognitive waveform [2]. Waveform information of the active transmitting users including both: symbol rate and modulation type is necessary to employ autonomous spectrum sharing scenario, i.e., to identify the spectrum reuse opportunities in conditions where no information about primary users and signals is available. Once the waveforms of the transmitting signals is known, it is possible to reuse underutilized white and gray spaces of the spectrum.
There are various methods for blind symbol rate estimation described in the literature including non-linear energy operator [3], cyclostationary [4-13], Inverse Fast Fourier Transform and baseband shape based [14], [15]; Monte Carlo based [16], [17]; Wavelet Transform based [18-23] and Maximum Likelihood [24], [25]. Most of the symbol rate estimation methods are applicable for the certain modulation types. For example, for the linear modulations cyclostationary methods and wavelet transform. Gardner’s method also based on signal cyclo-stationarity [26] was intended for BPSK and QPSK [27]. Non-linear modulations including FSK, however, received significantly less attention in the literature. Wavelet transform has been listed by Hatoum et al. in [23] as a high capacity method to detect discontinuity structures and zoom on the signal abrupt changes. While the traditional symbol rate estimation methods, such as the cyclostationary and the envelope spectrum method, show a dramatic decline of performance in low SNR, the wavelet transform based algorithm proposed by Yang et al. has demonstrated high performance at low SNR for FSK modulated signals [28].
The main objective of this work is performance evaluation of the wavelet feature extractor and AlexNet convolutional neural network (CNN) classifier for symbol rate estimation in our target application in various SNR conditions. The symbol rate classes, and boundary conditions are predefined by our target application. It is a software-defined radio-based network consisting of the digital cognitive radio nodes. The radio part is based on Analog Devices AD9361 transceiver. It has Zynq 7020 FPGA and dual-core ARM Cortex A9 CPU with embedded Linux OS. Nodes are operating in the non-cooperative communication environment within 70 MHz - 6GHz frequency band. Cognitive waveforms are generated by supporting multiple modulations including both linear: QPSK, BPSK, QAM and non-linear: FSK and three studied symbol rate classes: 10, 100 and 1000 KSymbol/second. Artificial data set has been generated using Bernoulli binary random signal generator modulated into FSK signal with three studied symbol rate classes. AWGN has been added to the signal as a distortion to generate the signal with different SNR values within the range from 30 to 1 dB with step size 1dB. Carrier frequency estimation has been performed in the frequency domain using a modified periodogram estimate of the power spectral density with a rectangular window. Generated data samples have been preprocessed into the time domain scalogram images by applying Morse wavelet transform. Classification has been performed by AlexNet deep network trained using the transfer learning. Even though the use of the deep network classifier could be a questionable choice for the
portable embedded application, Véstias et al. [29] have demonstrated successful launch of the optimized AlexNet on ZYNQ7045 FPGA. The inference execution times of CNNs in low density FPGAs has been improved using fixed-point arithmetic, zero-skipping and weight pruning. The proposed algorithm has been also compared with the cyclostationary symbol rate estimation in terms of classification accuracy.
II. DATA SET
Data Set Generation. Data set used for training, validation and testing has been generated using a virtual model presented on Figure 1. The input signal has been generated by Bernoulli binary random signal generator and modulated into FSK with given symbol rate, deviation and central frequency of 1.5 MHz. AWGN channel model has been selected to emulate the propagation environment with SNR ranging from 30 dB to 1 dB with the step size of 1 dB. Artificial data set has been composed from 900 FSK modulated signal samples with 300 samples for every studied class. Data samples were initially presented in the form of power spectrum density plots. Figures 3 and 5 present signal samples. Data set samples have been randomly divided into two data sets used for training and validation.
Training Dataset contained 70% of the FSK modulated data samples, what corresponds to 630 signal samples, including 210 samples for every studied class.
Validation Dataset contained 30% of the FSK modulated data set, what corresponds to 270 samples including 90 samples for every studied class.
Testing Dataset has been composed from six groups of samples, according to SNR level with 90 test images of every class per group including 30 images for every class. The first group contains signals with SNR ranging from 1 dB to 5 dB, the second with SNR from 6 to 10 dB, the third group: from 11 to 15 dB, the fourth group: from 16 to 20 dB, the fifth group: from 21 to 25 dB and the sixth group: from 26 to 30 dB.
III. CENTRALFREQUENCYESTIMATION Central frequency estimation has been performed using a modified periodogram estimate of the power spectral density with a rectangular window and integrating it [30]. The periodogram is the Fourier transform of the biased estimate of the autocorrelation sequence. For a signal, xn,
sampled at fs samples per unit time, the periodogram is defined by Equation 1: 2 1 2 0 ( ) N j fn , 1/ 2 1/ 2 n n t P f x e t f t N
(1)Where Δt is the sampling interval. For a one-sided periodogram, the values at all frequencies except 0 and the Nyquist, 1/2Δt, are multiplied by 2 to keep the value of the
total power. The modified periodogram is obtained by multiplying the input time series by the window function - hn. This helps to alleviate the leakage in the periodogram. A
suitable window function should be nonnegative, decaying to zero at the beginning and end points. If hn is a rectangular
window function, the modified periodogram is defined by Equation 2. 2 1 2 0 ( ) , 1/ 2 1/ 2 N j fn n n n t P f h x e t f t N
(2)where Δt is the sampling interval. The integral of the true PSD, P(f), over one period, 1/2Δt for cyclical frequency and 2π for normalized frequency, is equal to
the variance of the wide-sense stationary random process defined by Equation 3: 1/2 2 1/2 ( ) t t P f df
(3) IV. CYCLOSTATIONARYESTIMATION The second order periodicity is defined as the existence of the non-zero correlation between some spectral components in the time series. Spectral correlation is a measure of the second order periodicity in the time-series [31]. It is described by Equation 4: / 2 / 2 1 1 ( , ) , , 2 2 t t t x t T T t t S t f X w f X w f dw t T (4) where /2 2 /2 1 ( , ) t T i fw T T t T X t f x w e dw t
(5)For all values the spectral location parameter:
1 ( ) ( ) 2 2 2 f f f (6) And the spectral separation parameter:
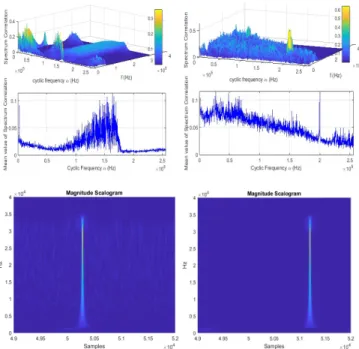
( ) ( ) 2 2 f f (7) is a frequency of the second order periodicity: cyclic frequency [31]. The mean value of the spectral correlation matrix has been computed for the studied cyclic frequencies. The symbol rate has been estimated as the cyclic frequency corresponding to the maximum value of the mean spectrum correlation.
V. DATAPREPROCESSINGANDAUGMENTATION The preprocessing of training, validation and testing data sets have been performed. Primary, the Inverse Fourier transform with the window size of 216 has been applied to
switch from the frequency to the time domain. Verification that selected window size resolves the signal in time domain successfully has been performed using Constant Overlap-Add (COLA) Constraint and “iscola” Matlab function [32].
Figure 1. Data set Generation Model.
To perform time-frequency analysis the continuous wavelet transform Morse wavelet has been chosen, defined by time
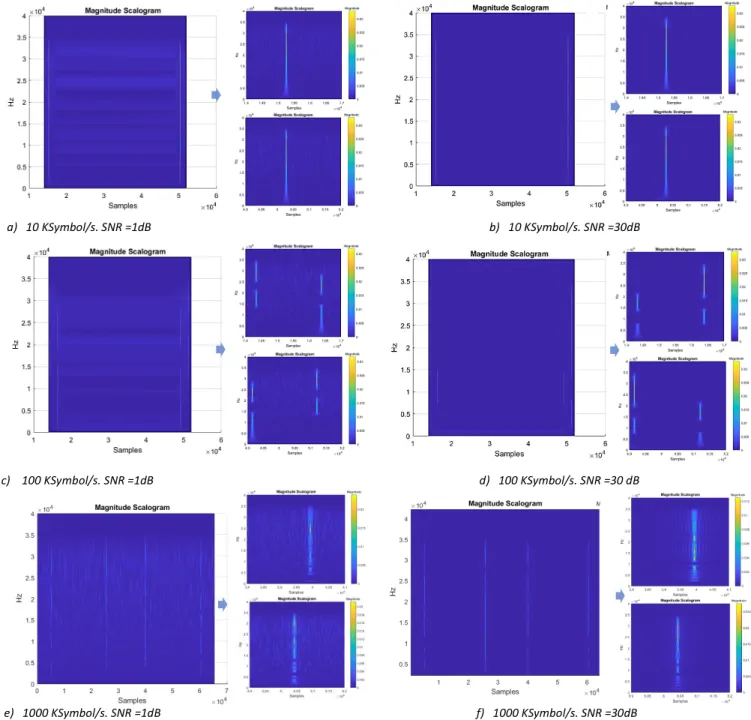
and frequency spread has been applied to the time domain signal. Scalogram images have been plotted based on the scales magnitudes data. The significant regions are found as the regions with the maximum magnitudes of the scales. Scalogram plots have been zoomed in into the significant regions for all of the three studied classes. Figure 7 presents the full size scalograms and zoomed in regions of interest for all three studied classes. The described above scalogram
preprocessing have been applied to the training, validation and testing data sets. Examples of the preprocessed scalogram images are summarized by Figure 8.
Data Augmentation. Both training and validation data sets have been augmented to obtain twice larger data set i.e 1800 scalogram images in comparison to original size of 900 samples. Random mirror reflection about X axis and random translation in both X and Y axis by pixel range [-256 256] have been applied to compose the augmented data set.
Figure 6. Spectrum correlation and its mean value: 10, 100 and 1000 KSymbol/s, SNR =1 dB. Figure 3. Data Samples PSD plots: 10, 100 and 1 MSymbol/s, SNR =30 dB
Figure 4. Spectrum correlation and its mean value: 10, 100 and 1000 KSymbol/s, SNR =30 dB.
Figure 7. Data set samples. Full scalogram plots and zoomed in regions of interest.
Figure 8. Data set samples. Scalogram plot, zoomed-in regions of interest.
a) a) 10 KSymbol/s. SNR =1dB b) b) 10 KSymbol/s. SNR =30dB
c) c) 100 KSymbol/s. SNR =1dB d) d) 100 KSymbol/s. SNR =30 dB
Figure 9. AlexNet transfer learning process.
Figure 10. AlexNet transfer learning loss function.
VI. DEEPLEARNINGNETWORK
The pretrained AlexNet: a CNN [33] has been selected as a classifier due to both: relatively less complex for the deep network architecture and possibility to take an advantage of transfer learning: fine-tuning is usually much faster and easier than training a network with randomly initialized weights from scratch. Also, to transfer learn features to classify new object could be done using a smaller data set. AlexNet has learned rich feature representations: it has been pre-trained on over one million images to classify images into 1000 classes [33], such as keyboard, coffee mug, pencil, and many animals. AlexNet consists of 25 layers, including five convolution layers, three fully connected and six reLU layers. The network takes an image as input and outputs a label for the object in the image together with the probabilities for each of the object categories. The network structure has been modified to accomplish symbol rate classification via adjustment of the output layer size. The modified AlexNet was trained using the training data set composed of scalogram images.
VII. TRAININGANDVALIDATION
Pretrained AlexNet has been transfer learned to classify the symbol rate based on the FSK modulated data samples preprocessed as scalogram images. The transfer learning network training has been performed in 6 epochs with 74 iterations per epoch, i.e 444 iterations in total. An epoch is defined as a full pass through the entire data set. Figures 9 and 10 summarize the training process and the loss function respectively. Validation has been performed with the frequency of three iterations on the entire validation set, has reached 99.69% accuracy on each individual mini-batch and smoothed training accuracy is its denoised version obtained by applying a smoothing filter. Training loss is defined as the loss on each mini batch. Smoothed training loss is the smoothed version of the training loss and validation loss is the loss on the validation data set. The loss function is the cross-entropy loss since the output layer is a classification layer.
VIII. TESTINGRESULTS
Testing has been performed on the testing data set consisting of six SNR testing groups. The testing images
Figure 11. Average classification accuracy during testing.
have been sampled in the randomized order. Around 30 testing images have been used for each class within each SNR group. The average classification accuracy has been calculated as a mean value of the classification accuracy observed for every SNR testing group. Figure 11 presents the average classification accuracy observed during the testing for every SNR group for both proposed algorithm and cyclostationary estimation.
IX. CONCLUSIONS
The classification of the symbol rate based on the scalograms obtained from the Morse wavelet transform of the time domain FSK modulated signals has been performed. Pre-trained deep learning network AlexNet has been used as a classifier. The validation accuracy of the symbol rate classification has reached 99.7%. During the testing the highest average classification accuracy of 100% has been observed for the signals with SNR levels 25-30 dB, while for signals with SNR 20-25 dB it was 96.3%. No significant effect of SNR value on the average classification accuracy has been observed. Wavelet transform could be suggested as a feature extraction method for the signals with low SNR.
Figure 12. Misclassified Samples: Cyclostationary: 10 and 1000 Ksymbol/s; Scalograms: 10 and 100 KSymbol/s.
X. DISCUSSION
The combination of wavelet feature extractor and AlexNet classifier has shown up to 100% classification accuracy in testing and 97% accuracy at the low SNR.
The wavelet feature extractor has shown the potential interest to be tested in combination with the less computationally demanding classification algorithms in the scope of the future work. The visual analysis of the misclassified samples by the proposed algorithm has shown several scalograms of 10 and 100 KSymbol/second with very alike significant regions. The misclassification in the baseline cyclostationary algorithm has been caused mostly by the random noise peaks that at low SNR were exceeding the maximum regions of spectral correlation.
REFERENCES
[1] I. Marsa-Maestre, T. Ito, S. Pollin, A. Chiumento, and J. M. Gimenez-Guzman “Efficient Spectrum Usage for Wireless Communications,” Wireless Communications and Mobile Computing, 2019, pp. 2
[2] Rondeau, Thomas W., and Charles W. Bostian. Artificial Intelligence in Wireless Communications, Artech House, 2009. pp. 2-3.
[3] Khan S.Z., Mostayed A., Kabir M.E. (2011) A ‘Frequency Blind’ Method for Symbol Rate Estimation. In: Zeng D. Future Intelligent Information Systems. Lecture Notes in Electrical Engineering, vol 86. Springer, Berlin, Heidelberg
[4] G. J. Phukan and P. K. Bora, "An algorithm for blind symbol rate estimation using second order cyclostationarity,"2014 International Conference on Signal Processing and Communications (SPCOM), Bangalore, 2014, pp. 1-6.
[5] Julien, Renard & Verlant-Chenet, Jonathan & Dricot, Jean-Michel & Doncker, Philippe & Horlin, Francois. (2010). Higher-Order Cyclostationarity Detection for Spectrum Sensing. EURASIP Journal on Wireless Communications and Networking. 2010.
[6] A. Guner and I. Kaya, "Periodic variation method for blind symbol rate estimation," 2011 IEEE 22nd International Symposium on Personal, Indoor and Mobile Radio Communications, Toronto, 2011, pp. 147-151. [7] B. Suesser-Rechberger and W. Gappmair, "New Results on Symbol Rate Estimation in Digital Satellite Receivers," 2018 11th International Symposium on Communication Systems, Networks & Digital Signal Processing (CSNDSP), Budapest, 2018, pp. 1-6.
[8] “Efficient Blind Symbol Rate Estimation and Data Symbol Detection Algorithms for Linearly Modulated Signals”. Master Thesis. Sang Woo Park. Texas A&M University, May 2008
[9] Lenty Stuwart, S., Tamil Selvi, S. Precoder Based Collaborative Blind Multiuser Detection of CDMA Signals. Wireless Pers Commun 83. pp 135–148 (2015).
[10] Jallon, P. & Chevreuil, A. (2008). Estimation of the symbol rate of linearly modulated sequence of symbols. Signal Processing. 88. pp. 1971-1979.
[11] Elgenedy, M. & Elezabi, A.. (2013). Blind symbol rate estimation using autocorrelation and zero crossing detection. IEEE International Conference on Communications. pp. 4750-4755.
[12] Majhi, Sudhan & Ting, See Ho. (2015). Blind Symbol-Rate Estimation and Test Bed Implementation of Linearly Modulated Signals. Vehicular Technology, IEEE Transactions on. 64. pp. 954-963.
[13] L. Sheng-en, Z. Xiao-Yong and L. Lai-yuan, "Subband processing based symbol-rate estimation method for MFSK signal," IEEE 10th International Conference on Signal Processing, Beijing, 2010, pp. 38-41. [14] Xu, Haiyuan & Zhou, Yiyu & Huang, Zhitao. (2007). Blind Roll-off Factor and Symbol Rate Estimation using IFFT and Least Squares Estimator. pp. 1052 - 1055.
[15] M. Flohberger, W. Kogler, W. Gappmair and O. Koudelka, "Symbol Rate Estimation with Inverse Fourier Transforms," 2006 International Workshop on Satellite and Space Communications, Madrid, 2006, pp. 110-113.
[16] Stuwart, S. & Selvi, S. (2015). Precoder Based Collaborative Blind Multiuser Detection of CDMA Signals. Wireless Personal Communications. 83.
[17] Punskaya, Elena & Andrieu, C. & Doucet, Arnaud & Fitzgerald, W.J. (2001). Particle filtering for demodulation in fading channels with non-Gaussian additive noise. Communications, IEEE Transactions on. 49. pp.579 - 582.
[18] R. Sawai, H. Harada, H. Shirai and M. Fujise, "General-purpose symbol rate and symbol timing estimation method by using multi-resolution analysis based on wavelet transform for multimode software radio, "Gateway to 21st Century Communications Village. VTC 1999-Fall. IEEE VTS 50th Vehicular Technology Conference, Amsterdam, The Netherlands, 1999, pp. 2128-2132 vol.4.
[19] J. Xu, Y. Zhang and H. Jiang, "Symbol Rate Estimation Based on Wavelet Transform,"2012 8th International Conference on Wireless Communications, Networking and Mobile Computing, Shanghai, 2012, pp. 1-4.
[20] Xu Jun, Wang Fu-ping and Wang Zan-ji, "The improvement of symbol rate estimation by the wavelet transform, "Proceedings. 2005 International Conference on Communications, Circuits and Systems, 2005., Hong Kong, China, 2005, pp. 100-103 Vol. 1.
[21] G. Sun, J. An, J. Yang, Y. Jing and Z. Li, "Symbol Rate Estimation Using Cyclic Correlation and Haar Wavelet Transform,"2008 4th International Conference on Wireless Communications, Networking and Mobile Computing, Dalian, 2008, pp. 1-4.
[22] Y. T. Chan, J. W. Plews and K. C. Ho, "Symbol rate estimation by the wavelet transform," 1997 IEEE International Symposium on Circuits and Systems (ISCAS), Hong Kong, 1997, pp. 177-180 vol.1.
[23] R. Hatoum, A. Ghaith, G. Pujolle. Generalized wavelet based symbol rate estimation for linear single carrier modulation in blind environment.”, European Scientific Journal, May 2014 edition vol.10, No.15.
[24] J. H. Lodge and M. L. Moher, "Maximum likelihood sequence estimation of CPM signals transmitted over Rayleigh flat-fading channels," in IEEE Transactions on Communications, vol. 38, no. 6, pp. 787-794, June 1990.
[25] Xiaoyong Yu and S. Pasupathy, "Innovations-based MLSE for Rayleigh fading channels," in IEEE Transactions on Communications, vol. 43, no. 2/3/4 1995, pp. 1534-1544.
[26] W.A.Gardner. Signal interception: a unifying theoretical framework for feature detection. Communications, IEEE Transactions on, 1988, 36(8), pp: 897-906.
[27] Al-Hamiri, M., "Symbol Synchronization Techniques in Digital Communications" (2017). Thesis. Rochester Institute of Technology. [28] Z. Yang, H. Ge, G. Xu and P. Guo, "Research on Communication Signal Symbol Rate Estimation Based on Wavelet Transform," 2019 IEEE 8th Joint International Information Technology and Artificial Intelligence Conference (ITAIC), Chongqing, China, 2019, pp. 1660-1663.
[29] Véstias, M. & Duarte, Rui & Sousa, José & Neto, Horacio. (2019). Fast Convolutional Neural Networks in Low Density FPGAs Using Zero-Skipping and Weight Pruning. Electronics.
[30] Mathworks, Periodogram power spectral density estimate. [Online] Available: https://se.mathworks.com/help/signal/ref/periodogram.html [Accessed:Feb. 20, 2020].
[31] W. Gardner, Statistical Spectral Analysis. A Non-Probabalistic Theory, Prentice Hall, 1988,pp. 384-387
[32] Mathworks, Determine whether window-overlap combination is
COLA compliant. [Online] Available:
https://se.mathworks.com/help/signal/ref/iscola.html [Accessed: Feb. 20, 2020].
[33] Mathworks, Pretrained AlexNet convolutional neural network.
[Online] Available:
https://se.mathworks.com/help/deeplearning/ref/alexnet.html [Accessed: Feb. 20, 2020].