Master Thesis
Software Engineering September 2012
School of Computing
Blekinge Institute of Technology Firstname Lastname
Address: If applicable
E-mail: If applicable a long-term e-mail (not your student e-mail)
Integrating Exploratory Testing In
Software Testing Life Cycle
A Controlled Experiment
Tanveer Ahmed
Chejerla Madhusudhana Raju
School of Computing
Blekinge Institute of Technology SE-371 79 Karlskrona
Internet : www.bth.se/com Phone : +46 455 38 50 00
Authors: Tanveer Ahmed Address: Karlskrona,Sweden Email: tanveershaik4u@gmail.com. MadhuSudhanaRaju.Chejerla Address: Karlskrona,Sweden Email: msraju2009@gmail.com
This thesis is submitted to the School of Engineering at Blekinge Institute of Technology in partial fulfillment of the requirements for the degree of Master of Science in Software Engineering. The thesis is equivalent to 30 weeks of full time studies.
University advisor: Dr. Wasif Afzal School of Computing
A
BSTRACT
Context. Software testing is one of the crucial phases in software development life cycle (SDLC). Among the different manual testing methods in software testing, Exploratory testing (ET) uses no predefined test cases to detect defects.
Objectives. The main objective of this study is to test the effectiveness of ET in detecting defects at different software test levels. The objective is achieved by formulating hypotheses, which are later tested for acceptance or rejection.
Methods. Methods used in this thesis are literature review and experiment. Literature review is conducted to get in-depth knowledge on the topic of ET and to collect data relevant to ET. Experiment was performed to test hypotheses specific to the three different testing levels : unit , integration and system.
Results. The experimental results showed that using ET did not find all the seeded defects at the three levels of unit, integration and system testing. The results were analyzed using statistical tests and interpreted with the help of bar graphs.
Conclusions. We conclude that more research is required in generalizing the benefits of ET at different test levels. Particularly, a qualitative study to highlight factors responsible for the success and failure of ET is desirable. Also we encourage a replication of this experiment with subjects having a sound technical and domain knowledge.
Keywords: Exploratory testing, Experiment, Effectiveness, Software testing life cycle.
ACKNOWLEDGEMENT
In the name of Allah most beneficent and most mercifulAll praise is due to Allah so we praise him and we seek his refuge and we bear witness that Muhammad saw is his messenger and devotee.
At the outset, I am grateful to Almighty Allah who has bestowed me with his mercy and blessings to complete my thesis.
We would like to thank our parents and my siblings for their unconditional love and support. We would like to thank Dr. Wasif Afzal whose support and help has been substantial in completing the master thesis. Finally we would like to thank our joint family, friends and fellow students for their moral and emotional support.
- Tanveer Ahmed
Table of Contents
INTEGRATING EXPLORATORY TESTING IN SOFTWARE TESTING LIFE CYCLE...I
ACONTROLLED EXPERIMENT ... I ABSTRACT ... 2 ACKNOWLEDGEMENT ... 3 1 PROLOGUE ... 8 1.1INTRODUCTION... 8 1.2MOTIVATION ... 9 1.3RELATED WORK ... 9
1.4AIMS AND OBJECTIVES ... 10
1.5RESEARCH QUESTION ... 10 1.6THESIS STRUCTURE ... 11 1.7ABBREVIATIONS/GLOSSARY ... 12 2. BACKGROUND ... 13 2.1SOFTWARE TESTING ... 13 2.2LEVELS OF TESTING ... 14 2.2.1 V model of Testing ... 15 2.3EXPLORATORY TESTING ... 17 2.3.1 Benefits of ET ... 19 3. EXPERIMENT ... 20 3.1EXPERIMENT DEFINITION ... 20
3.1.1 Object of the study ... 20
3.1.2 Purpose ... 20 3.1.3 Quality focus ... 21 3.1.4 Context ... 21 3.1.5 Perspective ... 21 3.2EXPERIMENT PLANNING ... 21 3.2.1 Context Selection ... 21 3.2.2 Hypothesis formulation ... 21 3.2.4. Selection of subjects ... 22 3.3EXPERIMENTAL DESIGN ... 22
3.3.1 Experiment design type ... 23
3.4INSTRUMENTATION ... 24
4. RESULTS AND ANALYSIS ... 26
4.1RESULTS ... 26
4.2NORMAL DISTRIBUTION ... 28
4.3UNIT LEVEL USING WILCOXON TEST ... 29
4.3.1 Hypothesis testing at Unit test level ... 31
4.4INTEGRATION LEVEL USING TWO SAMPLET-TEST ... 32
4.4.1 Hypothesis testing at Integration level ... 34
4.5SYSTEM LEVEL USING WILCOXON TEST ... 35
4.5.1 Hypothesis testing at System test level ... 37
5. DISCUSSION ... 39
5.2VALIDITY THREATS ... 40
5.2.1Internal validity ... 40
5.2.2External validity ... 40
5.2.3Construct validity ... 41
5.2.4Conclusion validity ... 41
5.3EVALUATION OF EXPERIMENTATION RESULTS ... 42
5.3.1 Mapping RQs to Obtained results ... 42
6. CONCLUSION ... 43 6.1FUTURE WORK ... 43 7. REFERENCES ... 44 8. APPENDIX ... 48 8.1APPENDIX A ... 48 8.1.1Assessment form ... 48
8.1.2Defect Count Report ... 48
8.1.3Defect Seeded Report ... 488
8.2APPENDIX B ... 62
8.2.1 User Guide for Experiment ... 62
8.2.2 User guide References: ... 64
List of tables:
Table1: Experiment design……….. 23
Table2: Descriptive statistics of experiment………..………….………. 26
Table3: Overview of parametric/non-parametric tests for different designs ……….….………….……….…... 27
Table4: Tests of Normality (unit level)………..………….. 28
Table5: Tests of Normality (integration level)……….… 28
Table6: Tests of Normality (system level)………... 28
Table7: Hypothesis Summary at Unit level………..…..…….………... 31
Table8: Hypothesis Summary at Integration level…….…….………... 33
Table9: Hypothesis Summary at System level………...36
Table10: Assessment form………. 47
Table11: Defect Count Report……….………... 47
Table12: Representation of different software test levels in our experiment……….. 48
Table13, 14 & 15: Wilcoxon statistical test at Unit Level ………...29
Table16, 17: Two sample T-test at Integration Level …...33
Table18, 19 & 20: Wilcoxon statistical test at System Level ………...36
Table21: Seeded Defects Report ………..…...48
List of figures
Figure1: Testing hierarchy [14] ………14
Figure 2: V model……….……….15
Figure 3: Experiment execution…….………25
Figure 4: Bar graph visualizing Unit Level Defects……….……….32
Figure 5: Bar graph visualization of integration level defects….………..35
Figure 6: Bar graph visualization of system level defects……….………51
Figure 7: Screen shot of web application used in the experiment……….…....65
Figure 8: Screen shot of web application used in the experiment……….…....66
Figure 9: Screen shot of web application used in the experiment…….…….……...67
1
PROLOGUE
1.1Introduction
Software Testing is considered as one of the vital phases in Software Development Life Cycle due to huge amount of cost involved into this phase [2]. In Software testing there are two types of testing techniques, manual and automated. Manual testing [MT] helps finds defects manually without the help of tool. Other techniques like test automation are complementary techniques which avoid repetitiveness and create room for creative MT [3][ 6].
Exploratory testing is a kind of manual testing practice in software testing. James Bach [5] defined Exploratory testing as “simultaneous learning, test design and test execution”, Also “ET is an approach to testing that emphasizes the freedom and responsibility of each tester to continually optimize the value of his work done by treating learning, test design, and test execution as mutually supportive activities that run in parallel throughout the project [5]” . Exploratory testing is quite opposite to traditional testing approaches which use the concept of predefined test cases. ET stresses the need of using testers‟ skills rather relying on predefined test cases [8]. Earlier exploratory testing was called as ad hoc testing [5]. Exploratory testing only relies on tester skills and do not follow any particular procedure for testing. In Exploratory testing human intelligence and other human personality traits play an important role in determining the bugs [12]. In Exploratory testing there is no lengthy documentation.
There are numerous studies about effectiveness of ET [11] but knowledge of these studies is limited to utilizing tester‟s skills. Our purpose in this thesis to conduct an experiment which evaluates the effectiveness of integrating exploratory testing (ET) with software testing life cycle (STLC) more specifically targeting three levels of STLC i.e., unit level, integration level and system levels. The next section is motivation for doing the thesis.
1.2 Motivation
Software testing is necessary in software development life cycle since it saves costs and improves quality of the overall product. ET is a manual approach to software testing which aims at finding defects; its main purpose is to continually optimize finding defects and putting less effort on documenting, planning and scripting [11]. Reports in literature have suggested that ET can be orders of magnitude more efficient than scripted testing [5].
There are prolific studies by various authors in the field of software testing but there are few articles on ET. Much of the literature about ET is available through text books, practitioner reports, and electronic material on the internet [11]. Practitioner reports have argued about ET to be effective and cost efficient [3, 35, and 39]. There are studies in literature which have mentioned about the effectiveness and efficiency [33, 34, 35, 36] of ET which has to be further investigated [11]. There is need to investigate various aspects of exploratory testing, experience and the knowledge involved in it [47]. Our current knowledge about ET and its very usage with the software test levels is very limited. These things are to be further explored in terms of incorporating ET with Software test levels. In this thesis we seek to evaluate the effectiveness of integrating ET at different software test levels.
1.3 Related Work
Prakash and Gopalakrishnan [37] conducted an experiment for testing efficiency of exploratory testing and scripted testing. The experiment was based on simple calculator to test its functionality. The result of the experiment indicated that there was no use of predesigned test cases when testing. Juha Itkonen et al. [5] researched about the defect detection efficiency of ET and test case based testing by performing a controlled experiment with software engineering students. They emphasized the fact that there were no underlying differences in the type of defects detected, severities and difficulty in detection.
Andhy Tinkham et al. [7] have argued about the different learning styles of testers that are used to find defects with the help of ET. They are stressing the point, that tester‟s personality and skills affects process of ET. Jorg Denzinger [8] proposed a new method in ET that uses tool-support by a tester to detect unwanted behaviour. This was done with the help of two case studies, which helped in identifying not previous known defects. According to [38], testers need to apply testing techniques
of their study was to improve understanding of exploratory testing in terms of level functional testing.
Agruss et al. [9] emphasized the fact that chances of finding new defects decreases substantially once a predesigned test case is run. Testers often do not depend on test strategies but rather apply various techniques to uncover defects; these strategies are not found in predesigned test cases [9]. Pyhajarvi et al. [10] performed an action research about exploratory testing. They have presented the use of cycles of time framework to integrate testing into development.
Phil Laplante [12] in his research has explored different needs of ET in avionics and space shuttle systems by doing different explorations like environmental, input, output, behavioural, language etc. Research is still going on in ET to test its suitability and applicability in different areas. The next section explains the aims and objectives of the experiment.
1.4Aims and Objectives
The aim of this thesis is to comment on the effectiveness of ET in detecting defects at the three testing levels of unit, integration and system. This aim will be met by testing three hypotheses aimed at finding the defect detection ability of ET at the three levels of unit, integration and system testing.
By doing this we will be able to analyse the effectiveness of ET in each test level.
1.5 Research Question
We seek to answer the following research question in this thesis:
RQ: Can ET detect all the defects seeded at unit, integration and system levels of testing?
This research will focus on effectiveness of ET in detecting seeded defects at different software test levels. The motivation for selecting effectiveness is that there are studies which state that there is need for investigating effectiveness and efficiency in ET [11].
1.6 Thesis Structure
Chapter 1(Introduction):
This section contains introduction to exploratory testing, aims and objectives, research questions and motivation for doing thesis.Chapter 2(Background):
This section highlights the background and literature survey in connection with ET. It also summarises about testing, different software test levels and explanation about ET.Chapter 3(Research methodology):
This section of master thesis contains the experiment part, which was conducted on the guidelines of wohlin et al. In this section there are objectives of the experiment, experiment definition, planning, design and execution.Chapter 4(Results and Analysis):
The fourth chapter of this thesis document presents the results of the experiment and its analysis .The analysis of the experiment was done based on the descriptive statistical methods.Chapter 5(Discussion):
This chapter of the master thesis presents discussion based on the results achieved and further course of research that can be carried out. Validity threats associated with the thesis are also discussed in this section.Chapter 6(Conclusion):
This chapter provides final conclusion of the thesis. The outcome of the thesis is discussed in this part of the master thesis.Chapter 7(Reference)
Chapter 8(Appendix)
1.7 Abbreviations/Glossary
STLC
software test life cycleUT
Unit testingIT
Integration testingST
System testing.MT
Manual testingSUT
Software under test2.
B
ACKGROUND
The field of software testing is always looking for cost effective methods in its quest to ensure quality in all the phases. Software testing is considered to be one of the vital phases in Software Development Life Cycle (SDLC). A huge amount of cost is involved in this phase [1]. The defects found by Manual Testing (MT) are mostly new and other techniques like test automation are complementary techniques that avoid repetitiveness and create room for creative MT [2][ 4].
The following sections explain the notion of software testing and approach to testing i.e., exploratory testing and different software test levels and related work.
2.1 Software testing
Software testing is also called as program testing and is part of the process verification and validation. This is done with the aim of finding faults in the software system. This should be included early in the process of software development to ensure high quality and to save costs. Researchers have tried to define software testing according to the usage. Here are few of the definitions.
Software testing is the process of uncovering evidence of defects in software system [17].
Testing shows the presence, not the absence of bugs [16].
The process of operating a system or component under specified conditions observing recording the results, and making an evaluation of some aspect of the system or component [15].
Software testing is an empirical, technical investigation conducted to provide stakeholders with information about the quality of the product under test [18].
Testing is the process of analyzing a software item to detect the difference between existing and required conditions and to evaluate the features of the software item [30].
Software testing follows a hierarchal approach; this was reported by [14], on the topmost level there are different levels of software testing cycle, in the next level methods followed by the types. Our thesis mainly deals with the levels of software testing and seeking the possibility incorporating exploratory testing into these levels.
A Simple classification of testing consists of two methods black box, white box. Black box testing is also called as specification based testing and white box testing is also called as structure based testing. On the hierarchy of testing these methods are at the second level [14].
The bottom level of testing hierarchy consists of testing types, for example Functional, Algorithmic, Positive tests, negative tests etc.
Functional: “Tests designed to determine if specific functions/features work as specified” [14].
Algorithmic: “Tests designed to determine if specific algorithms have been implemented correctly” [14] etc.
Apart from these test types there are also there are many others. The following figure gives the overview of testing hierarchy,
Figure 1: Testing hierarchy [14]
2.2 Levels of testing
Companies use v model to demonstrate testing at different levels, however they don‟t follow sequential process. There are four software test levels viz. Unit, Integration, System and Acceptance. Our primary concern is to find the effectiveness of integrating exploratory testing at unit, integration and system levels. ET is not appropriate to use with acceptance testing it can be used elsewhere [9].
Unit level, Integration level & System level Black box White box Types Levels of testing Methods Functional, Algorithmic, Positive, etc.
2.2.1 V model of Testing
The V model of testing is often mistaken with the waterfall. The v model is an extension of the simple waterfall model where each test level is concerned with each process phase [10]. There are many variants of v model as reported by [27][28] . In v model of testing the test levels unit and integration testing are considered as low levels of testing [29], whereas system and acceptance testing are considered as high levels of testing [10].
The motivation for selecting v model is that it is state of art and practically taught on all the courses [10]. Therefore it becomes necessary to study about v model and different levels in it. The following figure 2 is v model, after each test level there is regression testing. Our main concerns in the thesis are the software test levels unit, integration and system.
Figure 2: V-model of testing
2.2.1.1. Unit Testing: Unit testing (UT) is the lowest level of testing in Software testing life cycle [21]. The smallest part of code is check against requirements in unit testing [19]. It has been widely used after the introduction of object oriented languages like java and C++ [19]. UT is vital part of software development practice and if units are incorrect then the chances of build reliable systems narrows down [20].
Objective: The primary objective of unit testing is to detect defects in logic, data by testing individual modules [14].
Code Unit test Global design Detailed design System test Integration test System requirements
Examples of units are classes, functions and interfaces. The following are the defects which could occur at unit testing.
Incorrect data type
Testing function procedures or event handling Variable declared but never used
Mismatching of data like for integer type floating type data is given For loop(index issues)
While loop(end condition might be wrong)
2.2.1.2Integration testing (IT): It is the next of level of testing after UT. Integration testing is the process of verifying interactions between system components [23][25]. The main purpose of IT is to test behavior of components as a whole [24]. It aims at building program structures besides testing the interfaces [26]. It is most useful and effective technique for performing testing [22].
Objective of IT: To find defects in interfaces between units [14].
The following are the sample defects which could occur at integration testing. Correct call from each other functions
Transfer right data
Access interfaces at right time Check correct state of component
2.2.1.3 System Testing (ST): The third level of software testing is System testing. In this subsystems are integrated to make up whole system and then tested [26].
Objective: The objective of system testing is to verify whether all requirements are met as earlier defined [14].
The following are the defects which could occur at system testing Incorrect/absence of data
Actual functionality of code is missing
Logic or calculation of data is incorrect or inconsistent. Spelling errors in pages
Acceptance testing is the conformance of requirements by the end customers or it is their approval for what has been delivered [31]. In our thesis as there are no customers we have ignored the acceptance testing part of the v model.
2.3 Exploratory testing
In the recent past Exploratory testing (ET) has been gaining tremendous importance due to responsibility of individual tester in finding defects early in the software test cycle. ET is a manual testing practice in software testing. Many authors have defined ET but the most widely accepted one is given by James Bach. According to Bach [3] ET is simultaneous learning, test design and test execution. He also explained ET as Any testing to the extent that the tester actively controls the design of the tests as those tests are performed and uses information gained while testing to design new and better results[3]. Another established definition was given by kaner [18] in which he defines ET as an approach to testing that emphasizes the freedom and responsibility of each tester to continually optimize the value of his work done by treating learning ,test design, and test execution as mutually supportive activities that run in parallel throughout the project.
ET is quite opposite to traditional testing approaches that use the concept of predefined test cases. ET stresses the need for using testers‟ skills rather relying on predefined test cases [5]. Earlier ET was called as ad hoc testing [3], due to its close nature to ad hoc testing. ET only relies on tester skills and does not follow any particular procedure for testing. There is no lengthy documentation in ET. Human intelligence and other human personality traits play an important role in detecting defects [6]. Even though ET looks like unplanned approach it is still structured and planned approach in testing [10]. There have always been misconceptions associated about ET that were proven false and are reported in [32]. In fact ET is promoted as a valid approach and valuable part of effective set of quality assurance practices [11]. The following were the characteristic properties of ET that were reported by [32].
ET provides complete coverage of the application. ET is a structured approach.
ET doesn‟t lack transparency and visibility. ET requires less time than scripted testing. ET can be applied to complex systems.
ET testers need training.
ET testers have same skill set as that of scripted tester.
Testers in exploratory testing learn about the product, its weakness, about the market of the product, specific areas in which the product could fail as they progress in the testing of the product [5]. The following characteristics of ET were identified and reported by [45] as
Interactive Creativity
Drive down fast results
Concurrence of cognition and execution
ET is a structured process conducted by a skilled tester, or by less skilled testers or users working under reasonable supervision [35]. The structure of ET comes from the following [35]
Test design heuristics Chartering
Time boxing
Perceived product risks The nature of specific tests
The structure of product being tested The process of learning the product Development activities
Constraints and resources offered by the project The skills, talents, and interests of the tester The overall mission of testing
Juha Itkonen and Rautiainen [11], have discussed the following five properties of ET.
ET is testing without mission, instructions and with test cases not given in advance.
When a tester uses user manual his results are guided by earlier performed tests.
ET aims at detecting defects instead of using comprehensive set of test cases. It is simultaneous learning of system under test, test design and execution. ETs effectiveness relies on tester‟s knowledge, skill and experience.
2.3.1 Benefits of ET
Apart from these characteristics ET has many benefits which are reported by [3] [11][40][5][11] such as
Rapid feedback
Quick learn ability about the product Diversifying the testing process Finding important bugs in short time Cross check of other tester work Isolation of particular defect Non reliance on documentation.
In software testing community, there are many manual testing practices of which exploratory testing saves a lot of resources for the organization. In addition to the above benefits there are additional advantages of ET [3][31][40] such as
Improvising on scripted tests Interpreting vague test instructions Product analysis and test planning Improving existing tests
Writing new test scripts
Regression testing based on old bug reports
Testing based on reading the user manual and checking each assertion. Some of the short comings of exploratory testing are listed below [11]
Difficulty of tracking the progress of individual testers
It is considered hard to find out how work proceeds because there is no planned low-level structure that could be used for tracking the progress. ET has no capability of preventing the defects.
Scripted testing has the ability to detect defects early at requirements gathering and design level.
3.
E
XPERIMENT
Experiments are launched when we want to control the situation and manipulate behavior. The effect of the manipulation is measured and based on this, statistical analysis is performed. To access and compare the effectiveness of different techniques, controlled experiments are powerful [48]. Our main idea of experiment is from the future work of [11], which says that experiments are to be conducted with students to know the effect of using different techniques in exploratory testing. We would like to experiment exploratory testing at different test levels to know how ET works and test its efficiency. Therefore Experiment is the most suitable research methodology to know the cause and effect of ET at different test levels for our research. After performing literature review we came to know that there is lack of study on ET with software test levels. Therefore experiment was conducted keeping in mind it is useful to practitioners and researchers in academia as well as industry people.The thesis is suitable to researchers as well as Practitioners in field of software testing and exploratory testing who are looking to explore new horizons of ET with software test levels.The experiment is performed as per the experiment process as suggested by Wohlin et al. [13].
Pilot Experiment
A pilot experiment was conducted with the help of two industry practitioners. All the objects, instruments and tools were provided to them and then they were asked to find defects in the code. The average time of the two practitioners was considered for the final experiment in the thesis.
3.1 Experiment Definition
The aim of this experiment is to assess the effectiveness of ET in detecting defects at the three testing levels of unit, integration and system.
3.1.1 Object of the study
According to Wohlin et al. [13], an object of study is the entity that is studied in the experiment. The object in our experiment is ET which is being tested for its effectiveness at the three testing levels of unit, integration and system. The object in our experiment could also be taken as the software under test (SUT), which in our case is a website developed specifically for the purpose of meeting our objectives.
3.1.2 Purpose
"The purpose of the experiment is to test if ET is able to find all the seeded defects at the three levels of unit, integration and system levels of testing."
3.1.3 Quality focus
The primary effect under study in this experiment is the effectiveness of ET in finding seeded defects at the three levels of unit, integration and system testing.
3.1.4 Context
The subjects in the experiment are students of MSc Computer Sciences at Blekinge Institute of Technology, Sweden. The subjects will be testing a web application at the three levels of unit, integration and system. We can characterize our experimental context as "multi-test within objects" study [13] as we are examining a single object across a set of subjects.
3.1.5 Perspective
The experiment results are interpreted from the viewpoint of a researcher.
Based on the above elements of an experiment definition, we can now define our experiment:
Analyze ET, for the purpose of evaluating whether it can detect all the seeded defects at the three levels of unit, integration and system test (with respect to ET's effectiveness) from the point of view of the researcher in the context of a multi-test within objects study.
3.2 Experiment Planning
3.2.1 Context Selection
The context of our experiment is on-line with students as subjects. We have a scaled-down website as our SUT.
3.2.2 Hypothesis formulation
According to Wohlin et al. [13] hypothesis formulation is basis for statistical analysis in an experiment. Experiment definition is formulated into two hypothesis null and alternative hypotheses. In null hypothesis there are no underlying trends in the experiment. Alternative hypothesis is accepted when null hypothesis is rejected. The following are the null and alternative hypotheses for our experiment.
3.2.2.1Null Hypotheses, H0
ET detects all the defects seeded at Unit, Integration and System level.
Ho1: ET detects all the defects seeded at unit level.
Ho2: ET detects all the defects seeded at integration level.
Ho3: ET detects all the defects seeded at system level.
3.2.2.2 Alternative Hypotheses, H1
ET does not detect all the defects seeded at Unit, Integration and system levels of testing.
Hi1: ET does not detect all the defects seeded at unit level.
Hi2: ET does not detect all the defects seeded at integration level.
Hi3: ET does not detect all the defects seeded at system level.
3.2.3. Selection of subjects
The subjects for the experiment were Master students in software engineering with
Blekinge Institute of Technology. The subjects were selected based on the pre assessment conducted by the authors. Subjects with the basic knowledge of .NET and who have done the course verification and validation were chosen to test the web application. The motivation for choosing subjects from this course is that students in this course are taught testing methods.A brief explanation was given to the students for a period of about 15 minutes in the form of user guide (See appendix B for user guide). The user guide includes explanation about software test levels and the testing technique they are going to use in the experiment. Subjects were then asked to test a web application (see appendix c) which was a purchase management system for a period of sixty minutes
3.3 Experimental design
There are three important design principles as in [13]: randomization, blocking and balancing.
Randomization applies on the allocation of objects, subjects and in which order the tests are performed [13]. The selection of subjects for our experiment was pseudo-random, meaning we selected subjects based on a screening. The screening was done to ensure the subjects had knowledge of .NET, testing levels and methods. Since
there was only one treatment at a time (i.e., testing at a particular level) and only one software under test (SUT), all the subjects were given the same treatment and SUT at testing at a particular level.
Blocking is used to eliminate the undesired effect in the study [13]. We used blocking in our experiment by screening the subjects, as described in the last paragraph.
Balancing is about assigning each treatment to an equal number of subjects. Our design is balanced as each treatment was assigned to an equal number of subjects.
3.3.1 Experiment design type
There are basically four standard design types for which statistical analysis methods are suitable. They are
o One factor with two treatments
o One factor with more than two treatments o Two factors with two treatments
o More than two factors each with two treatments
Our experimental design type is one factor with more than two treatments. The factor is exploratory testing while the treatments are three, one each corresponding to the three levels of testing.
Table 1 gives an overview of the design type used in the experiment.
Table 1: Experiment design
Factor Subjects Treatment
1.Unit 2.Integration 3.System
Exploratory testing
35 X X X
35 X X X
3.4 Instrumentation
There are three types of instruments which are included in the planning phase of an experiment namely objects, tools and guidelines, these are prepared beforehand of the experiment [13].
Objects: The object in the experiment was web application which was developed by the authors which contained induced defects by the authors. The web application was developed using C#, ASP. Net and for the back end of the web application SQL server database was used. Guidelines: At the outset, the subjects were given preliminary training about exploratory testing and software test levels in the form of user guide see appendix B. The tasks for subjects were made clear and their requirements regarding the web application testing i.e. purchase management system testing were made clear.
Measurements: Data collection was done in the form of word files (see appendix A), finally the data collected from the each subject was converted in excel for analysis.
3.5Experiment execution
The experiment was conducted with 35 Master students in Software engineering and computer science at Blekinge Institute of Technology. A total of fifty students were invited to experiment out of which 40 responded. Based on the pre assessment 35 students were finalized for the experiment. The date of the experiment was then informed to the participants. All the instruments, i.e., objects, guidelines and forms (see appendix A) necessary were available before the start of the experiment.
The total duration of the experiment was 75 minutes. Out of which first fifteen minutes of the experiment were for training. The subjects (students) were then explained about goal of the experiment, ET and test levels. The remaining sixty minutes were for finding the defects at three levels UT, IT and ST. Thirty minutes were given to identify defects at unit level, fifteen for Integration level and fifteen for System level.
The experiment was conducted on two occasions due to the fact that paying attention to thirty five people at once was difficult. On the first occasion twenty students
participated and in the next fifteen. Since ET is a random approach no test cases were provided to the subjects. The subjects then recorded the bugs in the sheet. Figure 3 gives an overview of experiment execution.
ET
training ET at ST Execution ET training ET at IT Execution ET training ET at UT Execution
Figure 3: Experiment execution
10:00 10:15 10:45 11:00 11:15
Time Testing
4.
R
ESULTS AND
A
NALYSIS
4.1 Results
In this section the results are analyzed. The data of the result is analyzed by using design from experiment which is “one factor with more than two treatments”. For doing statistical tests, we initially performed normality on the data sets obtained after applying ET on different software test levels. Normality of different software test levels is identified using Shapiro-Wilk tests. The level of significance is set to 0.05 [13]. By using normality tests, parametric and non-parametric are classified and selection of appropriate statistical tests is decided [13]. In our case, Unit and System level tests come under non-parametric as their significant value is (Unit Level .002, System Level .012) and Integration level comes under parametric tests as its significant value is .005. For parametric tests we used two sample t-test and non-parametric tests used is Wilcoxon test [13].We used two sample t-test to analyze the results of Integration level and Wilcoxon test to analyze results of Unit and Integration levels. The qualitative data collected after the experiment is given in Table 2.
Table 2: Descriptive statistics of experiment Subjects Seeded Defects at Unit level Defects after experiment at Unit level Seeded Defects at Integrati on level Defects after Experiment at Integration level Seeded Defects at System level Defects after experiment at System level 1 20 17 5 3 5 5 2 20 20 5 5 5 4 3 20 20 5 5 5 5 4 20 20 5 5 5 3 5 20 20 5 5 5 5 6 20 13 5 4 5 2 7 20 20 5 2 5 5 8 20 15 5 4 5 4 9 20 8 5 2 5 3 10 20 20 5 5 5 4 11 20 20 5 3 5 2 12 20 17 5 2 5 4 13 20 11 5 5 5 4 14 20 6 5 5 5 2 15 20 12 5 2 5 4 16 20 20 5 0 5 0 17 20 19 5 2 5 3 18 20 12 5 3 5 3
19 20 17 5 1 5 2 20 20 12 5 1 5 2 21 20 9 5 4 5 2 22 20 20 5 3 5 3 23 20 4 5 2 5 3 24 20 6 5 4 5 5 25 20 4 5 2 5 5 26 20 5 5 4 5 4 27 20 8 5 1 5 3 28 20 10 5 2 5 4 29 20 8 5 1 5 2 30 20 9 5 2 5 3 31 20 3 5 2 5 1 32 20 4 5 2 5 4 33 20 13 5 3 5 4 34 20 5 5 2 5 3 35 20 3 5 3 5 3
Table 3: Overview of parametric/non-parametric tests for different designs [13]
Design Parametric Non-Parametric
One factor, one treatment
Chi-2 Binomial Test One factor, two
treatment, completely randomized design t-test F-test Mann-Whitney Chi-2 One factor, two
treatment, paired comparison
Paired t-test Wilcoxon
Sign Test One factor more than
two treatments
ANOVA Kruskal-Wallis
Chi-2
More than one factor ANOVA
The experiment design type is one factor with more than two treatments for the whole of experiment, but since we analyzed the individual test levels statistically, so we reduced our treatments to any one of unit, integration and system, one at a time. Therefore Wilcoxon rank sum test is more suited for a non-parametric test. For parametric test, two sample t-test is suitable.
4.2 Normal Distribution
Normal distribution in general is identified as normal curve which looks like “Bell-shape”. Generally normal distributions differ with respect to means and standard deviations [42].Skewness refers to out of line or distorted on one side or blindness of data in left or right side. Kurtosis is the measure of the peakedness of a probability distribution; a normal distribution has 0 kurtosis [41].
Table 4: Tests of Normality(Unit Level) Shapiro-Wilk
Statistic df Sig.
Unit Level .886 35 .002
At unit level the significant value of shapiro-wilk is 0.002 respectively which is less than most significant P-value (0.05). This means at unit test level Non-Parametric test Wilcoxon is needed for statistical test.
Table 5: Tests of Normality(Integration Level) Shapiro-Wilk
Statistic df Sig.
Integration level .904 35 .005
At integration level the significant value of shapiro-wilk is 0.005 which means that shapiro-wilk test p-value is 0.005 and therefore parametric test is suitable. This means at integration test level parametric test two sample t-test is selected for statistical test.
Table 6 : Tests of Normality(System Level) Shapiro-Wilk
Statistic df Sig.
System Level .917 35 .012
At System level the significant value of shapiro-wilk is 0.012 which is less than most significant P-value (0.05). This means at system test level Non-Parametric test Wilcoxon is needed for statistical test.
4.3 Unit Level using Wilcoxon Test
Wilcoxon test is used as an alternative to T-test [13], this test is used to determine which of measures in a pair is greater than the other with the help of rank differences.
Wilcoxon test is conducted to evaluate whether defects at seeded level are greater than defects detected at unit test level for ET.
Defects at unit level are analyzed by using Wilcoxon test and the results are shown below with their descriptive statistics and ranks.
Finally with the help of hypotheses testing at unit level, acceptance or rejection of null hypotheses is checked.
Table 13 :Descriptive Statistics at unit level
N Mean Std. Deviation Minimum Maximum Seeded Defects 35 20.00 .000 20 20 After Experiment Defects 35 12.34 6.273 3 20
Table 14: Test Statistics
UnitLevel_AfterExp
- Seeded_UnitLevel
Z -4.496b
Asymp. Sig.
Table 15: Ranks
N Mean Rank Sum of Ranks
Unit test Level Negative Ranks 26a 14.46 376.00 Positive Ranks 1b 2.00 2.00 Ties 8c Total 35
a. After Experiment Defects at Unit Level< Seeded Defects at Unit Level
b. After Experiment Defects at Unit Level > Seeded Defects at Unit Level
Decision Rule: Asymp.(Sig)< 0.05
Decision Taken: Reject the Null Hypothesis(Ho1)
Null Hypothesis(Ho1): ET detects all the defects seeded at Unit level
Alternate Hypothesis(Hi1): ET does not detect all the defects seeded at Unit level
Table 13, 14 & 15: Wilcoxon statistical test at Unit Level
The statistical results are analyzed in the following steps by using table 13, 14 & 15
Step 1: Assumption of Hypothesis
Null hypothesis states that “there is no difference in seeded defects vs. defects detected by subjects” [46]. Our null hypothesis assumption is stated below as
Null Hypothesis (H0.1)
:
ET detects all the defects seeded at Unit level.Alternative Hypothesis states that “there is a difference seeded defects vs. defects detected by subjects” [46]. Our alternative hypothesis assumption is stated below as Alternate Hypothesis (Hi.1)
:
ET does not detect all the defects seeded at Unit level.Step 2: Significant value
Significance level or α = 0.05 which is the probabilistic value or commonly used p-value.
Step 3: Test statistic
From the table 15, the mean of negative rank (14.46) is higher than mean of positive rank (2.00). From the table 15 'a' denotes that, defects detected by subjects are less than seeded defects. Asymp. Sig. (2-tailed) which is P-value or significant value is 0.000 from the table 14 which is exponentially a small value. Test statistic is statistically significant if α<0.05.
Step 4: Conclusion
P-value ~ 0.001 ~ (α<0.05)
The above notation shows that there is statistically significant difference between seeded defects and defects detected by subjects. We conclude from Wilcoxon test that ET does not detect all the seeded defects seeded at unit level.
4.3.1 Hypothesis testing at Unit test level
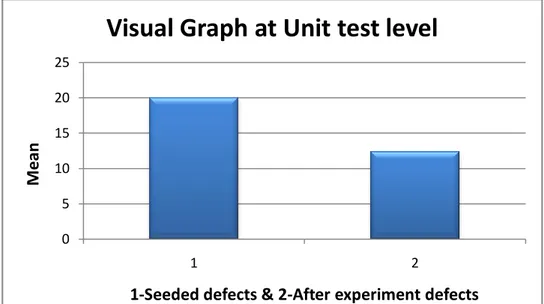
The results indicated from the statistics in figure 4 indicates p<0.05.The smaller the p-value, the more convincing is the rejection of null hypothesis (H01) [43]. The
significant value is .001 from the figure 4 shows that p-value is less than 0.05.Therefore null hypothesis is compared with alternate hypothesis and alternate hypothesis is accepted which means that ET does not detects all the defects seeded at unit level. Bar graph is used to visually display statistical results.
Table 7: Hypothesis Summary at Unit level
Hypothesis Null or
Alternate Hypothesis
Significant Decision
ET does not detect all the defects seeded at unit level.
Alternate Hypothesis
0.001 Reject the Null
Figure 4: Bar graph visualizing Unit Level Defects
From the above figure 7, it is clearly showing that mean of seeded defects (20) at unit level is higher than mean of defects detected after performing (12.34) experiment. Therefore Alternative Hypothesis (Hi1) is accepted which states that, ET does not
detect all the defects seeded at unit level and is visually shown with the help of bar graphs showing means in the y-axis and seeded defects, defects detected after experiment on x-axis.
4.4 Integration Level using Two Sample T-test
Two sample t-test is the simple t-test which is used to compare sample populations and checks whether there is significant difference between their means or not. The result obtained from the test is „t‟ value, when is then used to determine the significant value or p-value[49].
T-test is also to compare the actual difference between two means in relation to the variation in the data [50].
T-test takes two sets of data then calculates the means, standard deviations and standard errors. Based on „t‟ value and p-value obtained through statistical tests ,statistical significance between means or populations can be determined.
Defects at integration level are analyzed by using two sample t-test and the results are tabulated as below with their descriptive statistics.
0 5 10 15 20 25 1 2 M e an
1-Seeded defects & 2-After experiment defects
Visual Graph at Unit test level
Finally with the help of hypothesis testing at integration level, acceptance or rejection of null hypothesis is checked.
Table 16 : Group Statistics
Integration Test level N Mean Std. Deviation Std. Error Mean Descriptive statistics seeded 35 5,00 0,000 0,000 after experiment 35 2,89 1,430 ,242
Table 17: Two Sample T-test
Test for Equality of
Variances T-test for Equality of Means
F Sig. t df Sig. (2-tailed) Mean Difference Std. Error Differe nce 95% Confidence Interval of the Difference Lower Upper Seeded and After experime nt defects values Equal variances assumed 91,314 ,001 8,746 68 ,000 2,114 ,242 1,632 2,597 Equal variances not assumed 8,746 34,000 ,000 2,114 ,242 1,623 2,606
Figure : Two Sample T-test at Integration Test level
Decision Rule: p-value (Sig.)< 0.05
Decision Taken: Reject The Null Hypothesis(Ho2)
Null Hypothesis(Ho2):ET detects all the defects seeded at Integration level Alternate Hypothesis(Hi2):ET doesn’t detect all the defects seeded at Integration level
Table 16, 17: Two Sample T-test at Integration test level
The table 16 indicates mean for seeded defects at integration level is 5.00; the mean for defects after experiment is 2.89.the standard deviation for seeded defects at integration level is 0.00, the standard deviation for defects after experiment is 1.430.The number of participants or subjects are 35.
The paired t-test statistics results are analyzed in the following steps by using tables 16, 17
Step 1: Assumption of Hypothesis
Null hypothesis states that “there is no difference in seeded defects vs. defects detected by subjects” [46]. Our null hypothesis assumption is stated below as
Null Hypothesis (H0.2)
:
ET detects all the defects seeded at integration level.Alternative Hypothesis states that “there is a difference seeded defects vs. defects detected by subjects” [46]. Our alternative hypothesis assumption is stated below as Alternate Hypothesis (Hi.2)
:
ET does not detect all the defects seeded at integration levelStep 2: Significant value
Significance level or α = 0.05 which is the probabilistic value or commonly used p-value.
Step 3: Test statistic
From the table 17 Sign-value indicates that one pair set of means are not equal. From the means matrix we conclude that there is statistical difference between seeded defects and defects found by experiment. P-value or significant value from the figure 5 is 0.001 .Test statistic is statistically significant if α<0.05.
Step 4: Conclusion
P-value ~ 0.001 ~ (α<0.05)
The above notation shows that there is statistically significant difference between seeded defects and defects detected by subjects. Since that the mean number of seeded defects is (5.00) which is greater than mean number of defects detected by subjects which is (2.89) from figure 16, we conclude from two sample t-test that there is significant difference between the seeded defects and defects detected by subjects during experiment at integration level.
4.4.1 Hypothesis testing at Integration level
The results indicated significant difference is equal to 0.001, p-value<0.05.The smaller the p-value, the more convincing is the rejection of null hypothesis (H0) [44]. As seen in table. Descriptive statistics at integration level, the mean of seeded defects (5) at integration level is greater than defects after experiment (2.89). The significant value is .001 from the figure 5 shows that p-value is less than 0.05.Therefore null hypothesis (H02) is compared with alternate hypothesis (Hi2) and alternate
hypothesis is accepted which means that ET does not detect all the defects seeded at integration level. Bar graph is used to visually display statistical results.
Table 8 Hypothesis Summary at integration level
Hypothesis Null or
Alternate Hypothesis
Significant Decision
ET does not detect all the defects seeded at Integration testing
Alternate Hypothesis
0.001 Reject the Null
Hypothesis
Figure 5: Bar graph visualization of integration level defects
From the above figure 8, it is clearly showing that mean of seeded defects (5) at integration level is higher than mean of defects detected after performing (2.89) experiment. Therefore Alternative Hypothesis (Hi2) is accepted which states that, ET
does not detect all the defects seeded at integration level and is visually shown with the help of bar graphs showing mean in the y-axis and seeded defects, defects detected after experiment on x-axis.
4.5 System Level using Wilcoxon test
Wilcoxon test is used as an alternative to T-test [13]; this test is used to determine which of measures in a pair is greater than the other with the help of rank differences. 0 1 2 3 4 5 6 1 2 M e an s
1-Seeded defects & 2-After experiment defects
Visual Graph at Integration test level
Wilcoxon test is conducted to evaluate whether defects at seeded level are greater than defects detected at system test level for ET.
Defects at system level are analyzed by using Wilcoxon test and the results are shown below with their descriptive statistics and ranks.
Finally with the help of hypotheses testing at system level, acceptance or rejection of null hypotheses is checked.
Table 18: Descriptive Statistics
N Mean Std. Deviation Minimum Maximum
SeededDefects 35 5.00 .000 5 5
AfterExperiment
Defects 35 3.29 1.226 0 5
Table 19: Test Statistics
System test level
Z -4.757b
Asymp. Sig. (2-tailed) .001
Table 20: Ranks
N Mean Rank Sum of Ranks
System Test Level Negative
Ranks
29a 15.00 435.00
Positive Ranks 0b .00 .00
Ties 6c
Total 35
a. After Experiment Defects at System Level < Seeded Defects at System Level b. After Experiment Defects at System Level > Seeded Defects at System Level
Decision Rule: Asymp.(Sig)< 0.05
Decision Taken: Reject the Null Hypothesis(Ho3)
Null Hypothesis(Ho3): ET detects all the defects seeded at System level
Alternate Hypothesis(Hi3): ET does not detect all the defects seeded at System level
The wilcoxon statistics results are analyzed in the following steps by using table 18, 19 & 20.
Step 1: Assumption of Hypothesis
Null hypothesis states that “there is no difference in seeded defects vs. defects detected by subjects” [46]. Our null hypothesis assumption is stated below as
Null Hypothesis (H0.3)
:
ET detects all the defects seeded at system levelAlternative Hypothesis states that “there is a difference seeded defects vs. defects detected by subjects” [46]. Our alternative hypothesis assumption is stated below as Alternate Hypothesis (Hi.3)
:
ET does not detect all the defects seeded at system level Step 2: Significant valueSignificance level or α = 0.05 which is the probabilistic value or commonly used P-value.
Step 3: Test statistic
From the table 20, the mean of negative rank (15) is higher than mean of positive rank (0.00). From the table 20 'a' denotes that, defects detected by subjects are less than seeded defects. Asymp. Sig. (2-tailed) which is P-value or significant value is 0.000 from the table 19 which is exponentially a small value. Test statistic is statistically significant if α<0.05.
Step 4: Conclusion
P-value ~ 0.001 ~ (α<0.05)
The above notation shows that there is statistically significant difference between seeded defects vs. defects detected by subjects. Since that the mean number of seeded defects is (5) which is greater than mean number of defects detected by subjects which is (3.29) from table 18,we conclude that from Wilcoxon test there is significant difference between the seeded defects vs. defects detected by subjects during experiment at system level.
4.5.1 Hypothesis testing at System test level
The results indicated from the statistics in table 20 indicates p<0.05.The smaller the p-value, the more convincing is the rejection of null hypothesis (H03) [43]. The
0.05.Therefore null hypothesis is compared with alternate hypothesis and alternate hypothesis is accepted which means that ET does not detects all the defects seeded at system level. Bar graph is used to visually display statistical results.
Table 9: Hypothesis Summary at System level
Hypothesis Null or
Alternate Hypothesis
Significant Decision
ET does not detect all the defects seeded at system level.
Alternate Hypothesis
0.001 Reject the Null
Hypothesis
Figure 6: Bar graph visualization of system level defects
From the above figure 9, it is clearly showing that mean of seeded defects (5) at system level is higher than mean of defects detected after performing (3) experiment. Therefore Alternative Hypothesis (Hi3) is accepted which states that, ET does not
detect all the defects seeded at system level and is visually shown with the help of bar graphs showing means in the y-axis and seeded defects, defects detected after experiment on x-axis. 0 1 2 3 4 5 6 1 2 M e an
1-Seeded defects & 2-After experiment defects
Visual Graph at System test level
5.
D
ISCUSSION
5.1 Observation
Our research focused on effectiveness of ET in finding seeded defects at the three levels of unit, integration and system testing. The results obtained from the experiment are mathematically studied by using different statistical tests like Wilcoxon and paired-t test and visually analyzed with the help of Bar graphs. Based on the results we conclude that ET is effective with minimum amount of documentation moreover testing process takes minimal time.
Experimentation of ET testing, at different test levels in web application didn‟t yield better results. But the beneficial aspects of using ET are that subjects didn‟t use any specific techniques or methods during testing. Subjects used their technical skills and creativity to find more defects. The results of the experiment revealed that effectiveness of finding defects at unit, integration and system software test levels are less than seeded defects in web application. The application of knowledge or technical skills has the main effect on the ability to find defects. Subjects having good testing and object oriented programming skills are able to find seeded defects easily.
Sometimes subjects needed help or advice during experimentation even though user manual is provided to them; one of the authors acted as an instructor and helped subjects while performing experiment. The defects in the web application was maintained confidentially and they were not discussed with subjects .sometimes subjects got bored after performing experimentation, at this time break or snacks is provided to subject to give some relaxation and we believed that if the subjects lose interest on the testing it had effect on result, it is also seen with some subjects defects result. The time factor has also its effect on result of finding defects, some subjects needed more time than what we have given but we have restricted time to limited. The reasons for the rejection of null hypothesis at three test levels is that subjects we have selected might be
Inexperienced in testing web applications even though they have working experience on object oriented programming technologies
Ability to explore defects
Interest towards experimentation process.
We have used web application with a few web pages and database design, a similar experiment with more functionalities should be done in future with big web
applications like MVC frameworks, enterprise applications to be able to generalise results.
5.2 Validity Threats
Validity is the fundamental question which states that how far the experimental results are valid [13]. Validity threats are classified into four types as internal, external, construct and conclusion threats. These threats are mapped to different stages of experiment as described below.
5.2.1Internal validity
An internal validity threat says that, a relationship exists between independent and dependent variables [13].
-Maturation: Maturation is that the performance of detecting defects. In our experiment, at the outset it is good but performance decreases once experiment goes on after 45 minutes at different test levels, the reason might be due to fatigue. In order to mitigate this threat break is provided for the subjects.
-Selection: Experienced vs. inexperienced subjects may have an impact on dependent variable. Some of the subjects who are having good experience on object oriented programming did well in identifying defects, However we cannot infer that inexperienced subjects are not good in testing, they also performed testing well with good results equivalent to experienced subjects. An effort was made so that experienced and inexperienced subjects were at same level by providing little training to inexperienced students.
-Mortality: Experimental mortality is that whether any subjects dropped out while performing experiment because this will have impact on the dependent variable, No subject dropped out of the experiment instead in our case few subjects got tired at different test levels.
5.2.2External validity
External validity is considered as the degree to which the results are generalized with other group‟s settings.
Wrong Selection of subjects: One of the threats is related to wrong selection of students as subjects for the experiment; reason is that in general software developers
generally perform unit testing and integration level but all students who are involved in verification and validation course need not have software development knowledge. To overcome this threat we ensured that we select right students as subject for the experiment. We made sure that we take students who have experience in software development as well as software testing.
Wrong place or environment: One of the threats associated with external validity is setting and environment. Complex applications take lot of time for the tester to understand its working in exploratory testing. To avoid this threat we have used simple application with a few web pages with seeded defects.
5.2.3Construct validity
Construct validity is generalizing the results of the experiment to the concept or theory behind the experiment [13].
-Inadequate description of constructs: One of design threats related to our experiment is inadequate description of constructs used to measure effectiveness of ET. We have mitigated this threat by defining ET effectiveness as the number of defects found by the subjects compared to total number of defects at each level. We have also statistically analyzed by comparing this with the most significant value. -Evaluation apprehension: One of the Social threats to our study is evaluation apprehension, which means fear of being evaluated. In order to mitigate this threat we have maintained anonymity of data received from the subjects. The results like defect recordings and data sets were neither changed nor revealed to anyone. Ethical values are considered sincerely during the experiment execution and afterwards.
5.2.4Conclusion validity
Conclusion validity threats deal with the issues that affect the ability to draw correct conclusion from the treatment and the outcome [13].
-Low statistical power: Different statistical tests are used to test the significance value and evaluate the conclusion. However there may be chances of having low statistical power due to single statistical test, this can be seen as a limitation of this study.
-Random irrelevancies: There may be disturbances of noise from outside or some sudden interrupt while conducting experiment, to overcome these random irrelevancies in experimental setting subjects are invited to conduct experiment in lab environment and subjects are requested to switch off their mobiles during experimentation.
5.3 Evaluation of experimentation results
5.3.1 Mapping RQs to Obtained results
This section summarises and answers research question.
RQ: Can ET detect all the defects seeded at unit, integration and system levels of testing?
We have studied many exploratory testing practices available in the literature. From the analysis of study we framed our research questions successfully and tried to fill the research gap with the help of experiment. The experiment helped us to examine the effectiveness of ET in finding seeded defects. The results of research indicate that ET doesn‟t detect all the seeded defects at each of the three levels. Alternate hypotheses at three levels were accepted in our experiment.
![Figure 1: Testing hierarchy [14]](https://thumb-eu.123doks.com/thumbv2/5dokorg/5440875.140640/15.892.99.830.282.827/figure-testing-hierarchy.webp)


![Table 3: Overview of parametric/non-parametric tests for different designs [13]](https://thumb-eu.123doks.com/thumbv2/5dokorg/5440875.140640/28.892.129.788.115.555/table-overview-parametric-non-parametric-tests-different-designs.webp)