Use of climate-based daylight
models for lighting
simulation: A state of the art
review of the literature
published between 2010 and
2020
Kaiyun Jiang
MASTER THESIS 2021
Master in Product Development with a specialization
SUSTAINABLE BUILDING INFORMATION MANAGEMENT
This thesis work has been carried out at the School of Engineering in Jönköping in the
subject area Product development - Sustainable Building Information Management. The
work is a part of the Master of Science with a major Product development, specialization
in Sustainable Building Information Management.
The authors take full responsibility for opinions, conclusions and findings presented.
Examiner: Mathias Adamsson
Supervisor: Myriam Aries
Scope: 30 credits (second cycle)
Date:2021/06/11
ADDRESS:School of Engineering, P.O Box 1026, SE-551 11 Jönköping, Sweden
VISIT:Gjuterigatan 5, Campus, Building E
PHONE:+46 (0)36 10 10 00 WEB:www.ju.se
Use of climate-based daylight models for lighting simulation: A state of
the art review of the literature published between 2010 and 2020
Kaiyun Jiang
Jönköping University, Jönköping 551 11, Sweden jika8cd@student.ju.se
Abstract. Climate-based daylight modelling (CBDM) development, aiming for appropriate sky
modelling, has attracted quite some attention during the last years. Ten years ago, it was a challenge to simulate luminous environment dynamics. Over the years, the accuracy of climate models has improved and the need for high precision daylight simulations has been met along with the development of daylight calculation methods. This paper reviews the latest technologies released between 2010 and 2020 for lighting simulation relevant to building science research. After reviewing the development of climate models, advances in daylight calculation methods are discussed. The results of the study show that the accuracy of simulation results has improved significantly based on high precision daylight simulations, but also pose problems of simulation time and simulation feasibility.
Keywords: climate model, lighting simulation, image-based model discrete models, daylight
calculation method
1
Introduction
Lighting simulation plays a crucial role in (day)lighting design to reduce energy waste and help provide a comfortable and attractive indoor environment [2,19,24]. In the last decade, daylight simulation has progressed from a static assessment to a dynamic simulation, which has brought many developments in how the efficiency of a daylit space can be analyzed numerically. During this period, a technique known as climate-based daylight simulation (CBDM) has attracted considerable attention [5,21,25]. The technology predicts the various radiant or luminous quantities based on solar and sky conditions derived from standard meteorological datasets [14]. It accelerated the traditional light assessment and gradually replaced traditional daylighting evaluations, i.e., those based on a single point-in-time condition (e.g., the CIE standard overcast sky). Ten years ago, it was a challenge to simulate complex, long-term luminous environment dynamics, but computational modelling capacity has improved significantly over the years. In the design phase, light and energy simulation tools play a crucial role in controlling daylighting for occupants' visual comfort and regulating solar heat gains to improve building energy efficiency [38,39]. Accurate lighting simulation is necessary to satisfy visual performance requirements, predict daylight glare/discomfort, analyse daylight through a complex fenestration system (CFS), and select daylight-responsive control systems [6,7,9] .
With the development of this trend towards climate-based daylight simulation, the research focus shifted to simulation of complex fenestration systems (CFS) simulation [6,7,9]. The simulation object is no longer a single rectangular room with a window system that incorporates glazing as a transparent surface,
but a complex fenestration system that comprises different shading components. It can include layers that provide shading (e.g., fabric shades, louvered blinds, and metal mesh systems), and layers that improve interior daylighting (e.g., prismatic films and mirrored systems) [27].
In 2011, Ochoa et al. [22] conducted a literature review and examined the state of the art of lighting simulation at the time related to architectural scientific research [22]. A section was dedicated to describing the use of light simulation in the architectural design process. At that time, integrating lighting simulation within the whole building simulation was still largely under development. After 2011, Ayoub [1] published an article reviewing daylight simulation tools (DST) evaluation criteria and basic inputs for daylight prediction. He concluded that previous work had focused on simulation technology and the simulation tools advancement. Since the results of daylight simulation heavily depend on the accuracy of sky models [17], it is necessary to explore the changes in the daylight calculation method by high-precision climate models in the context of climate model advances. Therefore, the purpose of this study is to review the current state of the art of climate-based daylight modelling by investigating the development of climate modelling techniques over the period 2010-2020 and exploring improvements in the daylight calculation methods. All literature used is sourced from a search of the Citation databases, such as, Scopus, and Web of Knowledge. Additionally, if required, information is added from websites of lighting simulation software.
2
Research method
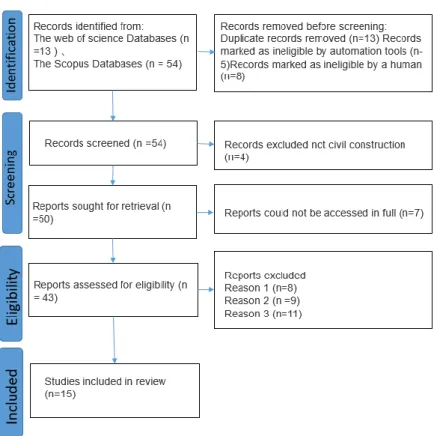
A literature review was conducted to investigate the research published on climate modelling, and it identified specific developments on lighting simulation. The study used the Preferred Reporting Items for Systematic Reviews and Meta-Analyses (PRISMA) method to review literature and to analyse the selected articles in a series of steps as proposed by Moher et al. [33]. Figure 1 presents the applied search and analysis flow which included four main phases: identification, screening, eligibility, and inclusion of studies. In addition, it shows how many bibliographic records were identified and included in this study to guide the review of the material and ensure completeness of reporting.
2.1 Search strategy
A title-abstract-keywords search was conducted to retrieve relevant publications from the Scopus database and the Web of Science’s database. The Scopus database was selected as a data source as it is a major scientific research database and provides researchers with vast amounts of comprehensive information. The Web of Science’s database, as the largest international database, was selected to ensure the comprehensiveness and high reliability of the research data [28]. Two general terms, “lighting simulation” and “climate model”, were included in the search string. Boolean operators and wildcards were used to investigate possible combinations and variations of the keywords relating to the two general terms. The following search string was used: (“daylight* simulat*” OR “light* simulat*") AND (“climat* model*” OR “sky model*” OR “weather model*”). The last search was performed on 17 March 2021 and all articles were imported into Endnote Online [11] for easy data management.
Figure 1.PRISMA Flow Diagram
2.2 Identification of relevant articles and eligibility criteria
Endnote's internal algorithm was used to filter out duplicates, as the algorithm compared the bibliographical information with the remaining records and marked every identical pair. Subsequently, manual screenings were performed on the selected documents to remove any duplicates not found by the algorithm. The articles were then screened based on the following inclusion criteria: (i) Studies focusing on lighting simulation in the construction engineering industry and (ii) studies assessing the impact of different climate modelling techniques on lighting simulations, being the focus of this review. Only English-language journal publications and English-language conference paper were considered. Articles were excluded related to reasons as specified in Table 1. The full text of each article was reviewed according to the exclusion criteria, and a number of irrelevant articles were excluded.
Table 1. Exclusion criteria and their justification
Exclusion Criteria Justification 1 Lack of simulation validation in the
study of climate models.
These studies provide the sky luminance data but without the daylight simulation process.
2 Lack of discussion of climate models in the simulation process.
Lack of analysis of daylight simulation from the perspective of climate model.
3 Dynamic climate models are not used in the simulation process.
It is not the focus of this study to use static climate models in the simulation process.
2.3 Data extraction
Information, as specified in 错误!未找到引用源。, was extracted from each of the selected studies. Table 2. Extraction of information and its justification
2.4 Data analysis
To investigate the effect of different climate models on the accuracy of daylight simulations, the data collected will be categorized according to the type of climate model used. In order to fulfil the objectives of this article, the focus of the research is on the "climate model" and the "daylight calculation method". The results section will summarize the climate models used and daylight calculation methods used in the studies included in the review. In the discussion section, the climate models and daylight calculation methods that have been developed are discussed separately.
3
Results
3.1 PRISMA
By using the search string reported in the methods section, 54 and 13 data records were obtained from the Scopus database and Web of Science’s main collection’s database respectively. After excluding duplicates, 54 articles remained. Four articles were excluded at the screening stage because they were not within the field of Construction Engineering. Seven articles were excluded during the full-text eligibility review as they were not fully accessible. Of the remaining 43 articles, 15 articles were obtained for further study after applying exclusion criteria. The information corresponding to Table 5 was extracted from the 15 articles and is summarized in the appendix.
3.2 Climate models
In total, the 15 articles involved two main categories of climate models: discrete models and image-based models. Table 3 categorizes all climate models used in the 15 articles. Image-based sky models are generated from captured fisheye images of the sky dome. HDR photography captures a wide range of variations in the sky, including the surrounding solar region [12]. A discreet sky model is one in which the sky is subdivided into a limited number of patches [13]. The discreet sky model originally divided the sky model according to the Tregenza subdivision [41], and higher resolution subdivision schemes (e.g., Tregenza/Reinhart MF:2) were found to be used in the 15 articles collected. Each patch is subdivided again to obtain a smaller stereo angle of the solar sphere.
Data Justification
Daylight calculation method Statistics on which lighting calculation methods are used and which ones are used most frequently.
Simulation object Understanding the details of the simulated object.
Main technique applied To find which techniques are applied to improve the accuracy of climate models. Climate model Summary of which climate models have been used.
Special scenario applications What special scenarios the new techniques can be applied to and what special objectives can be accomplished (e.g., evaluating shading designs).
Table 3. The climate models applied in the 15 studies
Climate model Reference Year
Image-based models
HDR-generated Sky Models [13,15,31,32] 2017
[16] 2018
[12] 2010
[29,30] 2019 Hybrid Photo- Radiometer (HPR) Sky Models [17] 2018
Discrete models Tregenza MF:1 [3] 2017
[4] 2016
[5] 2019
Tregenza MF:2 [27] 2011
[18] 2018
[10] 2019
Tregenza/Reinhart MF:4 & Tregenza/Reinhart MF:6 [18] 2018
[10] 2019
3.3 Daylight calculation method
The daylight calculation methods applied in the 15 articles are divided into two main categories: Image-based techniques and climate-Image-based modelling (CBDM) Image-based on mathematical models. To obtain high-resolution climate models, two techniques from the field of computer graphics, high dynamic range (HDR) photography and image-based lighting (IBL), have been applied to the field of daylight simulation. IBL is a visualization technique that renders HDR images used as light sources by capturing them and determining the luminance distribution in the surrounding environment [16]. CBDM based on mathematical models are the most used methods in the 15 studies. A variety of daylight calculation methods are included in this category. Building on the earlier 2-phase method (2-PM) and incorporating CBDM techniques based on Radiance's backward ray-tracing engine, the 3-phase method was created by splitting the flux transfer into three separate phases. The 3-phase model has later been expanded to a five-phase method to improve the sky model used in daylight simulations (i.e., obtaining a more rigorous standard daylight coefficient model) [18]. Overall, five different methods are used, of which the 3-phase (3 PM) and 5-phase (5 PM) models are the most frequently applied. As the CBDM methods involve different sky models, Table 4 summarizes the differences in the sky calculation methods.
Table 4. Discrete models used by different CBDM methods
MF stands for Multiplication Factor and N is the number of times the side of each patch is subdivided,Min. angular resolution: the angular resolution corresponding to each patch.
4
Discussion
The results as found in the 15 studies will be discussed seen from two development perspectives: 1) the development over time of the actual sky/climate model and 2) the development in methods for calculating the daylight distribution in an environment.
4.1 PRISMA
As a well-established evaluation system, PRISMA provides a systematic approach for reviewing the literature. Moreover, literature was searched in two major scientific research databases. Seven articles were not being able to access in full. However, this possible limitation is not considered to have a significant impact on the results. According to figure1, A total of 13 articles were collected by excluding automated tools and manually removing duplicates. It was possible to find that all articles obtained from the Web of Science were duplicates of those obtained by Scopus. This demonstrates that the limitations imposed using PRISMA are within acceptable limits.
4.2 Climate models
4.2.1 Image-based models
To obtain a large amount of data on daylight availability and sky brightness, Kittler et al. [34] carried out long-term measurements at different places around the world by the use of sky scanners. However, their relatively high cost make them less commonly used. High dynamic range imaging (HDRI) is a cheaper and Daylight calculation
method
Reference Year
Algorithm Climate model Number of
subdivisions (N)
Min. angular resolution (°)
DAYSIM [15] 2017 Ray tracing Tregenza MF:1 145 10°-15°
[5] 2019
DC method [27] 2011 Ray tracing Tregenza/Reinhart MF:2 MF:2 = 577 6°
3 phase-method
[18] 2018
Ray tracing Tregenza/Reinhart MF:2 MF:2 = 577 6°
[10] 2019 [5] 2019 [13] 2017 5 phase- method [13] 2017 Ray tracing Tregenza/Reinhart MF:4 for
the sky component MF:4 = 2305 3°
[18] 2018
[30,31] 2017
[29] 2019 Tregenza/Reinhart MF:6
subdivision for the sun component MF:6 =5185 1.5° [5] 2019 [10] 2019 EvalDRC [4] 2016 Photon mapping Tregenza MF:1 145 exact 0.5° angular sun source primitives
more popular alternative for practitioners and researchers [12,30]. Previously, many researchers derived sky models by capturing the sky with single photographs taken with calibrated cameras [26]. Because the single-image approach provides a limited dynamic range of brightness values, it can only be used to derive customized mathematical models and is not used as a direct simulation input [12]. Multiple fisheye lens images can now capture a wide range of variations in the sky, including peripheral regions and cloud distributions, where the pixel values of each image correspond to physical quantities of brightness [12], thus eliminating the need to use sky scanners and mathematical methods for sky model definition.
Inanici and Hashemloo [13]as well as Humann and Mcneil [35] have used the HDR application in a different way by addressing the tendency to easily underestimate the extreme brightness values of the corona when capturing the sky through HDR image techniques. Inanici and Hashemloo et al. [13] ensured an accurate brightness distribution by taking two HDR images simultaneously, separating the solar corona from the diffuse sky component. To ensure that the brightness values of the remaining sky, they calibrated the solar corona and the remaining sky images using direct and diffuse horizontal solar radiation, respectively. The two calibrated HDR images were then fused together to form the sky model. Concentrated light sources were extracted from the HDR images of the sky dome and used as direct (concentrated) light sources in the Radiance mksource procedure. The image-based sky model was validated with horizontal illumination maps and brightness maps [13]. The study concluded that the image-based sky model more accurately modelled the sky brightness distribution than the Perez all-weather sky model and the CIE models (clear, intermediate, and overcast) [12,13,15].
Another way to address the extreme brightness values of the solar corona is to block it out when shooting HDR images. Some researchers [e.g., 13, 35] proposed a hybrid photo- radiometer (HPR) sky model based on the modelled physical description of solar and HDR sky images. Unlike the previous method [13], they used only one camera to capture the diffuse sky and used a black disk to remove the insufficiently captured solar corona when clouds did not occlude the sun. Then, a calibrated HDR image of the diffuse sky component was combined with the solar disk generated in the Perez all-weather sky model to produce an HDR sky. By comparing two solutions, a method was developed a year later by Kong et al. [17], which simplified the procedures of data collection and post-processing even more. In this process, they used only one camera to take mainly diffuse components and shortened the image capture time by reducing the range of exposure values, thus solving the sunlight-induced brightness spillover. In the study, the authors investigated the accuracy of the horizontal HPR sky model in a real environment. They concluded that the luminance maps simulated under the horizontal HPR sky are closer to HDR images than those simulated under the Perez all-weather sky [17].
To obtain a realistic distribution of sky brightness while considering the complexity of the surrounding landscape in the brightness distribution, the HDR image-based embedded photometric device (EPD) was developed by Wu et al. [30] in 2019. The device consists of a microprocessor and a calibrated low-cost image sensor with a wide-angle lens. The method was verified to have a good performance in terms of quality of solar tracking, which can reduce the daylight simulation error by 1/7 to 1/3 compared to the conventional Perez all-weather sky model [29].
4.2.2 Discreet models
The discreet sky model originally divided the sky model according to the Tregenza subdivision, which defines the angular basis for subdividing the dome hemisphere into 145 solid angles [36]. To reduce the focused patch of light deviation by the 145 sky subdivisions, the sky hemisphere can be uniformly
subdivided into smaller stereo angles to create a higher resolution subdivision of the sky that more closely simulates the stereo angle of the solar sphere [41]. To get a high-resolution subdivision of the sky, the user can modify the resolution of the "sky" subdivision. The basic scheme follows the Tregenza subdivision in 145 sky patches. In the Reinhart scheme [41], each of the patches is increasingly subdivided, identified by the notation ‘MF: N’, where MF stands for Multiplication Factor and N is the number of times the side of each patch is subdivided (excluding the patch representing the zenith cap) [24]. This method divides the Tregenza angular basis by a factor of N and each grid element subdivided by a factor of N2. For example, Reinhart MF: 2 means dividing the Tregenza angle base by a factor of 2, resulting in a total of 577 subdivisions or vertex angles of 6°, while Reinhart MF: 4 means dividing the Tregenza angle base by a factor of 4 resulting in a total of 2305 subdivisions or vertex angles of 3° [37]. Already in 2013, Reinhart, et al. [24], concluded that experimental proof of discrete model has become necessary to calculate annual simulations feasibly [24]. As computing power increases, high-resolution climate models can be applied to the daylight simulation process to assist in the design or evaluation of the scheme.
4.3 Daylight calculation models
4.3.1 Image-based lighting (IBL)
To analyse detailed modelling in the built environment, a comprehensive model of the sky and surroundings is required [12]. HDR photography and IBL-techniques allow for more accurate modelling of daylight distribution [16]. The IBL technique incorporates the appearance of outside structures and vegetation and the reflected light from the surrounding, therefore improving the accuracy of luminance predictions on the window surface and throughout the interior. In the IBL technique, the sky and surrounding environment are defined by an HDR image instead of a mathematical definition of the sun and sky. Inanici [12] demonstrated, by the use of 180° HDR images of the sky dome, that accurate results can be obtained using appropriate illumination calculation parameters and techniques. In comparison with CIE sky models (clear, intermediate, and overcast), the HDR sky model includes high-resolution data and captures the spatial variability within the sky dome. In addition, the IBL technique is particularly useful for visual comfort and performance metrics because the reflected light from the surrounding environment is included in the simulation [12].
4.3.2 CBDM methods based on mathematically derived sky models
As previously mentioned, this category contains a variety of methods, in this collection of papers. A total of five were used: the EvalDRC, DAYSIM, the daylight coefficient (DC)method, the three-phase method, and the five-phase method. With the advent of high-resolution climate models, ray-tracing techniques (e.g., three-phase methods (3 PM), five-phase methods (5 PM) have been fully developed and have greatly improved the accuracy of optical simulations. The DC and DAYSIM methods have been upgraded to varying degrees by a number of researchers [15,27]. According to Table 4 it is clear which climate models are used in the different CBDM methods. The next sections will discuss the development of the different CBDM methods due to advances in climate models.
EvalDRC
Based on the general photon mapping approach [40], the contributing photon mapping technique was developed in 2017[3]. In contrast to the usual backward ray tracing, the emission of light (photons) from a light source can be accurately modelled through complex refractive and reflective media to accomplish advanced modelling of complex optical environments such as CFS [3]. The photon mapping algorithm is
as efficient as any forward ray tracing technique in accounting for small or highly directional light sources. The EvalDRC tool is used as an image generation method for visual comfort assessment [3], i.e., for glare assessment. This method differs from the 3 PM and 5 PM methods in that it applies a "photon mapping" to quantify daylight availability. In the EvalDRC tool, the original Tregenza subdivision into 145 patches is used for the sky, while the solar radiance is not distributed or averaged at all. To avoid interpolation errors, Bauer et al. [3] calculated separate true solar system numbers for all timestamps of the evaluation time period by using exact 0.5° angular solar source primitives. It requires a significant increase in computational effort resulting in reduced flexibility compared to the previously mentioned 3 PM. However, this guarantees the highest accuracy, theoretically, for the treatment of the solar contribution.
DAYSIM
Nathaniel et al. [15] rendered scenes illuminated by mathematically defined sky models or outdoor brightness levels recorded in photographs through two ray tracing engines (Radiance and Accelerated) [15]. By comparing the glare measures in the rendering (depending on the scene), the image-based rendering model can predict the probability level of daylight glare due to bright light sources with an accuracy between 93% and 99%, while the accuracy of uncomfortable glare due to contrast is between 71% and 99% [15]. However, by comparing DAYSIM with other daylight calculation methods, such as3 PM-method &5 PM-method, Brembilla and Mardaljevic [5] found that the average illuminance in the same plane, obtained by DAYSIM simulations, was usually slightly lower in comparison to other methods
Daylight Coefficient (DC)
Regarding the DC-method, the sky was subdivided into a total of 577 patches according to Reinhart MF:2 [5]. The DC method calculates the daylight coefficient as a ratio between the external brightness of a sky patch and the internal illuminance caused by that patch [1]. As the solar and sky contributions are not separated in the calculation, this introduces large errors. Although DC methods are gradually being replaced by 3 and 5-phase methods, in 2011, Ward et al. [27] described a new DC approach, where they solve the complex behaviour of light rays passing through CFS, and to implement effective annual simulations. The technique is implemented by modifying the rtcontrib program to calculate coefficients for the incoming and outgoing directions on the CFS, which optimizes the annual simulation and the operable control of shading devices [27]. Extending the DC approach makes it possible to describe arbitrary assemblies of glass and other complex fenestration systems, allowing designers to accurately render images of interior spaces, including shadows cast by interior venetian blinds [27].
The three-phase method (3 PM), the five-phase method (5 PM)
The 3 PM-method, developed around 2013, is based on the DC method and extends the single coefficients of the DC method into three coefficients: the view matrix, the transmittance matrix, and the daylight matrix [20]. The 3 PM-method, like the DC method, has problems in simulating the exact position of the direct sun patches [18]. The same patch resolution determines whether the daylight contribution is a direct or indirect solar contribution, where the direct solar contribution is approximated from the nearest 3 patches to the actual sun position. However, this still yields the same interpolation error. To avoid these errors, in 2017, the 5 PM was developed, it follows the 3 PM-method and uses the more refined discrete model previously mentioned (uses the Tregenza/Reinhart MF:4 subdivision for the sky component and MF:6 subdivision for the sun component) [18]. Therefore, the 5 PM-method has been developed to increase the probability that the calculated solar position matches the actual situation. This method requires more pre-processing time to generate the necessary matrices. Increasing the resolution increases the time required to
generate the initial matrix, especially when used for discomfort glare analysis, and it may take longer to perform the actual matrix operations for annual simulations. In the 3 PM- and 5 PM-methods, the daylight matrix contains coefficients that describe the transfer of flux from patches of sky incident on a glazed window or casement system in a specific direction expressed at a fixed resolution. The direct daylight matrix includes correlation coefficients representing the flux transfer between a casement system and a specified location in the room generated by direct sunlight without mutual reflection with the interior of the room, i.e., the amount of skylight that reaches the CFS directly and without reflection.
Lee et al. [18], and Inanici and Hashemloo [13] compared the simulation results and computational feasibility of 5-PM and 3-PM under different scenarios. Inanici and Hashemloo [13]concluded that there are small differences between the results of the simulations using the 3 PM-method and the 5 PM-method [12]. The five-phase method simply provides better visualization quality with better resolution of the Sun's position. Regarding the quantitative differences, the results show negligible results when comparing the two methods. As the 5 PM-method requires a lot of time for pre-processing, it is clear that Inanici and Hashemloo [13] preferred to use the 3 PM. In contrast, Lee & Ward [18] argued that this gap inaccuracy is not negligible. They showed through experimental results that the five-phase method delivers superior accuracy: agreement with measured data was to within 20% for greater than 75% of the monitored period for illuminance-based performance parameters (e.g., horizontal, and vertical illuminance). The five-phase approach should be used if the end-user wishes to achieve a higher level of accuracy for the annual performance assessment, especially if an operable open window system is involved [18].
The resolution of climate models has increased continuously over time, and moreover, increasingly complex environments require longer and longer simulation/computation time. Although computing power is also improving, time costs are still an issue that cannot be ignored. There is no unanimous opinion on which high precision calculations are necessary for the current studies [12,18]. The balance between simulation time and simulation accuracy for practical applications has not yet been found, which could be a new focus for future research.
5
Conclusions
The influence of climate models on daylight simulations is crucial. This is why researchers have been pursuing highly accurate, but also affordable climate models over time. HDR-generated sky models provide increasingly accurate luminance distributions and solar positions through advancing technological developments. Discrete models have improved the accuracy of daylight simulations by creating higher resolution subdivisions of the sky. With the development of high-precision climate models, the accuracy of daylight calculation methods has simultaneously improved, and a variety of calculation methods are available for simulation. This review of climate models and daylight computational methods over the last decade shows that there has been a massive breakthrough in the accuracy of daylight simulations and the development of advanced simulations of complex light environments compared to previous ones. The improved accuracy will assist in the design and evaluation of practical engineering priorities. However, to increase the accuracy, there is a concomitant increase in computational effort, which leads to a decrease in the executability of the simulation. It is hoped that in future research a balance can be found between accuracy and operability, telling designers which methods have acceptable accuracy while maintaining operability. It is not just a matter of seeking high accuracy.
References
[1] Ayoub, M. (2019). 100 Years of daylighting: A chronological review of daylight prediction and calculation methods. Solar Energy, 194, 360–390. https://doi.org/10.1016/j.solener.2019.10.072 [2] Baloch, A. A. (2018). Simulation tools application for artificial lighting in buildings. Renewable and
Sustainable Energy Reviews, 20.
[3]Bauer, C., Kazanasmaz, Z. T., & Wittkopf, S. (2017). Climate based daylight simulations with EvalDRC – analysis of Daylight Redirecting Components. Journal of Facade Design and Engineering, 5(2), 45– 57. https://doi.org/10.7480/jfde.2017.2.1738
[4] Bauer, C., & Wittkopf, S. (2016). Annual daylight simulations with EvalDRC – Assessing the performance of daylight redirection components. Journal of Facade Design and Engineering, 3(3–4), 253–272. https://doi.org/10.3233/FDE-160044
[5] Brembilla, E., & Mardaljevic, J. (2019). Climate-Based Daylight Modelling for compliance verification: Benchmarking multiple state-of-the-art methods. Building and Environment, 158, 151–164.
https://doi.org/10.1016/j.buildenv.2019.04.051
[6] Bueno, B., Wienold, J., Katsifaraki, A., & Kuhn, T. E. (2015). Fener: A Radiance-based modelling approach to assess the thermal and daylighting performance of complex fenestration systems in office spaces. Energy and Buildings, 94, 10–20. https://doi.org/10.1016/j.enbuild.2015.02.038
[7] Bustamante, W., Molina, G., Uribe, D., & Vera, S. (2020). Use of Different Complex Fenestration Systems in Office Spaces in Chile: Analysis of the Energy Consumption and Visual Comfort of Occupants at the Early Stages of Their Design Process. In Rossel G.S. (Ed.), IOP Conf. Ser. Earth
Environ. Sci. (Vol. 503, Issue 1). Institute of Physics Publishing; Scopus. https://doi.org/10.1088/1755-1315/503/1/012100
[8] Bustamante, Waldo. (2017). An integrated thermal and lighting simulation tool to support the design process of complex fenestration systems for office buildings. Applied Energy, 13
[9] Chan, Y.-C. (2013). Efficient venetian blind control strategies considering daylight utilization and glare protection. Solar Energy, 14.
[10] Grobe, L. O. (2019). Photon-mapping in Climate-Based Daylight Modelling with High-resolution BSDFs. Energy and Buildings, 205, 109524. https://doi.org/10.1016/j.enbuild.2019.109524
[11] Hupe, M. (2019). EndNote X9. Journal of Electronic Resources in Medical Libraries, 16(3–4), 117– 119.
[12] Inanici, M. (2010). Evalution of High Dynamic Range Image-Based Sky Models in Lighting Simulation. LEUKOS, 7(2), 69–84. https://doi.org/10.1582/LEUKOS.2010.07.02001
[13] Inanici, M., & Hashemloo, A. (2017). An investigation of the daylighting simulation techniques and sky modeling practices for occupant centric evaluations. Building and Environment, 113, 220–231.
https://doi.org/10.1016/j.buildenv.2016.09.022
[14] Iversen, A., Svendsen, S., & Nielsen, T. (2013). The effect of different weather data sets and their resolution on climate-based daylight modelling. Lighting Research & Technology, 45(3), 305–316.
https://doi.org/10.1177/1477153512440545
[15] Jones, N. L., & Reinhart, C. F. (2017). Experimental validation of ray tracing as a means of image-based visual discomfort prediction. Building and Environment, 113, 131–150.
[16] Knera, D., & Heim, D. (2018). Determination of daylight conditions in office room using digital images as a light source. IOP Conference Series: Materials Science and Engineering, 415, 012040.
https://doi.org/10.1088/1757-899X/415/1/012040
[17] Kong, Z., Utzinger, D. M., & Humann, C. (2018). Evaluation of a hybrid photo-radiometer sky model compared with the Perez sky model. Energy and Buildings, 178, 318–330.
https://doi.org/10.1016/j.enbuild.2018.08.022
[18] Lee, E. S., Geisler-Moroder, D., & Ward, G. (2018). Modeling the direct sun component in buildings using matrix algebraic approaches: Methods and validation. Solar Energy, 160, 380–395.
https://doi.org/10.1016/j.solener.2017.12.029
[19] Li, D. H. W., & Lam, J. C. (2001). Evaluation of lighting performance in office buildings with daylighting controls. Energy and Buildings, 11.
[20] McNeil, A., & Lee, E. S. (2013). A validation of the Radiance three-phase simulation method for modelling annual daylight performance of optically complex fenestration systems. Journal of Building
Performance Simulation, 6(1), 24–37. https://doi.org/10.1080/19401493.2012.671852
[21] Nabil, A., & Mardaljevic, J. (2006). Useful daylight illuminances: A replacement for daylight factors.
Energy and Buildings, 38(7), 905–913. https://doi.org/10.1016/j.enbuild.2006.03.013
[22] Ochoa, C. E., Aries, M. B. C., & Hensen, J. L. M. (2012). State of the art in lighting simulation for building science: A literature review. Journal of Building Performance Simulation, 5(4), 209–233.
https://doi.org/10.1080/19401493.2011.558211
[23] Reinhart, C. F., & Herkel, S. (2000). The simulation of annual daylight illuminance distributions—A state-of-the-art comparison of six RADIANCE-based methods. Energy and Buildings, 32(2), 167–187.
https://doi.org/10.1016/S0378-7788(00)00042-6
[24] Reinhart, C. F., Jakubiec, J. A., & Ibarra, D. (2013). Definition of a reference office for standardized
evaluations of dynamic façade and lighting technologies.
[25] Santos, L., & Caldas, L. (2021). Assessing the glare potential of side-lit indoor spaces: A
simulation-based approach. Architectural Science Review, 64(1–2), 139–152.
https://doi.org/10.1080/00038628.2020.1758622
[26] Shahriar, A. N. M., Hyde, R., & Hayman, S. (2009). Wide-angle Image Analysis for Sky Luminance Measurement. Architectural Science Review, 52(3), 211–220. https://doi.org/10.3763/asre.2009.0021
[27] Ward, G., Mistrick, R., Lee, E. S., McNeil, A., & Jonsson, J. (2011). Simulating the Daylight Performance of Complex Fenestration Systems Using Bidirectional Scattering Distribution Functions within Radiance. LEUKOS, 7(4), 241–261. https://doi.org/10.1080/15502724.2011.10732150
[28] Wen, Q.-J., Ren, Z.-J., Lu, H., & Wu, J.-F. (2021). The progress and trend of BIM research: A bibliometrics-based visualization analysis. Automation in Construction, 124, 103558.
https://doi.org/10.1016/j.autcon.2021.103558
[29] Wu, Y., Kämpf, J. H., & Scartezzini, J.-L. (2019). Design and validation of a compact embedded photometric device for real-time daylighting computing in office buildings. Building and Environment,
148, 309–322. https://doi.org/10.1016/j.buildenv.2018.11.016
[30] Wu, Y., Henri Kämpf, J., & Scartezzini, J.-L. (2019). Daylighting simulation for external Venetian blinds based on HDR sky luminance monitoring with matrix algebraic approach. Energy Procedia, 158, 2677–2682. https://doi.org/10.1016/j.egypro.2019.02.021
Computation based on Sky Monitoring. 6.
[32] Wu, Y., Këmpf, J. H., & Scartezzini, J.-L. (2017). Characterization of a quasi-real-time lighting computing system based on HDR imaging. Energy Procedia, 122, 649–654.
https://doi.org/10.1016/j.egypro.2017.07.364
[33] David Moher, Alessandro Liberati, & Douglas G. Altman. (2009). Preferred Reporting Items for
Systematic Reviews and Meta-Analyses: The PRISMA Statement.
https://doi.org/10.1371/journal.pmed.1000097
[34] Kittler, R., Hayman, S., Ruck, N., & Julian, W. (1992). Daylight measurement data: Methods of evaluation and representation. Lighting Research & Technology, 24(4), 173–187.
https://doi.org/10.1177/096032719202400402
[35] Humann, C., & Mcneil, A. (2017). Using HDR sky luminance maps to improve accuracy of virtual work plane illuminance sensors. Build. Simul., San Francisco, CA, USA, 1740-1748.
[36] Tregenza, P. R., & Waters, I. M. (1983). Daylight coefficients. Lighting Research & Technology, 15(2), 65-71.
[37] Jakubiec, A., & Reinhart, C. (2011, November). DIVA-FOR-RHINO 2.0: Environmental parametric modeling in Rhinoceros/Grasshopper using RADIANCE, Daysim and EnergyPlus. In Conference proceedings of building simulation.
[38] Correia da Silva, P., Leal, V., & Andersen, M. (2015). Occupants’ behaviour in energy simulation tools: lessons from a field monitoring campaign regarding lighting and shading control. Journal of Building Performance Simulation, 8(5), 338-358.
[39] Zhu, P., Gilbride, M., Yan, D., Sun, H., & Meek, C. (2017, December). Lighting energy consumption
in ultra-low energy buildings: Using a simulation and measurement methodology to model occupant behavior and lighting controls. In Building Simulation (Vol. 10, No. 6, pp. 799-810). Tsinghua University Press.
[40] Jensen, H. W. (2001). Realistic image synthesis using photon mapping (Vol. 364). Natick: Ak Peters. [41] Bourgeois, D., Reinhart, C., & Macdonald, I. (2006). Adding advanced behavioural models in whole
building energy simulation: A study on the total energy impact of manual and automated lighting
Appendix
Table 5. Information extracted from the articles included in the review
Ref. Publication year Daylight Calculati on Method
Simulation object Climate
model
Special scenario applications Main technique applied Main results Room type Geography/
climate Altitude Orientation WWR [12] 2010 Image based lighting (IBL)
Office Seattle; clear, intermediate, and overcast skies N /A West N /A Image-based model
Used to develop visual comfort and performance indicators; provides a more accurate distribution of luminance and sun position.
Separate the solar corona from the diffuse sky component by taking two HDR images simultaneously to resolve the extreme luminance values of the solar corona.
Image-based sky models can provide an accurate and efficient method for defining the sky luminance distributions.
[27] 2011 DC method Office California; Sunny day 1-floor N /A N /A Discrete models
Evaluation of annual daylight performance metrics; optimization of shading designs; helps practitioners choose the right tool/method for compliance verification from the many options available to them; description of optically complex coplanar layers (glazing, blackout layers, etc.).
A new DC approach where they solve the complex behavior of light rays passing through CFS and implement annual
simulations by using the rtcontrib tool to track geometric light rays to calculate beam transport.
Two of Radiance's existing tools, mkillum and rtcontrib, were modified to allow end users to accurately render images of interior spaces, including shadows cast by inhomogeneous systems (e.g., blinds), and to perform effective annual simulations. [3,4] 2016-2017 EvalDRC Studio classroom Izmir Jun-Dec N /A South 0.75 Discrete models
Provides a more accurate distribution of luminance and sun position; evaluation of annual daylight performance metrics; available for all daylight redirecting components (DRC) types; evaluation of annual daylight performance metrics.
The new calculation tool EvalDRC applies Tregenza subdivision to the sky. The number of each real solar system is calculated by introducing "True Sun Coefficients".
The inclusion of solar contribution values in the general daylight factor approach by introducing "True Sun Coefficients" provides an alternative and more accurate method. A new approach to physically correct DRC simulations by introducing contributing photon
[15] 2017 DAYSIM A small conference room
Utah; April 4-floor West 0.35 Image-based model
Glare prediction and evaluation of the frequencies of glare prediction; accelerated simulation process.
Accelerate to produce more accurate luminance distribution of light sources.
Compare with Perez all-weather sky model, use HDR photography of the sky to produce a more accurate source luminance distribution, which is difficult to calculate direct normal irradiance based on HDR sky photography and overall horizontal irradiance. [13] 2017 3 phase-method &5 phase-method Open plan office Seattle; partly sunny and sunny sky N /A South N /A Image-based model
Provides a more accurate distribution of luminance and sun position; evaluation of annual daylight performance metrics; glare prediction and evaluation of the frequencies of glare prediction; helps practitioners choose the right tool/method for compliance verification from the many options available to them; used to develop visual comfort and performance indicators.
Two annual brightness
simulation methods (3 phase- and f5 phase-methods) are compared.
The measurement-based sky model matches real-world conditions with a reasonable degree of proximity, while the general CIE sky consistently
underestimates indoor lighting conditions.
[16] 2018 Image based lighting (IBL)
Office Overcast sky conditions
4-floor West 0.2 Image-based model
Provides a more accurate distribution of luminance and sun position.
The luminance distribution in the surrounding environment is determined using the CIE standard sky model and image-based lighting (IBL) techniques.
In general, the case of using the IBL method is characterized by significantly higher brightness compared to the case of using the CIE model.
[18] 2018 3 phase-method &5 phase-method Laboratory California Sunny winter day, N /A South N /A Discrete models
Optimization of shading designs; helps practitioners choose the right tool/method for compliance verification from the many options available to them.
By comparing the results of two annual brightness simulation methods 3 PM & 5 PM) for CFS.
Compared with the 3PM, the 5PM has higher accuracy. The five-stage approach should be used if the end-user wants to achieve higher accuracy for "ground truth" and matrix calculation speed for annual performance evaluation, especially if an operable fenestration system is involved.
[17] 2018 DC method
3 offices, Milwaukee; a clear sky and an
intermediate sky.
3-floor South N /A Image-based model
Provides a more accurate distribution of luminance and sun position; evaluation of annual daylight performance metrics; glare prediction and evaluation of the frequencies of glare prediction.
Proposed a HPR sky model. Using one camera to mainly take the diffuse sky component, resolving the extreme luminance values of the solar corona.
Both the horizontal HPR sky and the Perez sky simulate equally accurate brightness maps. 4-floor South 150 workstation s 4-floor East 1-5 floor Southwest [30-32] 2017-2019 5 phase-method Office Switzerland; clear and overcast sky N /A South 0.62 Image-based model
Evaluation of annual daylight performance metrics; glare prediction and evaluation of the frequencies of glare prediction; used to develop visual comfort and performance indicators; data support for automatic control of external shading devices.
Embedded photometric device (EPD) integrates sky brightness monitoring and real-time on-board daylight simulation based on HDR imaging technology. The photometric device is able to map the luminance distribution of the sky vault and the ground with high resolution.
Compared to the Perez all-weather sky model, the Embedded system based on HDR sky surveillance shows higher reliability in horizontal illumination transient lighting calculations based on HDR imaging and luminance mapping and achieves 10-25% accuracy. For predominantly cloudy and clear sky conditions, the embedded photometric device can reduce the error in transient work surface illumination calculations to 1/7 to 1/3 of the customary error.
[5] 2019 DAYSIM , DC method, 3-phase-method &5 phase-method Classroom UK March N/A North-. West South-east; north-east South South N /A Discrete models
Approach to modelling the daylighting performance of complex fenestration systems (CFS); helps practitioners choose the right tool/method for compliance verification from the many options available to them.
4-Component method; DAYSIM; 2 phase-method ;3 phase-method; 5 phase-method.
Different CBDM methods are largely consistent in the metric used to account for total illuminance and averaged over the working plane. Among the various CBDM techniques, the metric based on horizontal direct sunlight is very sensitive to the choice of simulation method because the distribution of direct sunlight in space is influenced by the representation of direct sunlight. [10] 2019 3 phase-method &5 phase-method Office Izmir, Turkey, March N /A South N /A Discrete models
Provides a more accurate distribution of luminance and sun position; optimization of shading designs; helps practitioners choose the right tool/method for compliance verification from the many options available to them; accelerated simulation process; approach to modelling the daylighting
performance of complex fenestration systems (CFS).
Bidirectional photon mapping is utilized for the calculation of the direct solar component in CBDM.
A bidirectional photon mapping approach is proposed for accurate image synthesis for visual comfort assessment, achieving accuracy comparable to that of the established but complex 5 PM.
[29] 2019 5 phase-method Office Switzerland; a partly cloudy sky N /A South 0.62 Image-based model
Data support for automatic control of external shading devices;
optimization of shading designs; approach to modelling the
daylighting performance of complex fenestration systems (CFS).
Embedded photometric device (EPD) integrates sky brightness monitoring and real-time on-board daylight simulation based on HDR imaging technology. The photometric device can map the luminance distribution of the sky vault and the ground with high resolution.
Compared to conventional practice using the Perez all-weather model, embedded photometric devices based on monitored skies can improve the accuracy of simulated real-time lighting by more than a factor of 3, with an average error of 15% to 37%.