Consumer experience analysis
A case study of Apple Inc. from consumers’ perspective in experience marketing
Paper within: Bachelor Thesis
Author: Chi Hu 19901220-3403
Lisha Huang 19910703-9464 Xueying Zhang 19911121-5860
Tutor: MaxMikael Wilde Björling
Bachelor Thesis in Business Administration
Title: Consumer Experience Analysis
Subtitle: A case study of Apple Inc. in consumer marketing Authors: Chi Hu, Lisha Huang, Xueying Zhang
Tutor: Maxmikael Björling
Date: 2013-05-14
Subject terms: Consumer Behavior, Experience Marketing
Abstract
Purpose: The thesis is intended to illustrate and analyze the role of consumer
experience and the authors also take demographic cultural factors into consideration by researching on the consumers’ evaluation towards iPhone experiences.
Method: The authors used both exploratory and descriptive strategies. In order to
obtain the primary data, the authors applied multiple methods, including quantitative and qualitative methods, respectively, questionnaire, structured and unstructured interviews.
Empirical Findings: The authors obtained empirical findings from 100
questionnaires, 12 structured interviews and 5 unstructured interviews. In terms of the quantitative results, SPSS software has been used to interpret the data. As for interviews, the authors gather the information about the specific opinions on certain experiences.
Analysis: The authors applied SD-logic, Four Realms of Experience, Consumer
behavior determinants and Decision making process theories to analyze the role of experience. And in order to answer three research questions, the authors firstly introduced the analysis of demographic subcultures, including nationality, age and gender; then the role of experience marketing in consumer decision making process is identified. Finally, the analysis of qualitative findings will be presented.
Authors’ Acknowledgements
We, the authors, would like to express our deepest gratitude to all people for the assistance to make the thesis better.
Firstly, we want to acknowledge respondents involved in our interview and questionnaire, their valuation opinions contribute to the basis of our analysis. Meanwhile, we would like to thank our tutor MaxMikael Wilde Björling for the enlightening guidance as well as the inspirations all the way during the thesis. Lastly, we would also like to thank all our friends and families for the discussion, communication and support.
Table of content
Table of Content
Abstract ... 1 Authors’ Acknowledgements ... 2 Table of content ... 3 1. Introduction ... 5 1.1 Background ... 5 1.2 Problem issues ... 5 1.3 Theoretical background ... 6 1.3.1Consumer Behavior ... 6 1.3.2Experience Marketing ... 7 1.4 Target group ... 9 1.5 Purpose statement ... 9 1.5.1Research Questions ... 9 1.5.2Delimitation ... 10 2. Theoretical Framework ... 112.1 Four realms of experience ... 11
2.2 S-D Logic... 13
2.3 Consumer decision making process ... 13
2.3.1Need recognition ... 14
2.3.2Information search ... 14
2.3.3Evaluation of alternatives ... 15
2.3.4Purchase decision ... 15
2.3.5Post-purchase behavior ... 15
2.4 Determinants of Consumer behavior ... 16
2.4.1Culture ... 16 2.4.2Sub-Culture ... 17 2.4.3Social ……….18 2.4.4Personal ... 18 2.4.5Psychological ... 19 3. Methodology ... 21 3.1 Research Approach ... 21 3.2 Quantitative research ... 22
3.2.1The nature of Questionnaire ... 22
3.2.2Methodology Framework ... 23
3.2.3Questionnaire design ... 26
3.2.4Sampling ... 27
3.3 Qualitative Research (Supplementary Research) ... 28
3.3.1The structured interview ... 28
3.3.2The unstructured interview ... 29
3.4 Reliability ... 30
3.5 Validity ... 30
3.6 Limitation ... 31
4
4.1 Data responses and demographics ... 32
4.2 Quantitative Finding ... 34
4.2.1Model Items disposal ... 34
4.2.2Experience evaluation ... 37
4.2.3Gender... 38
4.2.4Age ……….40
4.2.5Nationality ... 42
4.2.6Others ……….43
4.3 Qualitative interview finding ... 46
4.3.1Structured interview finding ... 46
4.3.2Unstructured interview ... 47 5. Analysis ... 48 5.1 Demographic subcultures ... 48 5.1.1Nationality ... 48 5.1.2Age ……….49 5.1.3Gender... 50
5.2 Experience in Buying Decision Process ... 51
5.3 Qualitative Analysis ... 53
6. Discussion and indication ... 55
7. Conclusion ... 57
8. Reference ... 59
9. Appendix ... 64
9.1 Appendix 1, Questionnaire PART ONE. FOR ALL ... 64
PART TWO. FOR NON-IPHONE HOLDERS ... 65
PART THREE. FOR IPHONE HOLDERS ... 66
9.2 Appendix 2, SPSS results ... 70
9.2.1ANOVA test ... 70
9.2.2Correlation test ... 76
1. Introduction
This chapter describes the objectives of the thesis by presenting research problems and purposes; moreover, key theory background is given so as to give readers a general picture of the topic; additionally, delimitation of the research will be discussed.
1.1 Background
Currently, the innovative and technological equipment have penetrated our life due to the huge improvements of technological products; simultaneously, severe competition has appeared in this area. In order to be more competitive in the market, an increasing number of companies swarms to launch more marketing activities to obtain information concerning customers’ preference towards their brand, product, price; and this information will help the company improve their products and services.
Apple Computer Inc. originally started with a core value of “Simplicity is the ultimate sophistication”, and they have been struggling to create the most user friendly interface and application experience for consumers. Despite the product itself, outstanding consumer experience may be one of the reasons that help the company achieve a global leading place today.
1.2 Problem issues
Some months ago, a piece of BBC news (2012) was beyond multitudes’ expectations that Samsung beat Apple’s newly launched iPhone 5 in quarter three of 2012 by selling 18 million models comparing with Apple’s 16.2 million sales, even though the market leader Apple should reclaim the title of the leading smartphone maker in the market in the next quarter. However, when more and more telecommunication producers h a v e entered into smart-phone market, Apple Inc. faces increasing
competition; moreover their main competitor, Samsung, is doing better and better and may even outperform Apple Inc. in the near future.
In an increasing homogeneous product market, what makes products outstanding in a limited pool of customers becomes the most important issue. In order to differentiate from competitors, Pine II and James (1999) proposed a new concept--an experience stager, which describes the company that offers not only goods or services but the resulting experiences toward the customers. Recall the cell phones’ user interface today, every company tries to provide a unique design, which is a kind of consumer experiences, to consumers for supplying a better service and differentiating from competitors simultaneously.
1.3 Theoretical background
1.3.1 Consumer Behavior
Over the years, marketing has shifted its focus and understanding from manufacturing to service field, and it has motivated the research of consumer behavior to some extent in every era (figure 1). Sheth (1985) concluded that the science of consumer behavior may stand alone as a dependent discipline while marketing continues to understand consumer behavior from its own perspective. Lots of scholars have contributed their work in this area. Many of them agreed on the conclusion that consumer behavior is the study of customers as they exchange value for a product/service to satisfy their needs, containing several actions and reactions (Wells & Prensky, 1996). The modern philosophy of putting great emphasis on customers makes consumer behavior principle become a key role to understand what prompts a consumer to purchase.
Figure 1, Sheth , 1985, p.6
1.3.2 Experience Marketing
Holbrook & Hirschman (1982) stated that the idea of experience marketing was initially advocated by marketing practitioners and consulting gurus with implications of former study on experiential dimension of consumer behavior. Later on, Pine and Gilmore (1998, 1999) who proposed the idea of experience economy, Carbone and Haeckel (1994) who suggested steps for managing the total customer experience, and Schmitt (2003) who provided a customer experience management framework with five step, have made a great contribution to it. The term “experience” can be understood in a deal of different ways due to unclear clarified (Tynan & McKechnie, 2009). It can be used to describe the using process or the effect and outcome coming after the process; however, Pine and Gilmore (1999, p12) concluded it is in a more
personal way that “experiences are events that engage individuals in a personal way”. The adoption of experience marketing in this way helps to generate brand loyalty and word of mouth (Smilansky, 2009). Also, Poulsson and Kale (2004) argued the personalized relevance in marketing experience.
Pine and Gilmore (1999) presented that experiences actually occur within any individual who has been engaged in an emotional physical, intellectual, or even spiritual level. There is no two people can have the same experience, because each experience derives from the interaction between the staged event and the individual’s prior state of mind and being. Regarding service as the stage and goods as the props, experience is a way to deepen customer’s memories on the company. Moreover, Lewis and Chambers (2000) illustrated that experience can be specifically defined as consumption experience concerning the total outcome to the consumers from the combination of environmental, goods purchased, and services offered.
Challenges including difficulties for differentiation, indispensable role of customer experiences in the process of customer advocacy (Allen, Reichheld & Hamilton, 2005) and
“the drive to achieve competitive advantage (Gentile, Spiller & Noci, 2007) while
simultaneously achieving a reduction in the costs of production interactions (Prahald & Ramaswamy, 2004), which is even more pertinent in the current recession.”(Tynan
& McKechnie, 2009, p503),
drives an increasing focus on experience marketing. The importance of experience in marketing has been stressed by Service-Dominant logic theory (Vargo & Lush, 2004) as well. Moreover, a survey conducted by Bigham (2008) shows that most marketing professionals regard experience marketing as an important tool and therefore intends to apply it even more widely in the future. The need of differentiation and impression to customers provides an opportunity to brand building during the experiences process.
9
For the purpose of being more competitive in the markets, a great deal of companies are making great efforts to create and retain more customers via quantities of interactive activities, for instance, designing special entertainment channels and offering innovative communication paths between consumers and company. Likely, the Apps and Siri are introduced by Apple Inc, which not only makes great contribution to consumers’ communication in their daily life, but also acquires a sea of users’ preferences from different kinds of experiences.
1.4 Target group
University students consumers are chosen as the research targets based on the assumptions of their being able to make rational thoughts, their willingness to reach new technological equipment, as well as their passion to experience new things; moreover, they are the most accessible group for the authors; and this thesis only focuses on university student consumers’ viewpoints on Apple Inc. to describe how students evaluate Apple products, and analyse the potential factors that influence experience marketing from consumers’ perspective.
1.5 Purpose statement
The thesis is intended to illustrate and analyze the role of consumer experience in the field of smartphone in terms of consumer marketing. The authors aim to conduct a research on consumers’ views on various experiences of iPhone.
1.5.1 Research Questions
1. Measuring how university student consumers evaluate each experience of Apple Inc. by using iPhone as an example.
2. Explaining the significant and unexpected choice towards the corresponding experience by applying consumer behavior theories.
3. Describing the role of experience marketing on the consumers’ purchasing decision
1.5.2 Delimitation
The study is limited by only investigating students in Jönköping International Business School, and internationalization is set according to the situation in JIBS. Furthermore, the authors chose to use iPhone to represent the whole products in Apple Inc.. Generalizations are limited to this sample.
2. Theoretical Framework
In this part, key theories and models are presented. Experience model as a background for experience classification will be shown first, and followed by the S-D Logic and Consumer Decision Making Process and its influential factors in the consumer behavior theory.
2.1 Four realms of experience
Figure 2, The four realms of experience (Pine II and James, 1999, p.30)
Pine II and James (1999) divided the experience into two dimensions--customer participation, which is the horizontal axe and environmental relationship, which is the vertical axe. At one end of the horizontal axe lies passive participation, in which consumers do not directly affect the performance. Such as speech attendants, who
take part in the events as observers or listeners. And at the other end of the axe lies active participation, in which consumers play significant roles in influencing the performance and creating their own experience. For instance, makeup testers, who take part in the events, experience the products themselves. But actually the boundary between passive and active is a little ambiguous, because passive speech attendants can also participate speech actively by debating with the spokesperson, while active makeup testers can also participate test passively by watching others’ impression. On the other dimension, it is absorption that lies at one end of the vertical axe, in which people absorb the event occurring beneath or in front of them. Such as students, who attend an English lecture to assimilate knowledge by listening to and watching the teacher. At the other end of spectrum line lies immersion, in which people can be immersed in the sights, sounds, smells that surround them. Such as bakery customers, who enjoy desserts not only by taste but also by the sweaty smell in the atmosphere.
Looking back to the model, Pine II and James (1999) illustrated the four realms of experience as entertainment, educational, esthetic and escapist. Entertainment occurs when people passively absorb the experience through senses, for example, watching TV and listening to music. And it also impresses people by making them laugh, cry or enjoy themselves; Educational experiences take place when people actively absorb by some educational events to increase their knowledge. Entertainment experiences can alter multitudes’ view of the world, while educational experiences can make us rethink how we fit into that world. In addition, Escapists make people completely immersed in the experience, such as theme parks, 4D movies, and so on; Esthetics make people immersed in the environment but do not affect the performance and just leave the environment untouched.
2.2 S-D Logic
The theory of Service-Dominant Logic (S-D logic) is introduced by Vargo and Lush (2004), which stresses service as the key component in marketing, and simultaneously brings a new understanding of marketing that the value is created via co-creating in the related network. In terms of marketing service, for instance, Apple Inc. provides quantities of iPhone, iPad, iPod and computers in the retailing stores for the customers to experience. Therefore, S-D logic indicates the key role of customers’ participation in the process of co-creation (Baron and Harris 2004),
“Throughout the whole design, production, delivery and consumption processes
(Payne et al.2008) as they exchange knowledge, skills processes and core competences with suppliers and other partners.” (Tynan & McKechine, 2009, p.507)
Based on these theories, the customers’ role can be defined as a collaborator, not only for exchanging values, but also for co-producing values. Thus, the S-D logic provides an opportunity to link the practitioner and academic theories on experience marketing.
In order to recognize the experiences, it is not only to make a stage for the customers, but also to co-create with the customers, as well as others in their network. And the practitioner must learn to perceive the sources of value, which is valued by their consumers in all possible items; moreover, the practitioner should work out a value proposition based on “offering some combination of sensory, emotional,
functional/utilitarian, relational, social, informational and utopian value.” (Tynan &
McKechine, 2009, p.511)
2.3 Consumer decision making process
Consumer decision making process is captured as a framework for the study of consumer behavior. Rogers (1962) developed a diffusion process model, which describes the rate at which a market adopts an innovation. Like Rogers, many scholars have contributed to developing a framework to interpret the customers’ buying decision process in years as well. Even though these frameworks vary, they are more
or less telling the same thing with universally common approved theory introduced by Dewey (1910), where he classified the process into five stages: need recognition, information search, and evaluation of alternatives, purchase decision and post-purchase behavior. When considering buying a product, consumers can be influenced by any of these stages.
Figure 3, Consumer decision making process (Kolter et al., 2008, p.279)
2.3.1 Need recognition
Need recognition is the first step in any act of consumer decision making process.
“Consumers have many different kinds of needs that may be recognized in various ways.” (Wells & Prensky, 1996, p.37) A person may feel thirsty and hungry, desire to
learn new things, and these needs may motivate the person to buy water and food, or encourage him/her to read books. Needs cover a wide range from simple physical desire to mental satisfaction. As consumers, sometimes they can recognize various needs themselves; however, others can also spur them to recognize some needs as well. When consumers realize their needs, they will search for information to fulfill those needs.
2.3.2 Information search
“Once a need has been recognized, it is necessary to search for alternative ways to satisfy it.” (Wells & Prensky, 1996, p.40) There are three different ways to search for
information: (1). Recall one’s memory for ways in which the need has been fulfilled in the past; (2). Ask families or friends to find out how they satisfied the similar needs in the past; (3). Search in publicly available sources, such as magazines or Internet. For instance, once a consumer would like to join a fitness center near to his home, he
may try to recall whether there is a fitness center nearby, or ask neighbors and families, or search the Internet to find out.
2.3.3 Evaluation of alternatives
“After searching for alternatives, the consumer must take the time to evaluate each one and choose that which will best satisfy his or her needs.” (Wells & Prensky, 1996,
p.40) Evaluation is a quite sophisticated part, because consumers need to set some kinds of standards first. For example, when one consumer is searching for a fitness center, the factors that if it is near to his home, if it is cheap enough to afford, if it has safe equipment may be included in the standards. If all those criteria are important to the consumer, he may need to prioritize or combine them.
2.3.4 Purchase decision
“Once all the options have been weighted, the individual is able to purchase and use the preferred alternative.” (Wells & Prensky, 1996, p.40) Purchase is the most
significant part in consumer decision-making process, because it involves the exchange value between buyers and sellers. After purchasing the product or service, individuals will consume and experience it.
2.3.5 Post-purchase behavior
“Once the product has been purchased and used, the consumer will typically evaluate his or her experience with it and decide how successfully the product has satisfied the individual’s needs.” (Wells & Prensky, 1996, p.41)
Evaluation is important because the satisfaction from product may decide if the consumer will continue to make use of it or if the consumer will recommend it to his friends or other reference groups. Additionally, it is also essential for manufactures to improve themselves.
Westbrook and Oliver (1991) presented that satisfaction is the post-purchase evaluation judgment and a key casual for experience-based attitude change. It is established by the comparison of product, service, quality or other outcomes perceived by customers with an evaluation standard, which comes from customers’ pre-purchase expectations. However, the consumption emotion refers to the emotional response of customers during their product usage period or consumption experience (Westbrook & Oliver, 1991). To compare this two concepts, Hunt (1977) argued that “satisfaction is not the pleasurableness of the consumption experience, it is the evaluation rendered that the experience was at least as good as it was supposed to be”, while Westbrook (1987) believed that “satisfaction necessarily incorporates consumption emotions elicited by product usage”.
2.4 Determinants of Consumer behavior
Consumer buying behavior explains reasons behind the perceptions of consumers towards every products/service experienced. In other words, when experience the service/product, customers can be influenced by many factors, such as their attitudes towards risk, level of education, experience and so on. All these determinants contribute to the difference of customer satisfaction. Furthermore, the attribution theory, which describes the causes to which individuals attribute certain events, also indicates that locus, stability and controllability can affect the customers’ dissatisfaction (Folkes, 1984). According to Kotler et al. (2008), the determinants of consumer behavior have been divided into four categories, namely cultural, social, personal and psychological.
2.4.1 Culture
Wells and Prensky(1996, p.101) presented that “culture is the unique pattern of
shared meanings that characterize a society and distinguish it from other societies.”. It consists of values, language, myth, customs, rituals, laws and material
will be affected by these characteristics without any conscious. Luna and Gupta (2001) stated that an individual’s behavior is result from his/her cultural value system. Peter and Olson (1998) also indicated that culture affects consumer behavior, which itself may reinforces the manifestations of culture. An individual’s consumption behavior may be viewed and imitated and be identified as part of the culture, and the cultural cognition may affect the consumer behavior interculturally.
2.4.2 Sub-Culture
In relation to the subculture, for instance, gender, age, race, and ethnicity, religion, and social class etc., can be defined as demographic subcultures. And these items can potentially guide the consumers’ buying process. (Wells & Prensky, 1996)
The following paragraph has a brief introduction to the influence of Age and Gender. Johnson (1988) researched on the influence of age on decision making process, and indicated that the older the people are, the less information they would search before purchasing. And gender plays an important role as well. Men and women differ from many attributes, which lead to their different behaviors. One of the most influential theories about classification of gender stereotype is a conclusion of masculine and feminine (Twenge, 1997). It categories different traits of male and female; though later on research showed that they are not corresponding. In other words, female may have characteristics of masculine; while male can be feminine. Traits that are masculine are described to be authoritative, aggressive, domineering, competitive, self-confident and ambitious; while traits that are feminine are described to be relatively more friendly, timid, creative and sympathetic. Although the differences persist, they are diminishing over the time. (Twenge, 1997)
These differences of characteristics contribute to differences behavior in gender. Many scholars researched on gender difference related to specific questions. Female tend to focus on the interaction process itself, while male tends to be more concerned
with achieving goals outside the interaction process (Gill, Stockard, Johnson & Williams, 1987).
2.4.3 Social
Social factor mainly consists of references groups. Reference group can be defined as
“a person or group a consumer uses as a standard of reference for his or her thoughts, feelings, and actions.”(Wells & Prensky, 1996, p.201).
Wells and Prensky (1996) presented that, when consumers aspire to join one of references groups, consumers’ way of selecting, purchasing, using, evaluating, and disposing of products will be influenced; moreover, the reference group increases the group’s influence on consumers and simultaneously reduces the influences from the other reference groups. And this influence will appear when consumers adopt the standards of a reference group. Additionally, reference group offers the models for the consumers’ motivations, perceptions, learning, attitude, and decision, as well as affects the steps of consumers’ buying process. Thus, the reference groups are essential in influencing the process of purchasing and consuming products and service, as a result of affecting the consumers’ behaviors potentially as well as substantially.
2.4.4 Personal
In terms of personal aspect, every consumer has their own concepts and then act in their particular ways. For instance, lifestyle can be explained as the values and actions in social and cultural context, and everyone has his/her own lifestyles that can influence his/her behavior. In addition, the self-concept can be defined that consumers will purchase the commodities that have the similar image as they do (Wells & Prensky, 1996). For instance, if the consumer is an elegant lady, she will purchase the delicate dress compared with the bizarre dress.
2.4.5 Psychological
From a psychological perspective, consumers can be influenced by motivations, perception and learning process as well as their beliefs. Motivation, which is composed of internal drive and external goal object, refers to the driving force behind each human choice. From a psychological way, the motivation process starts with a drive to stimulate people to react accordingly. These drives can be either emotive or cognitive, and they can manifest human decision in three ways: needs, emotions and psychographics.
Perceptions of certain products/service may generate either positive or negative results through usage experience biased by prior expectations based on brand name, price and so on in the pre-experience state; while learning perspective influences consumers during the experience process by the guide to accessibility of the products/service.
“An attitudes is a learned predisposition to act in a consistent way toward an object
based on feelings and opinions that result from an evaluation of knowledge about the object. ”(Wells & Prensky, 1996, p.313) In other words, attitudes can either be
learned or deeply embedded in mind and will cause to consistent response. And attitudes can be affected by beliefs, such as brand loyalty.
“Brand experience is conceptualized as sensations, feelings, cognitions, and behavioral responses evoked by brand-related stimuli that are part of a brand’s design and identity, packaging, communications, and environments.”(Brakus, Schmitt
& Zarantonelloet, 2009, p.53-p.54)
When customers purchase products and consume brands, they are exposed to the actual products attributes. Nevertheless, they are also exposed to the quantities of specific brand-related stimuli, for instance, the design, shape, slogan and color. The long-lasting brand experiences, which are stored in the customers’ memory, should
make some effects on consumers’ satisfaction and loyalty (Oliver, 1997 & Reicheld, 1996)
3. Methodology
This chapter explicitly presents the method chosen for the thesis and the critical discussion about the method is shown as well.
3.1 Research Approach
This thesis mainly applies the exploratory research, Kolter and Armstrong (2006) described that exploratory research mainly intends to gather preliminary information, which will contribute to defining problems and suggesting hypotheses. The authors mainly focus on gather information on consumers’ experience to define the role of experience to purchase by taking the demographic culture factors into consideration. Therefore, the authors select the methods of surveys and interviews. Additionally, the authors have applied the cross sectional study, which is defined as the study of a phenomena at one specific in time. Finally, descriptive method is applied in the qualitative interview.
Patton (1980) stated that a well-structured method part has to contain quantities of data collected and well-organized analysis towards the data summarizing. In terms of the data collection, there are mainly two methodologies, namely, quantitative and qualitative method. The quantitative study evaluates the scale of relationships between dependent variables and independent variables more precisely, its variance in the sample size can be explained rather clearly with a large percentage; moreover, it also presents a detailed pattern that spreads across a large number of situations, while the qualitative method is capable of showing the description of details, depiction of process in an active form, and attention to the viewpoints of those studied. Hence, these strengths contribute to decreasing the abstraction inherent in quantitative studies. On the other hand, compared with quantitative study, the qualitative research gives more ambiguous statements, such as “strong leadership is necessary, but not
Based on the strengths and weakness above, the authors chose to mix these two methods to perform their thesis’ findings and analysis because of the explicit relationship showed by quantitative method and the detailed information provided by qualitative method. Additionally, the quantitative research is used as a main method in the paper, while qualitative method as supplements. The method selected is always being the most appropriate one for the given topic and purpose (Holme & Solvang, 1997); therefore, believed by the authors, the mixed strategy is the most appropriate choice.
Additionally, in terms of the quantitative method, questionnaire was proceeded to acquire the primary data, and statistical tools, such as SPSS, were applied for summarizing and analyzing those data. Furthermore, both structured and unstructured interviews from qualitative method have been used to acquire in-depth information for some specific questions.
3.2 Quantitative research
“Quantitative research is a research methodology that seeks to quantify the data, typically, applies some form of statistical analysis. (Malhotra, 2004, p.137)
3.2.1 The nature of Questionnaire
A survey strategy makes it possible for the researchers to have control over the research procedures and to collect data in a fast and efficient way.
The choice of questionnaire is influenced by the purpose of the thesis, which is to illustrate and analyze the role of consumer marketing through investigating how university students evaluate Apple products in terms of experience no matter what strategies Apple Inc. has set. It is a descriptive paper to illustrate and analyze the role of consumer marketing. Moreover, standardized answers in a questionnaire make it simple to compile figures.
The questionnaire conducted by Google Spreadsheet was not only put online but also handed out to collect data, since the authors believed that these were the fastest and most convenient way to reach as many consumers as they can in a limited time. Moreover, two different methods could neutralize each other’s advantages and disadvantages. For instance, Wright (2005) proposed advantages of online questionnaire are that, it may save time and money for researchers; while the disadvantages are that, researchers may be unknown about the characteristics of respondents and they may not access to the group of respondents they expect. However, researchers can reach the group of people they intend to investigate using hand-out questionnaire. And hand-out questionnaire is also flexible, because sometimes respondents may encounter problems in understanding questions. On the other hand, hand-out questionnaire is costly on time and money.
3.2.2 Methodology Framework
The customer’s holistic experience model
By applying S-D logic, which emphasizes that value is co-created by both producers and consumers through exchange of knowledge, skill and expertise, Tynan and McKechine (2009) created an experience model from the customer perspective accordingly; in order to manage the marketing experience, an in-depth recognition of the customers, their consumption valuation and their willingness or capability to take part in the co-creation process are needed. Other than traditional models, this newly created model has taken values from consumer behavior perspective into consideration and hence it is more comprehensive.
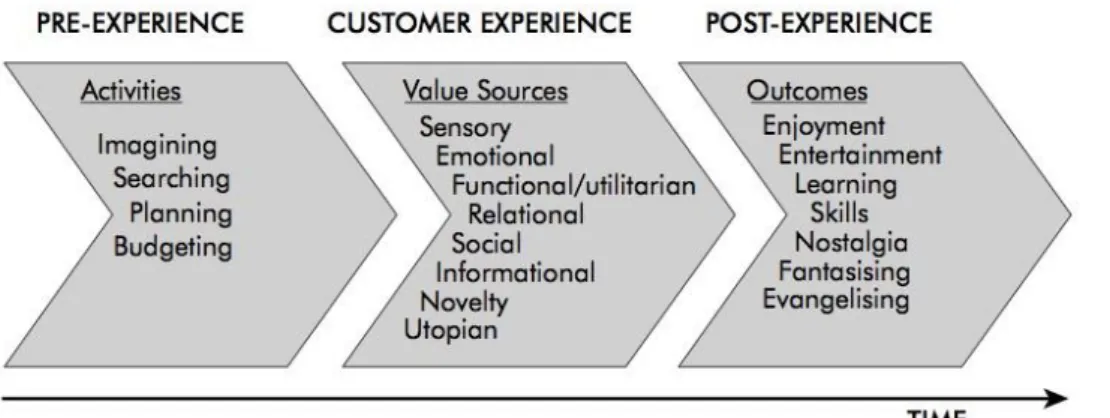
Arnould & Zinkhan (2004) pointed out that consumer experience process can be divided into three sections, namely pre-consumption, purchase and core experiences. To manage the marketing experience, it is essential to proceed on its whole life span; therefore authors have adopted this idea and included all three sections in the model. In the figures below, there lists all activities the consumer engages in the whole
experience process, and exhibits the possible sources of customer value and meaning related to the experience, as well as expresses the outcomes the consumers may experience.
According to Arnould et al. (2004), consumers participate the consumption process by firstly searching information and imaging the products/services, and next they will plan and budget for the experience; whereas, consumers gain value throughout engaging in the experience, and co-creating value of consumption (Peñaloza and Venkatesh, 2006). Thus, in the first stage (pre-experience stage), the key words, such as searching, imaging, planning and budgeting, are included. In the next stage of consumer experience, consumers are able to gain value from sensory while in the experience (Schmitt, 1999), as well as emotional meaning, which refers to more than the emotion of liking and disliking (Richins, 1997). However, most rational consumers choose products/service according to its functional value (Arnould et al. 2004). Furthermore, taking the role of Internet into consideration, informational value can not be neglected (Kozinets, 1999). Vargo and Lusch (2008) took a different view and emphasized the relational benefits in the experience process, even though the authors of the model pointed out that the relationship can be either social in nature or with other individuals or groups. Tynan and McKechine (2009) also adopted the idea that value can be obtained from consumption of novel experiences and utopian meaning (Poulsson & Kale, 2004; Maclaran & Brown, 2005). Finally, in the last stage, it is about the after-experience. According to Holbrook (2000) and Poulsson and Kale (2004), a successful experience should generate entertainment and enjoyment and enable consumers to learn new skills. Holbrook (2000) also indicated that if the experience provided is successful enough, consumers might have nostalgia towards it and envangelise by recommending others to have it. Additionally, Tynan and McKechine (2009) added the item of fantasising to indicate the possible better results if more knowledge and other contexts are offered.
Figure 4, The customer’s experience-activities, value sources and outcomes (Tynan and Mckechnie, 2009, p.509)
The model above has been adopted as our research model. This model, which concentrates on consumers’ perspective, provides readers an explicit way of thinking in terms of different sources of experience. However, the authors revised the model slightly so as to be more exact and fit in the case better. Firstly, all nouns were applied in order to be consistent. Then some words were replaced or explained according to the case so as to be more exact. For instance, the budget in the pre-experience is denoted as price in the research, and so is novelty, which is denoted by Siri; while nostalgia, which indicates how much consumers like the experience, is associated with brand loyalty. Like Oliver (1997) and Reicheld (1996) pointed out that the long-lasting brand experiences, which are stored in the customers’ memory, should make some efforts on consumers’ satisfaction and loyalty. Furthermore, some items in their model have been neglected for different kinds of reasons: (1) The items of planning and searching were ignored since the authors simplified the planning process into budgeting and information searching process into the whole process; (2) Some of the items are hard to measure, such as Emotional, Relational, Learning, Social, Informational, Utopian, Skill and Enjoyment/Entertainment; (3) Fantasising has been deleted since the authors limited their measure to current experience rather than the opportunity cost of substitutes. (4) The authors have added the Overall performance in
the model to measure the general impression that consumers have after using iPhone. After all these revise, the model is presented as below:
Figure 5, the customer’s experience-activities, value sources and outcomes
3.2.3 Questionnaire design
Apple Inc. provides a wide range of products, including iPhone, iPad, Macbook, etc. Because of the limited time and resource, the authors chose iPhone as representative for the whole Apple products so as to simplify the work.
A combination of scale, open-ended and multiple-choice questions has been contained to design the questionnaire. Grover and Vriens (2006) stated that the traditional guidelines suggest the appropriate number of scale categories should be between five and nine, and there is no single optimal number of categories. Thus, to simply the process, the authors planned to choose five-scale question at the beginning, from which scale 1 stands for negative views and scale 5 stands for positive ones. Moreover, some students, such as Swedish, tend to choose the middle scale when it is available. In order to make them choose from either positive or negative options, the authors decided to add one more scale.
In the questionnaire, the authors carried out 27 questions in total corresponding to each of the experience in the model revised in Figure 5, which are Expectations (Q2), Budget (Price) (Q3), Sensory (Q6, Q7), Place (Q5), Function (Q8, Q11, Q20),
Novelty (Siri) (Q9, Q10, Q22), Nostalgia (Brand loyalty) (Q24), Evangelizing (Q25), Overall performance (Q4, Q12). The rest questions ask about attitudes either towards to the specific apps, such as Q17, or reasons behind the choice, such as Q14. There are four parts in the questionnaire aiming at different respondents. The first part is for all respondents, and the second part is only for non-iPhone holders while the next part is for iPhone holders, and the last part is the demographic information about the respondents. Additionally, in order to make the questionnaires more interesting, the authors used some informal and colloquial words in the questionnaire.
3.2.4 Sampling
International students at JIBS are the population target in the research. At JIBS, there are students from more than 70 countries with different cultures, backgrounds, and personalities, which may influence consumers’ opinions on experience of iPhone. However, the amount of all international students at JIBS is too large to be investigated, thus, a sample is needed to represent the international students (Aczel & Sounderpandian, 2006).
Learned from Ekman (2011), international students at JIBS mainly come from EU-countries, Asia, North America, and The rest of the world, which are regarded as subpopulations. More specifically, 32% of international students are from EU countries, 38% are from Asia, 14% are from North America, while 16% are from The rest of the world. Based on the internationalization, a sample of 100 students is collected due to the time and cost limitation, and the proper representation would be 32 EU students, 38 Asian students, 14 North American students, and 16 other students. Accordingly, those students from different subpopulations would be selected randomly. This method is called stratified sampling, in which “the population is
partitioned into two or more subpopulations called strata, and from each stratum a desired number of samples are selected at random” (Aczel & Sounderpandian, 2006,
3.3 Qualitative Research (Supplementary Research)
“Qualitative research is an unstructured, exploratory research methodology based on small samples that provides insights and understanding of the problem setting.”(Malhotra, 2004, p.137)
Saunders, Lewis & Thornhill (2003) presented that qualitative interviews are categorized into structured, unstructured, semi-structured, and in-depth interviews. They also stated that the qualitative interview allows you to collect a rich and detailed data. Thus in order to obtain deeper information, the authors chose to perform the qualitative research as supplement, which consists of structured interview and unstructured interview.
3.3.1 The structured interview
In the structured interview, Silva and Fraga (2012) proposed that the interviewers follow a set of previously defined questions in a specific order, and the data from the interview is often submitted to the quantitative analysis.
In order to obtain in-depth information, the authors chose 12 students for the interview after dealing with the quantitative data. The authors chose 3 representative categories to do the further research, which have been listed in table1. In the group of non-iPhone holders, there are exactly 11 students unwilling to purchase iPhone in future, 30% of these students are randomly chosen to further study the reasons behind their choices. Similarly, 30% of students in the group of iPhone holders are chosen. To be more specific, 2 out of 7 students who tend to switch to another brand and 7 out of 23 students who will be dedicated to the brand. The explicit information is shown as below:
Table 1, The structured interview information
3.3.2 The unstructured interview
Unstructured interview is the interview that can be implemented through informal conversational interview, in-depth interview, no standardized interview, and ethnographic interview (Zhang and Wildemuth, 2006). Concerning the unstructured interview, the authors selected 5 students after they finished the questionnaires to inquire some different reasons whether students prefer one specific experience.
The merits of unstructured interview are that it is flexible in inquiring the information towards some specific questions without any need of preparation for categorization (Punch, 1998), and it also allows the interviewer to be highly responsive to individual differences and situational changes (Patton, 2002). So in order to elicit insights into some specific questions, the authors have performed unstructured interviews after handout-interviewees finished their questionnaires.
3.4 Reliability
In this case, SPSS, the formal and structured test, was used to increase the reliability. A combination of online and face-to-face survey not only increases the speed of questionnaire collection but also offers the possibility for respondents to raise questions while doing the questionnaire. And this is argued by the authors to be important so as to avoid the misunderstanding of the questions, which would lower the reliability. Additionally, more than 100 questionnaires were collected; therefore, it is possible to get rid of the invalid questionnaires, in which existed the non-responses. Moreover, the missing data were dealt via applying the average method according to the relevant categories, which increased the reliability of the data analysis.
Additionally, questions were clearly defined by explanations for avoiding misunderstandings, and the authors also did the interviews with a neutral behavior to avoid imposing interviewers’ views to interviewees. Therefore, those interviews were able to provide the unbiased and comprehensive information for the quantitative analysis; what is more, Saunders, Lewis & Thornhill (2003) illustrated that the use of interviews can contribute to collecting valid and reliable data that are relevant to the research questions and objectives.
3.5 Validity
Two methods (quantitative and qualitative research) were applied in order to acquire the exact relationship between dependent variables (each experience) and independent variables (age, gender, nationality). The quantitative method can explain the relationship precisely according to its merits aforementioned. Therefore, it is rather functional for the authors to gain the relationship between dependent variables and independent variables, as a result of contributing to analyzing the hypothesis and generalizing the experimental results. And the design of questionnaire that was based on JIBS internationalization can indicate the high feasibility of the marketing research.
The qualitative method can show the detailed information towards some specific questions so as to give clear reasons behind their choices. The unstructured interview, which is quite flexible for inquiring the information, allowed the interviewers to have highly responsiveness to the questions.
3.6 Limitation
The limitations of the research might exist in both methods chosen. In relation to quantitative method, in the beginning, only 100 international students were chosen as the sample size, from which might exist the problem that this sample size was inadequate to represent the whole population. Furthermore, when respondents were doing their online questionnaires, misunderstanding problems were inevitable.
Corresponding to qualitative interviews, firstly, the interviewees might misunderstand the questions, and then gave the irrelevant information. What is more, the authors might miss and misunderstand the responses sometimes when they recorded all the information. At last, the authors’ behaviors and expressions might have effects on respondents’ answers; in other words, the authors might impose their viewpoints to respondents unconsciously.
4. Empirical findings
This chapter presents empirical findings that the authors have observed. After a brief report on data responses and demographics, the authors have presented the quantitative responses and qualitative responses respectively.
4.1 Data responses and demographics
The questionnaires were distributed on line and hand-out; the total number of respondents was 106, and 6 invalid responses were deleted due to incompletion.
The number of male and female respondents is nearly equal. Specific data can be read from the following table.
Table 2, Gender distribution
The respondents’ age ranges from 20-39, of which the majorities are from 20-25. The authors divided the whole age group into three subgroups, namely 20-21, 22-23, 24-39, so as to reach at least 30 people in each group for statistical use. Specific data can be read from the following table.
Table 3, Age distribution
The respondents consist of students from EU countries, Asia, North America and The Rest of World. Specific data can be read from the following table.
4.2 Quantitative Finding 4.2.1 Model Items disposal
In the questionnaire, the authors designed questions according to the model. However, some items, such as Sensory, Function, and Overall performance, are too abstract, thus the authors designed more than one questions to obtain the evaluation of these items. For instance, in terms of Novelty, although the authors have decided to use Siri as the only example, there still exists more than one aspects related to it, thus the authors also decided to designed several questions in Novelty. The correlation coefficients of those aspects have to be calculated to test if they can represent one experience item in the model. Moreover, when the authors designed the questionnaire, the scale of price from 1-6 standing for inexpensive to expensive, which implied the reverse answers the authors desired to get from respondents, so the authors changed the scale results to the reverse version. In other words, in the answers of price, previous 1 indicates 6 now.
Sensory
As Table 5 shown, the correlation between the evaluation of iPhone Outlook and Multi-touch is 0.393, which is greater than 0.3, so the mean value of Outlook and Multi-touch can represent the average Sensory.
Function
Table 6
As shown above, the correlation between the evaluation of IOS System and Functionality is 0.428, which is greater than 0.3; however, both the correlation between Battery Operating Time and Functionality and the correlation between Battery Operating Time and IOS System is less than 0.3. As a result, only the mean value of evaluation on IOS System and Functionality can delegate Function.
Novelty
Table 7
Shown from Table 7, the correlation between the evaluation of Like Siri and Useful Siri is 0.673, which is larger than 0.3; however, the correlation between both Siri frequency and Like Siri and Siri frequency and Useful Siri are less than 0.3. So only the mean value of Like Siri and Useful Siri can stand for Novelty.
Overall performance
As shown above, the correlation between the evaluation of Performance-to-price ratio and iPhone works is 0.567, which is larger than 0.3, so the mean value of Performance-to-price ratio and iPhone works can represent Overall performance.
4.2.2 Experience evaluation
Generally speaking, respondents rated highly in terms of iPhone overall experience. The table below shows the overall experience rated by respondents. Respondents less satisfy the pre-experience stage, which is denoted as Price and Expectation, than the rest two stages with each single experience rated less than 3 on average. On the contrary, iPhone does relatively better in during-service experience, which is denoted from Outlook to Battery in the following table. Except for Siri and Operating hour, iPhone is believed to have overall good performance. The experience of sensory and functionality as well as its IOS operating system are all rated closely to 5, which is a quite satisfactory result in a 6-scale questionnaire. However, even though the good performance is admitted by the multitudes, when asking whether they will choose to have an iPhone or continue using iPhone in the future, respondents seem to hesitate to be dedicated to the brand. Generally speaking, the after-experience stage is rated with 3 and 4.
4.2.3 Gender
According to Curve 1, there is difference between gender towards the experience of Novelty, as well as the experience of Evangelizing.
Curve 1
The authors used the hypothesis to test whether these differences are significant; Table 9 indicates that the null hypotheses for Novelty and Evangelizing should be rejected, because the significant level is less than 0.05. Therefore, in terms of the experience of Novelty and Evangelizing, there is significant difference between genders, which is consistent with the results from Curve 1 above.
Table 9
In addition, from the table 13 named the Gender Descriptive; it shows that there is a relatively larger difference between gender concerning the experience of Novelty and Evangelising. These results are also consistent with the curve above. The average scale for female towards the Novelty is about 3.286, and for male is about 2.871; and the average scale for female concerning Evangelising is around 4.66, while for male it is about 3.76, which is nearly about 0.9 scale differences.
4.2.4 Age
Curve 2
An overall mean test among different age groups compared with all consumers in general is presented above. The Curve 2 shows that different age groups hold relatively insignificantly different attitudes towards pre-experience and in-experience service but three post-experience services, namely, Nostalgia (Brand loyalty), Evangelising and Overall performance. In order to have further knowledge on the information observed, the authors have tested the data with an ANOVA test and the result and corresponding hypotheses are shown below.
Table 10
Since 95% of confidence interval for mean is applied, the authors have to reject any null hypothesis whose significance level is greater than 0.05 (1-0.95), and the results are presented. According to the table, Nostalgia is proven to be regarded insignificantly different among age groups in the ANOVA test, which is not consistent with previous finding. This can be explained by the inadequate sample size. However, people in different ages show relatively different attitudes towards Evangelising and Overall performance, which is consistent with the findings in Curve 2. Further calculation on the different rated towards Evangelising and Overall performance among three age groups is followed as below:
Table 11
In terms of Evangelising, the younger the respondents are, the higher they rated towards it; while people between 22 and 23 had higher rate towards iPhone’s Overall performance, followed by people from 20 to 21.
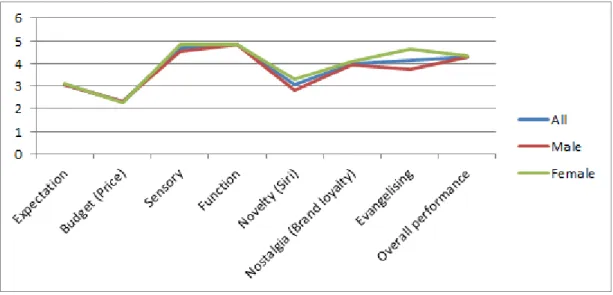
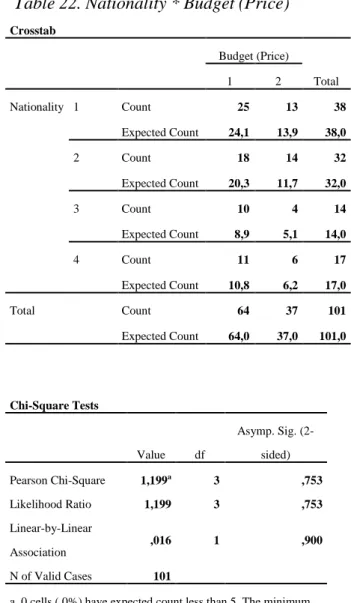
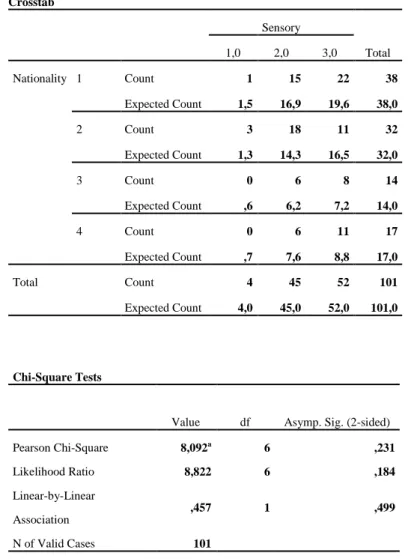
4.2.5 Nationality
To measure how university student consumers from different races evaluate various experiences, the authors utilized Excel to dispose data, and the results can be read from the following data.
Table 12
The hypothesis test has been used to verify if there is a significant difference of evaluation on each experience within different nationalities. Two groups have more than 30 individuals, while another two groups have less than 30, so chi-square test will be used in nationality hypothesis.
However, the results from SPSS show that in more than 20% of the cells the expected value is below 5, which indicates that a chi-square test cannot be performed. So in terms of all those various experiences, there is no significant difference among nationalities.
Although the statistical test shows there is no significant difference of evaluation on each experience within different nationalities, Table 12 still have some indications. First of all, students from EU have the lowest evaluation on average, while ones from The rest of world have the highest. Secondly, when students from Asia, EU countries, and The rest of world like the Function of iPhone most, ones from North America have the highest evaluation on Evangelizing, which indicates that students from North America are more likely to recommend iPhone to others than ones from other countries. Last but not least, in terms of the evaluation of all students, Function scored the highest, while Budget (price) scored the lowest. In other words, no matter where students are from, they enjoyed the Function of iPhone most; however, they stated that the price is too high.
4.2.6 Others
The important aspect of in-experience service, named Place, is taken into consideration, and the following pie graph shows the results from respondents. Overall speaking, the majority, as high as 72% of the total respondents, have never been to either both stores or none of them. Among 28% of people, who have been to both Apple official retail store and Apple’s authorized agents’ stores; and 89% of them thought highly of its service in official store, while only 11% of them prefer agents’ store experience service.
Pie 1
There are two questions designed for the reasons why iPhone holders chose iPhone and what prevent non-iPhone holders to choose iPhone. For iPhone holders, the main reason for them to have it was its superior function (41%), followed by self-interest (29%) and fellow influence (18%). For non-iPhone holders, 62% of them indicated that iPhone is too expensive and 36% of them said that they preferred other brands.
The authors have chosen several apps in iPhone to make respondents evaluate them. The following graph shows the exactly results generated. From the bar chart below, there is a positive relationship between what people use the most and what they like the most. The more frequently they use a certain apps, the more likely they would like the apps and vice versa. Among the various apps, social apps were welcomed beyond others, reaching as high as 27.
Histogram 2
4.3 Qualitative interview finding 4.3.1 Structured interview finding
At t h e beginning, the authors investigated the students from the group of non-iPhone holders; there are mainly two main reasons for their unwillingness to purchase iPhone in the future. Some students expressed that the other brands, like Samsung and HTC perform better than iPhone based on their friends’ evaluations. While some other students considered that they are inclined to be unique rather than always following the trend since many of their friends using iPhone. Moreover, there is a student from India, presented reasons that iPhone is rather expensive compared to other brands, and the Wi-Fi system is actually unpopular in her country.
As the following, the authors obtained the information from the other category of students, who will definitely continue using iPhone in future. The reasons can be defined as personal preferences and practical performance, which are iPhone-holic and high performance-price ratio. What they enjoy the most of iPhone is the superior functionality, and the fabulous design also increases their preferences and simultaneously reduces their intention to switch to other brands. In addition, they responded that iPhone has made a large breakthrough in the social networks, especially increases the daily communication on Facebook and Twitter. What is more, they will recommend iPhone to their reference groups and family members without any hesitation. The students also proposed some suggestions for Apple Inc., which can be summarized that Apple Inc. should pay more attention to iPhone’s design, such as a bigger screen, and inner soft wares’ improvement, such as Siri.
And then, the students who want to switch to another brand were interviewed. All the students in this category have iPhone, and some of them actually have a pleasure experience with using iPhone. The reasons can be mainly divided into two aspects, which are personality and external environment influence. Some individuals described that they are inclined to try new things rather than always using iPhone, while the
others replied that they have found the other brands, which they thought maybe better than iPhone.
4.3.2 Unstructured interview
Finally, the authors have acquired the overall details from the unstructured interviews. In terms of the questions concerning Siri, they expressed that it is useless and unnecessary. In relation to the questions towards the functionality, more than half of students have a high appreciation. In addition, one of the interviewees described that he was unwilling to use iPhone since most of his friends used iPhone. And two students who have iPhone expressed that they would continue using iPhone because of the strong functionality. The authors also found out that more than half of the interviewees considered the price of iPhone to be relatively high.
5. Analysis
In this part, authors intend to use models in Theoretical Framework to analyze the empirical findings. And in order to answer those three research questions, the authors will firstly introduce the analysis of demographic subcultures, including nationality, age and gender; then the role of experience marketing in consumer decision making process will be identified. Finally, the analysis of qualitative findings will be presented.
5.1 Demographic subcultures
As shown from statistical findings, there is no significant difference in evaluation on each experience among demographic subcultures, and this result is out of the authors’ expectation. However, there are indeed some factors, which may contribute to this result. In order to analyze those factors, the authors combine the Determinants of Consumer Behavior (Wells & Prensky, 1996) with empirical findings. Furthermore, the authors analyzed the empirical findings based on the four qualitative interviews by means of the buying process and consumer behavior.
5.1.1 Nationality
When experiencing the product/service, customers can be affected by many factors, which have been divided into four categories, namely cultural, social, personal and psychological (Kotler et al., 2008). As for nationalities, the authors will only consider the effects of culture.
Culture is the unique pattern of shared meanings that characterize a society and distinguish it from other societies (Wells & Prensky, 1996), although the students from sample chosen is originally from different cultures, there still exists the possibility that they have been influenced by Swedish culture when they are living here. It is acknowledged from Ekman (2011) that there are 30% of employees and students are from outside of Sweden; in other words, the majority of employees and
international students from other EU countries, Asia, North America and the rest of world. In addition, there may also be a possibility that international students are mutually affected. As mentioned before, university students always have willingness and passion to learn and experience new things, so in the international environment, students make friends and socialize with people from all over the world, their interaction about different cultures from their motherlands could influence each other gradually and imperceptibly.
5.1.2 Age
The paper intends to investigate university students, and therefore 89% of the targets range from age 20 to 25, which correspond to the general age of university students in bachelor and master. As a group of college students at similar age, they have relatively indifferent evaluations towards experience to iPhone. And in most researches, scholars categorized them as one market segment since they share similar opinions in many ways. Consumers within the same segments are more or less similar in terms of needs and desire. In other words, it makes sense that the study of the paper shows that age does not have much influence in this case. However, the quantitative results in the research showed that most experiences play insignificantly different roles among three age groups, except the post experiences of Evangelizing and Overall performance; and the older the respondents are, the less they intend to rate in terms of these experiences. One explanation towards this phenomenon can be related to different reactions in decision-making process. As Johanna (1988) stated that when people get older, they would do less in the information search process in decision-making process than when they were young. The less information people searched, the less they knew about the products. In this case, when people do not have much knowledge on iPhone or its competitors’ products, for instance, Samsung, they are in no position to identify whether it is good enough comparing to other products and thus the less likely they would recommend it to their friends. In contrast, most college students in this case are relatively young; they tend to pursue high