Contents lists available atScienceDirect
Journal of Drug Delivery Science and Technology
journal homepage:www.elsevier.com/locate/jddstLipiodol-based emulsions used for transarterial chemoembolization and
drug delivery: E
ffects of composition on stability and product quality
Emelie Ahnfelt
1, Oliver Degerstedt
1, Elsa Lilienberg, Erik Sjögren, Per Hansson, Hans Lennernäs
* Department of Pharmacy, Uppsala University, Box 580, 751 23, Uppsala, SwedenA R T I C L E I N F O
Keywords: Emulsion Lipiodol®
Miniaturized dialysis method In vitro release
Pharmaceutical quality Liver cancer
A B S T R A C T
Transarterial chemoembolization with emulsion-based formulations using doxorubicin hydrochloride (DOX) and Lipiodol® is the golden standard for the loco-regional treatment of unresectable hepatocellular carcinoma (HCC). However, from a pharmaceutical quality perspective these emulsions are poorly characterized. In this study, clinically relevant Lipiodol®-based emulsions were characterized in terms of emulsion stability, continuous phase classification and droplet-size distribution. Also, the solubility of DOX in the different emulsion compo-nents and the distribution of DOX to the lipid phase were investigated. These are key features to investigate due to the claimed tumor–seeking properties of Lipiodol®. The in vitro release of DOX was studied in a miniaturized dialysis method and an empirical release model was applied to adjust for the passage of DOX across the dialysis membrane. The most stable emulsion (> 72 h) was classified as water-in-oil (w/o), had the highest distribution of DOX to the lipid phase (20%) and an aqueous-to-lipid phase ratio of 1:4. The composition of the aqueous phase was a mixture (v/v) of iohexol (85%) and water (15%). Emulsions containing iohexol and a high aqueous-to-lipid phase ratio (1:2–1:4) displayed prolonged in vitro release profiles of DOX. This study further emphasizes the medical need to standardize these emulsion-based drug delivery systems.
1. Introduction
Hepatocellular carcinoma (HCC) is the second most deadly cancer form globally with an incidence of 750,000 per year [1]. The future prevalence of hepatitis C virus (HCV) and nonalcoholic steatohepatitis (NASH) are expected to be reduced and increased, respectively, with NASH emerging as the major contributor of cirrhosis and HCC in the United States [2]. The primary recommended palliative treatment for intermediate stage HCC (Barcelona Clinic Liver Cancer stage B, asymptomatic, non-invasive and multinodular) is local intra-arterial delivery of cytostatic drugs concomitant with a drug delivery system [3–5]. One often explored option is emulsion-based formulations with doxorubicin hydrochloride (DOX). Interventional radiological techni-ques enable loco-regional administration of the emulsion through a catheter positioned in the hepatic artery feeding the tumor, in a pro-cedure called transarterial chemoembolization (TACE) [3,6,7]. Image-guided oncological treatments often make use of contrast agents based on iodine [8]. In the liver, the emulsion-based formulations releases the drug and causes a partial and temporary embolization of the treated hepatic artery branches feeding the tumor [4].
At physiological conditions the amphiphilic DOX (molecular
mass = 543.52 g/mol) exists both as a protonated monovalent cation and a deprotonated neutral entity (Fig. 1A) [9,10]. The two pKas of
DOX depend on the experimental conditions applied. For instance, at 37 °C and an ionic strength of 0.15, DOX has pKas of 7.5 and 9.5 (the
pKaof 7.5 usually varies between 7 and 8 depending on the
experi-mental conditions) [9,10]. DOX starts to aggregate and form dimers at ~10μM and at 1 mM aggregates of 40 DOX-molecules have been re-ported [11]. With increasing DOX concentration, the molecular ag-gregation number increases, generating both stacking and rod-like mi-celles of DOX [11–15]. DOX octanol-to-buffer (pH 7.3) partitioning is dependent on the concentration of DOX—below 20 μM the log parti-tioning coefficient is ~2, whereas at 500 μM it is ~0.4, indicating that a large fraction of DOX is aggregated in the aqueous phase [10]. Clini-cally, DOX is widely used as a cytostatic agent in Lipiodol®-based emulsions in the treatment of HCC [16]. Although other cytostatic drugs have a reported lower in vitro IC50 value against HCC, it is ob-vious that other factors affect the in vivo potency of drug products and other issues affecting its clinical use [17–19].
The lipid phase of these emulsions consists of Lipiodol® which has been proved to accumulate in rabbit tumor-tissue and this is the ra-tional for its use in TACE treatment of HCC [20]. In preclinical models
https://doi.org/10.1016/j.jddst.2019.101143
Received 11 April 2019; Received in revised form 19 June 2019; Accepted 4 July 2019
*Corresponding author.
E-mail address:hans.lennernas@farmaci.uu.se(H. Lennernäs).
1Contributed equally to this work.
Available online 12 July 2019
1773-2247/ © 2019 The Authors. Published by Elsevier B.V. This is an open access article under the CC BY license (http://creativecommons.org/licenses/BY/4.0/).
the intracellular accumulation in tumor cells has been proposed to be due to cell membrane pumps, pinocytosis and/or reduced degradation by lysosomes [4,21,22]. Lipiodol® has a diverse clinical use and it can be used 1) alone, 2) as emulsion, 3) as emulsion with additional em-bolization added after emulsion administration [4].
Lipiodol® is an iodinated (480 mg iodine/ml) and ethylated ester derived from poppy seed oil (lineolic (73%), oleic (14%), palmitic (9%), and stearic (3%) acids). However, the exact molecular composition of Lipiodol®, with regard to the iodine molecular position, remains un-known [18,23]. It has a density of 1.28 g/cm3and a high viscosity of
25 mPas at 37 °C [4,18]. Thefinal emulsion preparation, i.e. the mixing of the components, is often performed ex tempore in the operation theater at ambient temperatures [4,5]. The composition and prepara-tion method of these emulsions affect their in vitro evaluaprepara-tion and performance [4,5,24]. For example, it has been suggested that the ad-dition of a contrast agent to the aqueous phase increases emulsion stability and decreases drug release rates [25–28]. One contrast agent used in intra-arterial HCC treatment formulations is iohexol (Fig. 1B). In addition to increasing emulsion stability, this contrast agent also allows for x-ray visibility of the formulation [4].
Furthermore, adjustment of the aqueous-to-lipid phase ratio to a higher ratio of Lipiodol® (1:2–1:4) increases the emulsion stability and reduces the drug release rate from the formulation both in vitro and in vivo [5,26,29–32]. However, in the clinical setting the composition of the used Lipiodol®-based emulsions are not standardized leading to large variations in its composition, preparation and injectability prop-erties [4].
The overall objective of this study was to evaluate the physico-chemical and pharmaceutical factors for the in vitro performance of these clinically relevant emulsion-based formulations of DOX. The specific aims were to investigate how the aqueous-to-lipid phase ratio and the aqueous phase composition affected the emulsion stability, the continuous phase of the emulsion and in vitro release profile of DOX. Also, DOX distribution and solubility, which can affect the performance of the formulations in the different emulsion components, were in-vestigated.
2. Material and methods
2.1. Drugs and chemicals
Doxorubicin hydrochloride (DOX) was purchased from Toronto Research Chemicals, Canada, and Lipiodol® Ultra Fluid was purchased from Guerbet, France. Warfarin (Sigma-Aldrich, Germany) was used as internal standard in the UPLC-MS analysis. Four aqueous phases with clinical relevance were used in the investigated emulsions (Table 1), purified water, saline 0.9%, Omnipaque™ (iohexol) 300 mg I/mL (GE Healthcare AB, Sweden), and a mixture (v/v) of purified water (15%) and iohexol (85%) [6]. The in vitro release experiments used a Pur-A-Lyzer mini dialysis tube, with molecular mass cutoff of 12–14 kDa,
(Sigma Aldrich, Sweden) and phosphate buffer saline (PBS) containing 0.01 M Phosphate buffer, 0.0027 M potassium chloride, and 0.137 M sodium chloride with a pH of 7.4 (Medicago, Uppsala, Sweden) as re-lease medium. All chemicals were of analytical grade or higher. All samples containing DOX were protected from light throughout all ex-periments in this study.
2.2. Solubility of DOX
The shake-flask method was used to determine DOX solubility (n = 3) at room temperature (during an exceptional Swedish summer 22 °C–30 °C) in Lipiodol®, water, 0.9% saline solution, PBS buffer (pH 7.4), iohexol, and a mixture (v/v) of iohexol (85%) and water (15%) [33]. Room temperature is the most relevant temperature when in-vestigating formulation properties as the emulsions are generally pre-pared ex tempore at room temperature in the operating theatres [34].
In brief, DOX was weighed into Eppendorf vials and an appropriate volume (0.3–1.4 mL) of each solvent was added to reach relevant target concentrations of DOX. To allow for thorough mixing the vials were shaken at 1000 rpm for 24 h. The pH was then measured before the vials were centrifuged at 14,100 g for 10 min. After centrifugation a sample was collected from the supernatant, if one was present. If no supernatant was apparent but the contents were highly viscous, a sample was collected from the top of the vial. The samples were transferred to brown HPLC vials (for light protection) and stored at 4 °C until analysis. If no pellet was identifiable after centrifugation (i.e the whole sample was still a clear red solution), the solubility studies were repeated with higher target concentrations of DOX. Prior to quanti fi-cation with UPLC-MS the solubility samples were appropriately diluted, and the internal standard was added.
2.3. UPLC-MS method
An ACQUITY UPLC I-Class system coupled to a mass single-quad-rupole detector (Waters Corporation, Milford, MA) was used to de-termine DOX concentrations in both aqueous and lipid phases following the distribution and solubility experiments [35]. Stock solutions of DOX at selected concentrations (0.1–2.0 mg/mL) were prepared in DMSO. Linear calibration curves were prepared for the aqueous phase by spiking 5.0 mM ammonium formate (Millipore Corporation, Germany), pH 3.0, with DOX stock solutions to a concentration range of 1.0–20.0 μg/mL DOX. The linear calibration curves for the lipid phase were prepared by spiking Lipiodol® (3.7% v/v) in methanol with the DOX stock solutions to a concentration range of 0.1–10.0 μg/mL of DOX. Warfarin was added as an internal standard to all samples at a fixed concentration of 0.308 μg/mL (1 μM).
The mobile phase consisted of (A) 5.0 mM ammonium formate in water at pH 3.0 and (B) methanol. The gradient used was: initially 25% (B), then 25–75% (B) for 2.50 min, followed by 75% (B) for 0.50 min, 75−25% (B) for 0.10 min, and 25% (B) for 1.00 min. The total run time
Fig. 1. Chemical structures of molecules in the emulsion-based formulations. A): The active pharmaceutical ingredient doxorubicin hydrochloride (DOX). B): The contrast agent iohexol (main component of Omnipaque™).
was 4.10 min, theflow rate was 500 μL/min, the sample injection vo-lume was 10μL, and the sample manager temperature was 10 °C. The column was a C18 column (ACQUITY UPLC BEH C18, 2.1 × 50 mm,
particle size 1.7μm, Waters Corporation) kept at 60 °C. The positive capillary voltage was set at 0.80 kV and probe and source temperatures were 600 °C and 120 °C, respectively. The quantification was performed in the single-ion recording mode with an electrospray interface oper-ating in the positive mode. The mass detection channels were set to m/z 544 (doxorubicin) and 309 (warfarin), each with a cone voltage of 10 V. The sampling frequency was 10 Hz. The collected data were processed using MassLynx 4.1 MS Software (Waters Corporation, Milford, MA).
2.4. Emulsion preparation
All emulsions were prepared with Lipiodol® as the lipid component and with clinically relevant aqueous-to-lipid phase ratios of 1:1–1:4 (Table 1). As stated before, different clinically relevant aqueous phases were used: water (emulsions W/L), 0.9% saline (emulsions S/L), io-hexol (emulsions I/L), and a mixture (v/v) of 85% ioio-hexol and 15% water (emulsions IW/L). The preparation of the emulsions, i.e. the ex tempore mixing of the components, was made in accordance to the clinical setting where the emulsion preparation takes place in the op-erating theaters, at room temperature, just prior to the intra-hepatic administration [4,6,34]. The emulsions were prepared by connecting two 5-mL Luer lock syringes (Codan Triplus AB, Sweden) containing appropriate volumes of Lipiodol® and aqueous phase using a fluid dis-pensing connector (B. Braun Medical, USA). Mixing was done by hand and was initiated by pushing the entire aqueous phase (bright red) into the lipid phase (faintly yellow) as illustrated in step 1 ofFig. 2A [6]. This was followed by 19 pumps back and forth (step 2 and 3,Fig. 2A) resulting in a total of 20 pumps for each emulsion (cloudy orange). The emulsions are referred to by their aqueous-to-lipid phase ratios and aqueous phase compositions (Table 1).
2.5. Stability, classification and droplet sizes
Stability of emulsions with aqueous-to-lipid phase ratios of 1:1 and 1:4 was studied by dissolving DOX in each aqueous phase (2.5 mg/mL). The aqueous phase was then mixed with either one or four parts of Lipiodol®, for example 1 mL of DOX aqueous phase with 1 mL (1:1) or 4 mL (1:4) of Lipiodol®. Directly after mixing (20 pumps) roughly 1 mL of the emulsion was ejected into a vial and used for microscopy and DLS
measurements. The emulsion-containing syringe was then left hor-izontally to equilibrate for 15 min until the drop test. The drop test was used to identify the continuous phase and classify the emulsions as either oil-in-water (o/w) or water-in-oil (w/o) [36]. One to three drops of the prepared emulsions were dripped or“injected” into vials con-taining either water or Lipiodol® (2 mL). Visual inspection is an estab-lished approach to distinguish between separated or maintained emulsions [36]. The appearance of the bright red DOX (aqueous) and a faint yellow Lipiodol® (lipid) phase indicated emulsion separation. Vi-sual inspection of the emulsions was undertaken at 15 min, 1 h and 72 h to determine whether the emulsions were maintained or had separated. A schematic illustration of the timeline for the experiment is presented inFig. 2B. Samples for Dynamic Light Scattering (DLS) measurements (ca 1 mL) were taken directly after emulsion mixing and analyzed 30 min later. Droplet size determinations were done with a Nicomp 380 ZLS Particle sizer (Particle Sizing Systems, Santa Barbara, CA, USA) equipped with a 5 mW HeNe laser at 632.8 nm and using a 90° scat-tering angle. Samples for microscopy analysis were taken directly after emulsion mixing. A 20μL drop of emulsion was placed between two Menzel-Gläser cover slips (Schott AG, Germany). Images were taken over time (5 min–1 h) and specifically at 15 min and 1 h using 20× magnification on an inverted transmitted light microscope (Axio Vert.A1, Carl Zeiss Microscopy GmbH, Germany).
2.6. Distribution of DOX between aqueous and lipid phases
Emulsions with aqueous-to-lipid phase ratio of 1:4 were prepared by dissolving DOX in each aqueous phase (2.5 mg/mL), which was mixed with four parts of Lipiodol®, as previously described. The emulsions were transferred to brown vials and the distribution of DOX between the aqueous and lipid phases was determined at 15 min and 1 h, re-spectively. The 15 min samples were not processed further whereas the 1 h samples were placed in a plate shaker at 1000 rpm during 1 h to increase the contact between the two phases. All samples were cen-trifuged at 14,100 g for 10 min to separate the two phases. The con-centration of DOX in each phase was quantified using UPLC-MS and the percentage DOX distributed to the lipid phase was calculated.
2.7. In vitro release method
The in vitro release profiles of DOX (n = 3) from the emulsions were investigated using a modified μDiss profiler method (pION, USA)
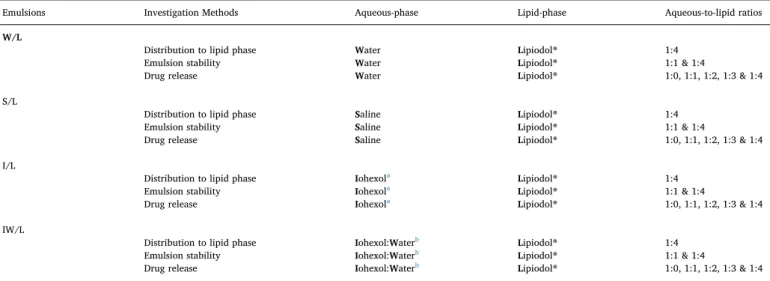
Table 1
Summary of investigation methods, aqueous phase compositions and aqueous-to-lipid phase ratios of the studied Lipiodol®-based emulsions.
Emulsions Investigation Methods Aqueous-phase Lipid-phase Aqueous-to-lipid ratios
W/L
Distribution to lipid phase Water Lipiodol® 1:4
Emulsion stability Water Lipiodol® 1:1 & 1:4
Drug release Water Lipiodol® 1:0, 1:1, 1:2, 1:3 & 1:4
S/L
Distribution to lipid phase Saline Lipiodol® 1:4
Emulsion stability Saline Lipiodol® 1:1 & 1:4
Drug release Saline Lipiodol® 1:0, 1:1, 1:2, 1:3 & 1:4
I/L
Distribution to lipid phase Iohexola Lipiodol® 1:4
Emulsion stability Iohexola Lipiodol® 1:1 & 1:4
Drug release Iohexola Lipiodol® 1:0, 1:1, 1:2, 1:3 & 1:4
IW/L
Distribution to lipid phase Iohexol:Waterb Lipiodol® 1:4
Emulsion stability Iohexol:Waterb Lipiodol® 1:1 & 1:4
Drug release Iohexol:Waterb Lipiodol® 1:0, 1:1, 1:2, 1:3 & 1:4
a Iohexol in the form of commercial product Omnipaque™. b Iohexol (85%) and water (15%) mixture (v/v).
[28,37,38]. Each channel of the μDiss profiler was calibrated in-dividually with stock solutions of DOX in methanol (1–30 μg/ml). The DOX concentration was determined at 553–572 nm as the area under the concentration–wavelength curve of the second-derivative spectrum [39,40]. The samples were separated from the release medium in a dialysis tube (Fig. 2C) [28]. The dialysis tubes were soaked in purified water for at least 30 min before the addition of 0.2 mL of the for-mulation sample, either as an aqueous phase or an emulsion. The dia-lysis tube was placed in a glass vial containing 20 mL of PBS buffer pH 7.4. To ensure efficient mixing of released DOX the release medium (37 °C) was stirred with a Teflon coated magnet (100 rpm) throughout the experiment.
The effect of aqueous-to-lipid phase ratios of 1:1, 1:2, 1:3 and 1:4 on the release profiles were investigated by preparing emulsions with a DOX concentration of 2.5 mg/mL (Table 1) [28]. Aqueous and the lipid phases were each prepared with a concentration of 2.5 mg/mL DOX and mixed to form emulsions as described in“Emulsion preparation” above. The passage of DOX across the dialysis membranes was investigated with each aqueous solution (2.5 mg/mL DOX), referred to as emulsions with aqueous-to-lipid phase ratio of 1:0.
2.8. Data analysis and equations
The data were presented as mean values with standard deviations (SD). Statistical comparisons for DOX distribution between the aqueous and lipid phases were performed with multiple analysis of variance and Sidak's correction for multiple comparisons (GraphPad Prism 6.04, GraphPad Software, Inc.).
For the in vitro release study, the mean (n = 3) of each experimental release data set was analyzed applying an empiric compartmental in vitro release model (Fig. 2D), to enable a comparison of the overall rate of release from the investigated formulations. The drug release rate (vrel) from the emulsion was described by a unidirectionalfirst order
process (Eq.(1))
= ×
vrel Af krel (1)
where Afis the amount of drug in formulation and krelis the release rate
constant. The drug release from the formulation was modelled to occur within the donor compartment, where all drug was assumed to be
unreleased at time zero and only released drug was allowed to diffuse across the membrane to the receiver compartment. The amount of re-leased drug in the donor compartment (Adon) was described by Equation
(2) ⎜ ⎟ = + ⎛ ⎝ − ⎞ ⎠ dA dt v k A V A V don
rel mem rec rec
don
don (2)
where kmemis the diffusion rate constant over the membrane, Arecis the
amount of drug in the receiver compartment, and Vdonand Vrecare the
volumes of the donor and receiver compartment, respectively. The bi-directional mass transport across the dialysis membrane assured that the release experiments were conducted up to steady state conditions. Vdonand Vrecwere set to 0.2 ml and 20 ml, respectively, in accordance
with the experimental setup. Arecwas described byEquation (3)
⎜ ⎟ ⎜ ⎟ = ⎛ ⎝ − ⎞ ⎠ + ⎛ ⎝ × − ⎞ ⎠ dA dt k A V A V k A K A V rec mem don don rec rec a bound A rec rec (3)
where the unspecific binding, described by a binding constant (ka) and
an association constant (KA) in the receiver compartment was included
to accommodate for observations of less than the theoretical amount (99%) of DOX in the receiver compartment at steady state. Experiments of aqueous solutions (without Lipiodol® i.e. aqueous-to-lipid phase ratio of 1:0), i.e., all drug released at time zero, were used to estimate kmem
for each aqueous-phase (W/L, S/L, I/L and IW/L). krelwas then
esti-mated for each formulation, aqueous-to-lipid phase ratios (1:1–1:4), by adopting the estimate of kmemfrom the corresponding aqueous
solu-tions. = t ln k 2 rel rel ½ (4)
The half-life of release (t½ rel) was calculated according to
Parameter estimation was performed by non-linear least square re-gression of the model to observations in the receiver compartment using Phoenix 64 WinNonlin software version 6.3 (Certara, L.P.,St. Louis, MO).
Fig. 2. Schematic illustrations of the methods used in this study. A) Emulsion preparation; the aqueous phase is illustrated by the red solution and Lipiodol® is illu-strated by the yellow solution. The emul-sions were prepared by pumping Lipiodol® and the aqueous phase back and forth (steps 1–3) between two connected syringes. B) The distribution of DOX between Lipiodol® and the aqueous phase was investigated at an aqueous-to-lipid phase ratio of 1:4 at 0.25 and 1 h. Emulsion stability were in-vestigated at an aqueous-to-lipid phase ratio of 1:1 and 1:4 and was inspected visually at 0.25, 1 and 72 h. C) The release profiles of DOX from the emulsions were investigated in aμDISS profiler. The sample was placed in a dialysis tube which was immersed into a glass vial containing 20 ml of release medium. A magnetic stirrer enabled the stirring (100 rpm) of the release medium. D) A schematic illustration of the empiric re-lease model used to estimate the rate of drug release from the emulsions. The model included drug release (i) from the formula-tion in the donor compartment, bidirec-tional diffusion across the dialysis membrane (ii) separating the donor and receiver chambers and unspecific association (iii) in the receiver compartment. (For interpretation of the references to colour in thisfigure legend, the reader is referred to the Web version of this article.)
3. Results
3.1. Solubility of DOX
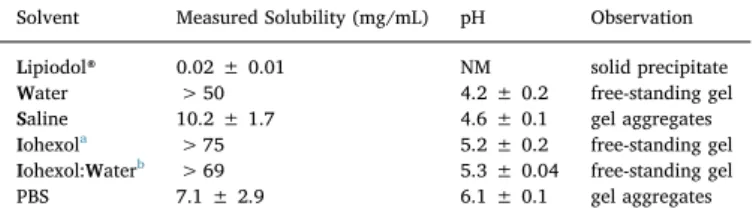
The results of DOX solubility in PBS and the various emulsion components are summarized in Table 2. The values represent DOX concentrations measured in the sample supernatants, or from the top of the vials, when the whole sample was a self-standing gel and no su-pernatant was present. Several target concentrations were tested for all solvents (except Lipiodol®) with the aim of achieving saturated solu-tions. The solubility of DOX in the various solvents ranged from 0.02 to 75 mg/mL with a rank order from lowest to highest solubility for the investigated phases: Lipiodol® < PBS < saline < water < iohexol and water < iohexol. Undissolved DOX formed a solid precipitate only in Lipiodol® (Fig. 3A). In the aqueous solvents viscous gel-like ag-gregates were observed with increasing concentrations of DOX (Tables 2 and S2). DOX separated into a dense lump at the bottom of the vial, with supernatant on top in both PBS and saline (Fig. 3B). In water, the mixture of iohexol and water, and iohexol, the whole sample was a self-standing gel at concentrations > 50 mg/mL (Table 2,Figs. 3C and S2).
3.2. Stability, classification and droplet sizes
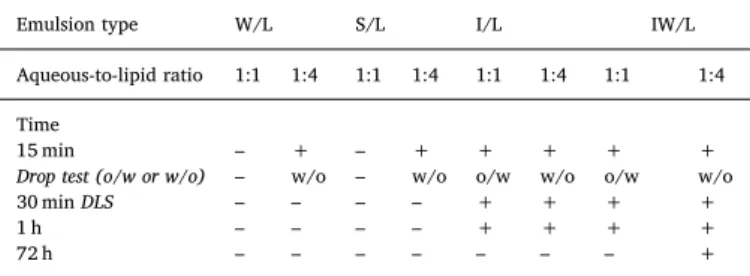
The emulsion stability was studied by visual inspection (example of 1 h time point inFig. 4) and the drop test (video example in S1) allowed for the classification of the emulsions as either w/o or o/w (Table 3). Samples were taken from each emulsion for microscopy and DLS measurements to characterize the droplet size distribution as displayed in Figs. 5 and 6. The visual inspection showed that two emulsions (emulsion W/L and S/L aqueous-to-lipid phase ratio of 1:1) separated in less than 15 min, and therefore no drop-test was performed for any of
these formulations. With the increased lipid ratio (emulsions W/L and S/L aqueous-to-lipid phase ratio of 1:4) stability was increased (> 15 min). This was enough to perform the drop-test, resulting in both emulsions being classified as w/o. However, after 30 min also these emulsions had separated making DLS measurements futile. In the 15 min microscopy images of emulsions W/L and S/L, aqueous-to-lipid phase ratio of 1:1 and 1:4, droplet size determinations proved chal-lenging (Fig. 5). These are very dynamic systems with a wide range of droplet sizes ranging from nm to hundreds of μm. In addition, the emulsions change very rapidly, resulting in blurry images at the earlier time points (2–15 min), this dynamic nature is further illustrated in the Supplementary Content (S3 A-C). However, in the aqueous-to-lipid phase ratio of 1:4 emulsions (Fig. 5C and D) the droplets (aqueous) were more dispersed than in the aqueous-to-lipid phase ratio of 1:1 emulsions, leading to less extensive aggregation and formation of larger droplets or continuous phases (Fig. 5A and B).
Supplementary video related to this article can be found athttps:// doi.org/10.1016/j.jddst.2019.101143.
The use of iohexol as an aqueous emulsion component substantially increased emulsion stability, with visual inspection qualifying all four emulsions (I/L and IW/L, aqueous-to-lipid phase ratio 1:1 and 1:4) as maintained after 1 h (Table 3). The drop test distinguished the 1:1 emulsions (o/w) from the 1:4 (w/o) emulsions. The results from mi-croscopy and DLS measurements are summarized inFig. 6. Similarly to aqueous-to-lipid phase ratio of 1:1 emulsions W/L and S/L (Fig. 5A and B), aqueous-to-lipid phase ratio of 1:1 emulsions I/L and IW/L also displayed extensive regions of continuous phases (Fig. 6A and B). Ad-ditionally, more complex multiple emulsions were present in the aqu-eous-to-lipid phase ratio of 1:4 emulsions of both I/L and IW/L (Fig. 6C and D). DLS data are reported as three measurements (á 3 min) of each emulsion sample using both intensity and volume weighing, raw data werefitted using Gaussian analysis. The investigated emulsions were both polydisperse and very concentrated, 20% in aqueous-to-lipid ratio of 1:4 emulsions and 50% in aqueous-to-lipid ratio of 1:1 emulsions (Fig. 6E and F).
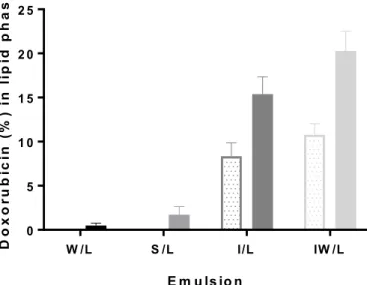
3.3. Distribution of DOX between aqueous and lipid phases
The time-dependent distribution of DOX into the lipid phase is shown inFig. 7. After 15 min no DOX could be detected in the lipid phase of the emulsions W/L and S/L. At 1 h DOX could be detected in the lipid phases of all tested emulsion, where it ranged from 0.5 to 20% distribution to the lipid phase, depending on the composition of the aqueous phase of the emulsion. From 15 min to 1 h there was a 2-fold increase of DOX in the lipid phase of emulsions I/L and IW/L. After 1 h the percentage of DOX distributed to the lipid phase of the emulsions increased from 0.50 ± 0.30% for emulsion W/L to 20 ± 2.3% for emulsion IW/L.
3.4. In vitro release study
The diffusion of DOX from the aqueous solutions (2.5 mg/mL DOX) across the dialysis membrane is shown inFig. 8A. The aqueous phases containing iohexol generated higher release plateaus of DOX compared to aqueous phases without iohexol. The in vitro release profiles of emulsions with DOX concentration of 2.5 mg/mL are presented in Fig. 8B–E. The empirical release model was used to distinguish the release of DOX from the emulsions from the diffusion across the dialysis membrane. The results are presented in Fig. 8F and Table 4. For emulsions I/L and IW/L, the release half-life (h) increased with in-creasing aqueous-to-lipid phase ratio. The release rate of DOX from emulsions S/L and W/L was unaffected by the increase in lipid ratio. 4. Discussion
A wide range of Lipiodol®-based emulsions are currently in clinical
Table 2
Solubility (mg/mL) of doxorubicin hydrochloride (DOX) at room temperature after 24 h of mixing in relevant solvents, presented as the mean ± SD (n = 3).
Solvent Measured Solubility (mg/mL) pH Observation
Lipiodol® 0.02 ± 0.01 NM solid precipitate Water > 50 4.2 ± 0.2 free-standing gel Saline 10.2 ± 1.7 4.6 ± 0.1 gel aggregates Iohexola > 75 5.2 ± 0.2 free-standing gel
Iohexol:Waterb > 69 5.3 ± 0.04 free-standing gel
PBS 7.1 ± 2.9 6.1 ± 0.1 gel aggregates
a Iohexol in the form of commercial product Omnipaque™.
b Iohexol (85%) and water (15%) mixture (v/v), PBS; phosphate buffer saline
pH 7.4, NM; not measurable.
Fig. 3. Pictures from solubility investigaton. A) Solubility of doxorubicin hy-drochloride (DOX) in Lipiodol®. B) Saline 0.9%. C) Water, inverted Eppendorf tube. Image of all solubility samples can be found in the Supplementary Content (S2).
use, but the pharmaceutical composition and final ex tempore pre-paration of the emulsions are rarely reported in detail, making com-parison of tumor response between clinical studies difficult [4,5,24,41].
Standardization of the composition andfinal preparation of these for-mulations is of importance to optimize the clinical utility of these useful but complex pharmaceutical products. In this report, various pharma-ceutical quality aspects of clinically relevant Lipiodol® emulsions con-taining DOX have been evaluated to improve the understanding of these emulsions. The effects of phase composition and the aqueous-to-lipid phase ratio on pharmaceutical properties (distribution, stabi-lity, continuous phase, droplet-size distribution and drug release pro-files) were analyzed and discussed in relation to its clinical use in the transarterial treatment of HCC.
DOX solubility was solvent-dependent and was lowest in Lipiodol®, the only solvent where the precipitate was in a solid state. The most plausible explanation is the ionization of DOX reducing its lipid solu-bility. In the aqueous solvents gel-like aggregates were observed at increasing DOX concentrations. This is in line with an increase in viscosity reported with increasing DOX concentrations (0–0.4 M) in NaCl solution [13]. Recently, it was reported that the formation of elongated DOX bundles (supramolecular polymer-like aggregates)
Fig. 4. Visual inspection of the stability of the emulsions at the 1 hr time point. Separated emul-sions: A) water and Lipiodol® (W/L) aqueous-to-lipid phase ratio of 1:4, B) saline 0.9% and Lipiodol® (S/L) aqueous-to-lipid phase ratio of 1:4. Maintained emulsions: C) and D) iohexol and Lipiodol® (I/L) aqueous-to-lipid phase ratio of 1:1 and 1:4 respectively, E) and F) mixture (v/v) of io-hexol (85%)/water (15%) and Lipiodol® (IW/L) aqueous-to-lipid phase ratio of 1:1 and 1:4 respec-tively.
Table 3
Stability and classification of the emulsions with aqueous-to-lipid ratio of 1:1 and 1:4 determined with visual inspection and drop test.
Emulsion type W/L S/L I/L IW/L
Aqueous-to-lipid ratio 1:1 1:4 1:1 1:4 1:1 1:4 1:1 1:4
Time
15 min – + – + + + + +
Drop test (o/w or w/o) – w/o – w/o o/w w/o o/w w/o
30 min DLS – – – – + + + +
1 h – – – – + + + +
72 h – – – – – – – +
+ maintained emulsion, - separated emulsion, w/o water-in-oil, o/w oil-in-water. For information on the composition of the emulsions, seeTable 1.
Fig. 5. Microscope images of emulsions with aqu-eous phase composition of water (W/L) and saline 0.9% (S/L) at 15 min time point. A) Emulsion W/L aqueous-to-lipid phase ratio of 1:1, B) Emulsion S/L aqueous-to-lipid phase ratio of 1:1, C) Emulsion W/ L aqueous-to-lipid phase ratio of 1:4 and D) Emulsion S/L aqueous-to-lipid phase ratio of 1:4. All images are at 20× magnification.
caused the high viscosity [42]. The difference in solubility between water, saline and PBS could be explained as‘salting out’, i.e., the en-tropic penalty of separating out an electrolyte decreases with increasing ionic strength [43]. It may also be described as the de-swelling of a hydrogel-like phase (syneresis). Note that this explanation is not in conflict with the fact that DOX formed gel-like aggregates rather than solid precipitates in the aqueous solvents [13].
More remarkable is the high solubility (> 69 mg/mL) of DOX in iohexol and the iohexol and water mixture found in this study. Iohexol is a basic and polar compound. It is very soluble in water and has a pKa
of 11.4, a log Pbutanol/waterof−1.15, and a log Poctanol/waterof−3.00
[44–47]. The commercial contrast agent Omnipaque™ contains iohexol at concentrations corresponding to an iodine content of 140–350 mg iodine/mL. Iohexol is considered a low-osmolality compound. How-ever, the concentration used at Uppsala University Hospital is 300 mg iodine/mL, resulting in a 2-fold higher osmolality than blood [45].
Iohexol is a very hydrophilic molecule and has not been shown to self-aggregate in water [48]. Thus, despite DOX's aggregate-forming ability in water it is not likely that iohexol increases the solubility by forming mixed micelles with DOX, however this remains to be further in-vestigated [10–13].
Increased emulsion stability has been shown to increase the drug released into the tumor [18]. Our results suggest that the addition of iohexol generates emulsions that were stable up to 1 h, which is longer than the time between preparation and administration in the clinic [6]. The emulsions with the highest stability were achieved at aqueous-to-lipid phase ratios of 1:4 and classified as w/o emulsions. The aqueous phase of emulsion IW/L has been reported to have the same specific density as Lipiodol® (1.28 g/cm3
) and it was the only emulsion that was stable after 72 h at room temperature at an aqueous-to-lipid phase ratio of 1:4 [4,34]. The increased emulsion stability of the emulsions con-taining iohexol is due to the densifying properties of iohexol [25–28]. It
Fig. 6. Microscope images and DLS measurements of emulsions with aqueous phase composition of iohexol (I/L) and mixture (v/v) of iohexol (85%)/water (15%) (IW/L) at 15 min time point. A) Emulsion I/L lipid phase ratio of 1:1, B) Emulsion IW/L lipid phase ratio of 1:1, C) Emulsion I/L aqueous-to-lipid phase ratio of 1:4 and D) Emulsion IW/L aqueous-to-aqueous-to-lipid phase ratio of 1:4. All images are at 20× magnification. Three DLS measurements (à 3 min) for each emulsion displayed as average diameter ± SD inμm. The raw data was fitted using Gaussian analysis and is reported using intensity E) or volume F) weighing (Wt).
is, however, still unclear if iohexol has other stabilizing mechanisms than its densifying properties, such as forming complexes with DOX or reducing the van der Waals attraction between droplets. Other emul-sion stabilizing-methods include the addition of polymers or emulsifiers [25,49–51]. The beneficial effect of emulsifiers and/or other stabilizing methods should be systematically investigated and implemented in the clinical use of these emulsions [4,5,52].
The emulsion droplet-sizes were investigated using both microscopy and DLS. DLS offers proper size estimation in dilute and monodisperse samples. However, the investigated emulsions were both polydisperse and very concentrated with extensive physical interaction(s) between droplets. These emulsion properties lead to substantial multiple scat-tering and explains the unreliable average droplet diameters reported. It has been suggested that accuracy could be improved in larger droplet systems by using multi-angle DLS or complementing with static light scattering measurements [53].
The emulsion droplet-size can be affected by other parameters than aqueous-to-lipid phase ratio and aqueous phase compositions. For ex-ample, the drop-size and viscosity of the emulsion can be altered by the number of times and by the speed that the phases are pumped back and forth during the final preparation just prior to administration to the patient [4,32]. Recently a novel robust“pumping emulsification de-vice” was reported that form stable water-in-oil emulsions with homogenous droplet sizes [54]. There are, however, inconsistencies in the reported effect of emulsion droplet-size range on the tumor uptake, emphasizing the need to improve the understanding of the pharma-ceutical factors affecting emulsion droplet-size and stability, and to incorporate them into a clinical delivery perspective [55,56].
The distribution of DOX to the lipid phase of the investigated aqu-eous-to-lipid phase ratios of 1:4 emulsions was in the range of 0.5–20%. For emulsions without iohexol (W/L and S/L), our results are in line with a report of a 1:1 emulsion with the following composition: Lipiodol®, DOX, glucose, water, and polysorbate-80, where 0.5% of DOX distributed to the lipid phase after 1 h [57]. There was a time-dependent increase in distribution indicating that increased equilibra-tion times could increase the distribuequilibra-tion of DOX into the lipid phase. This is of importance as in vivo studies suggest that Lipiodol® (i.e. the lipid phase) is the only component from the emulsion-based formula-tions that accumulates in the tumor environment [20]. Accordingly, an increased distribution of DOX to the lipid phase might increase DOX
concentrations inside the tumor cells [20,55,58,59]. Also, cytostatic agents with more lipophilic physicochemical properties than DOX (logD for DOX is between ~ 2 and ~0.4 depending on DOX concentration at pH 7.3) might have a greater propensity to accumulate in Lipiodol® and consequently claim some higher degree of tissue targeting property [10].
There exist no standardizations in the in vitro release methods of parenteral formulations. This leads to a large variation in the literature guidelines for in vitro release of DOX from these emulsions [5,60]. In this study, the addition of a dialysis membrane (which is common when testing drug release from emulsions) to a previously developedμDiss in vitro release method, was used to investigate the release of DOX from the emulsions [25,28,37,38,51,61]. For stable emulsions, the release rate depends on factors such as the composition of the aqueous phase, lipid-to-aqueous ratio, viscosity of the continuous phase, droplet-size range and the complexity of the system (i.e., simple or multiple emul-sions) [62]. The drug release mechanism from water-in-oil emulsions is suggested to followfirst-order kinetics, which is governed by diffusion through both phases [62].
The diffusion of aqueous-phase DOX (emulsion 1:0) across the dialysis membrane was slow and the plateau was reached between 3 and 15 h. Therefore, an empirical model was developed to discriminate between the diffusion of DOX across the dialysis membrane and the release of DOX from the investigated emulsions. The release half-life (h) from the unstable emulsions W/L and S/L was unaffected by the in-crease in lipid ratio (1:1–1:4) as they still separated quickly. This gen-erated similar DOX release rates for emulsions and aqueous phases. For emulsions I/L and IW/L, the increase in lipid ratio prolonged the esti-mated release half-life (h). This effect can be attributed to the increased emulsion stability, which forces DOX to diffuse through the increased lipid phase. The estimated release half-life of emulsion IW/L with an aqueous-to-lipid phase ratio of 1:3 was ~1 (0.75–1.5) hr generating an approximate DOX release of 75% after 2 h. In HCC patients Lipiodol®-based emulsions similar to emulsion IW/L with an aqueous-to-lipid phase ratio of 1:3 were reported to release 90% of DOX within 2 h [63]. The difference between the estimated release rate in vitro and in vivo is most likely attributed to the dynamic exposure of the bloodflow in vivo causing rapid emulsion separation after intra-hepatic administration to the patients [63].
5. Conclusions
Despite the widespread clinical use of Lipiodol®-based emulsions, the properties of these injectable formulations are in need of extended pharmaceutical characterization and optimization [4,5]. In this study it was demonstrated that the emulsion stability and DOX in vitro release profiles depend on the composition of the aqueous phase and the aqueous-to-lipid phase ratio. In addition, the relatively low distribution and solubility of DOX to and in the lipid phase (Lipiodol®) suggest that there is a need for further improvements of this formulation. The methods presented herein can be used for emulsion optimization and pharmaceutical quality assurance. A harmonization of these clinically used drug delivery systems including standardized composition and preparation methods is warranted.
Conflicts of interest
Declare no conflict of interest. Acknowledgments
Financial support was provided by the Swedish Research Council, grant number 521-2011-373.
Fig. 7. The distribution of doxorubicin hydrochloride (DOX) to the lipid phase investigated in emulsions with an aqueous-to-lipid phase ratio of 1:4 as a mean ( ± SD). Dotted bars, 15 min; solid bars, 60 min. Emulsions composition; water and Lipiodol® (W/L), saline 0.9% and Lipiodol® (S/L), iohexol and Lipiodol® (I/ L), and a mixture (v/v) of iohexol (85%)/water (15%) and Lipiodol® (IW/L).
Appendix A. Supplementary data
Supplementary data to this article can be found online athttps:// doi.org/10.1016/j.jddst.2019.101143.
References
[1] J. Ferlay, I. Soerjomataram, R. Dikshit, S. Eser, C. Mathers, M. Rebelo, D.M. Parkin, D. Forman, F. Bray, Cancer incidence and mortality worldwide: sources, methods and major patterns in GLOBOCAN 2012, Int. J. Cancer 136 (2015) E359–E386. [2] O. Ahmed, L. Liu, A. Gayed, A. Baadh, M. Patel, J. Tasse, U. Turba, B. Arslan, The
changing face of hepatocellular carcinoma: forecasting prevalence of nonalcoholic steatohepatitis and hepatitis C cirrhosis, J. Clin. Exp.Hepatol. 9 (2019) 50–55. [3] EASL-EORTC, EASL–EORTC clinical practice guidelines: management of
hepato-cellular carcinoma, J. Hepatol. 56 (2012) 908–943.
[4] J.-M. Idée, B. Guiu, Use of Lipiodol as a drug-delivery system for transcatheter arterial chemoembolization of hepatocellular carcinoma: a review, Crit. Rev. Oncol. Hematol. 88 (2013) 530–549.
[5] I.R. Dubbelboer, E. Lilienberg, E. Ahnfelt, E. Sjögren, N. Axén, Hans Lennernäs, Treatment of intermediate stage hepatocellular carcinoma: a review of intrahepatic doxorubicin drug-delivery systems, Ther. Deliv. 5 (2014) 447–466.
[6] E. Lilienberg, I.R. Dubbelboer, A. Karalli, R. Axelsson, T.B. Brismar, C. Ebeling Barbier, A. Norén, F. Duraj, M. Hedeland, U. Bondesson, E. Sjögren, P. Stål, R. Nyman, H. Lennernäs, In vivo drug delivery performance of lipiodol-based emulsion or drug-eluting beads in patients with hepatocellular carcinoma, Mol. Pharm. 14 (2017) 448–458.
[7] E. Lilienberg, Biopharmaceutical evaluation of intra-arterial drug-delivery systems for liver cancer: investigations in healthy pigs and liver cancer patients, Acta Universitatis Upsaliensis, 2015.
[8] H. Lusic, M.W. Grinstaff, X-ray-Computed tomography contrast agents, Chem. Rev. 113 (2013) 1641–1666.
[9] M. Dalmark, Characteristics of doxorubicin transport in human red blood cells, Scand. J. Clin. Lab. Investig. 41 (1981) 633–639.
[10] M. Dalmark, H. Storm, A Fickian diffusion transport process with features of
transport catalysis. Doxorubicin transport in human red blood cells, J. Gen. Physiol. 78 (1981) 349–364.
[11] Z. Fülöp, R. Gref, T. Loftsson, A permeation method for detection of self-aggregation of doxorubicin in aqueous environment, Int. J. Pharm. 454 (2013) 559–561. [12] E. Csuhai, S. Kangarlou, T.X. Xiang, A. Ponta, P. Bummer, D. Choi, B.D. Anderson,
Determination of key parameters for a mechanism‐based model to predict doxor-ubicin release from actively loaded liposomes, J. Pharm. Sci. 104 (3) (March 2015) 1087–1098.
[13] E. Hayakawa, K. Furuya, H. Ueno, M. Moriyama, A. Kondo, Visible absorption and proton nuclear magnetic resonance studies on the self-association of doxorubicin in aqueous solution, Chem. Pharm. Bull. 39 (1991) 1009–1012.
[14] P. Agrawal, S.K. Barthwal, R. Barthwal, Studies on self-aggregation of anthracycline drugs by restrained molecular dynamics approach using nuclear magnetic re-sonance spectroscopy supported by absorption,fluorescence, diffusion ordered spectroscopy and mass spectrometry, Eur. J. Med. Chem. 44 (2009) 1437–1451. [15] X. Li, D.J. Hirsh, D. Cabral-Lilly, A. Zirkel, S.M. Gruner, A.S. Janoff, W.R. Perkins,
Doxorubicin physical state in solution and inside liposomes loaded via a pH gra-dient, Biochim. Biophys. Acta Biomembr. 1415 (1998) 23–40.
[16] R. Lencioni, T. de Baere, M.C. Soulen, W.S. Rilling, J.F.H. Geschwind, Lipiodol transarterial chemoembolization for hepatocellular carcinoma: a systematic review of efficacy and safety data, Hepatology 64 (2016) 106–116.
[17] M. Boulin, S. Guiu, B. Chauffert, S. Aho, J.-P. Cercueil, F. Ghiringhelli, D. Krause,
P. Fagnoni, P. Hillon, L. Bedenne, Screening of anticancer drugs for
chemoembolization of hepatocellular carcinoma, Anti Canccer Drugs 22 (2011) 741–748.
[18] M. Boulin, A. Schmitt, E. Delhom, J.-P. Cercueil, M. Wendremaire, D.-C. Imbs, A. Fohlen, F. Panaro, A. Herrero, A. Denys, Improved stability of lipiodol–drug emulsion for transarterial chemoembolisation of hepatocellular carcinoma results in improved pharmacokinetic profile: proof of concept using idarubicin, Eur. Radiol. 26 (2016) 601–609.
[19] J. Gabrielsson, L.A. Peletier, S. Hjorth, In vivo potency revisited–keep the target in sight, Pharmacol. Ther. 184 (2018) 177–188.
[20] K. Iwai, H. Maeda, T. Konno, Use of oily contrast medium for selective drug tar-geting to tumor: enhanced therapeutic effect and X-ray image, Cancer Res. 44 (1984) 2115–2121.
[21] S. Bhattacharya, A. Dhillon, M. Winslet, B. Davidson, N. Shukla, S.D. Gupta, R. Al-Mufti, K. Hobbs, Human liver cancer cells and endothelial cells incorporate iodised oil, Br. J. Canc. 73 (1996) 877.
[22] E. Liapi, J.-F.H. Geschwind, Transcatheter arterial chemoembolization for liver cancer: is it time to distinguish conventional from drug-eluting chemoemboliza-tion? Cardiovasc. Interv. Radiol. 34 (2011) 37–49.
[23] J. Wolff, Physiology and pharmacology of iodized oil in goiter prophylaxis, Medicine 80 (2001) 20–36.
[24] T. de Baere, Y. Arai, R. Lencioni, J.-F. Geschwind, W. Rilling, R. Salem, O. Matsui, M.C. Soulen, Treatment of liver tumors with lipiodol TACE: technical re-commendations from experts opinion, Cardiovasc. Interv. Radiol. 39 (2016) 334–343.
[25] S.W. Yi, Y.-H. Kim, I.C. Kwon, J.W. Chung, J.H. Park, Y.W. Choi, S.Y. Jeong, Stable lipiodolized emulsions for hepatoma targeting and treatment by transcatheter ar-terial chemoembolization, J. Control. Release 50 (1998) 135–143.
[26] H. Nakamura, T. Hashimoto, H. Oi, S. Sawada, Transcatheter oily chemoemboli-zation of hepatocellular carcinoma, Radiology 170 (1989) 783–786.
[27] H. Sakaguchi, H. Uchida, Y. Nishimura, Q. Guo, H. Yoshimura, H. Ohishi, [Pharmacokinetic study of adriamycin in the emulsion mixed with lipiodol-differ-ence resulting from composition and methods of preparation, and behavior after mesenteric arterial injection in rat], Gan to kagaku ryoho, Cancer & chemotherapy 18 (1991) 1349–1355.
[28] J.W. Choi, H.-J. Cho, J.-H. Park, S.Y. Baek, J.W. Chung, D.-D. Kim, H.-C. Kim, Comparison of drug release and pharmacokinetics after transarterial chemoembo-lization using diverse Lipiodol emulsions and drug-eluting beads, PLoS One 9 (2014) e115898.
[29] S.W. Shin, The current practice of transarterial chemoembolization for the treat-ment of hepatocellular carcinoma, Korean J. Radiol. 10 (2009) 425–434. [30] T. de Baère, A. Denys, R. Briquet, P. Chevallier, J. Dufaux, A. Roche, Modification of
arterial and portal hemodynamics after injection of iodized oils and different emulsions of iodized oils in the hepatic artery: an experimental study, J. Vasc. Interv. Radiol. 9 (1998) 305–310.
[31] B. Abismaïl, J.P. Canselier, A.M. Wilhelm, H. Delmas, C. Gourdon, Emulsification by ultrasound: drop size distribution and stability, Ultrason. Sonochem. 6 (1999) 75–83.
[32] T. Masada, T. Tanaka, H. Nishiofuku, Y. Fukuoka, T. Sato, S. Tatsumoto, N. Marugami, K. Kichikawa, Techniques to form a suitable lipiodol-epirubicin emulsion by using 3-way stopcock methods in transarterial chemoembolization for liver tumor, J. Vasc. Interv. Radiol. 28 (2017) 1461–1466.
[33] C.A.S. Bergström, U. Norinder, K. Luthman, P. Artursson, Experimental and com-putational screening models for prediction of aqueous drug solubility, Pharm. Res. 19 (2002) 182–188.
[34] A. Norén, J. Urdzik, F. Duraj, C.E. Barbier, B.M. Karlson, U. Haglund, Longterm follow‐up after transarterial chemotherapy for hepatocellular carcinoma in a Scandinavian centre, HPB 12 (2010) 637–643.
[35] E. Lilienberg, I.R. Dubbelboer, E. Sjögren, H. Lennernäs, Lipiodol does not affect the tissue distribution of intravenous doxorubicin infusion in pigs, J. Pharm. Pharmacol. 69 (2017) 135–142.
[36] F. Deschamps, L. Moine, T. Isoardo, L. Tselikas, A. Paci, L. Mir, N. Huang, E. Fattal, T. de Baere, Parameters for stable water-in-oil lipiodol emulsion for liver trans-arterial chemo-eembolization, Cardiovasc. Interv. Radiol. 40 (2017) 1927–1932. [37] E. Ahnfelt, E. Sjögren, N. Axén, H. Lennernäs, A miniaturized in vitro release
method for investigating drug-release mechanisms, Int. J. Pharm. 486 (2015) 339–349.
[38] E. Ahnfelt, E. Sjögren, P. Hansson, H. Lennernäs, In vitro release mechanisms of doxorubicin from a clinical bead drug-delivery system, J. Pharm. Sci. 105 (2016) 3387–3398.
[39] V. Bijlani, D. Yuonayel, S. Katpally, B.N. Chukwumezie, M.C. Adeyeye, Monitoring ibuprofen release from multiparticulates: in situfiber-optic technique versus the HPLC method: a technical note, AAPS PharmSciTech 8 (2007) E9–E12. [40] A. Avdeef, K. Tsinman, O. Tsinman, N. Sun, D. Voloboy, Miniaturization of powder
dissolution measurement and estimation of particle size, Chem. Biodivers. 6 (2009) 1796–1811.
[41] I.R. Dubbelboer, Biopharmaceutical investigations of doxorubicin formulations
Fig. 8. In vitro doxorubicin hydrochloride (DOX) release from emulsions with DOX concentration of 2.5 mg/ml. Emulsions composition; water and Lipiodol® (W/L), saline 0.9% and Lipiodol® (S/L), iohexol and Lipiodol® (I/L), and a mixture (v/v) of iohexol (85%)/water (15%) and Lipiodol® (IW/L). The aqueous-to-lipid phase ratio was 0:1, 1:1, 1:2, 1:3, and 1:4. All experiments were performed with theμDiss profiler in 20 ml of phosphate buffer saline at a pH of 7.4, 37 °C, with a stirring rate of 100 rpm throughout the experiment. Lines represents the curve-fitted released DOX (%) A) Emulsion 1:0, i.e., only the aqueous phase. DOX has transported across the dialysis membrane, B) 1:1 emulsion, C) 1:2 emulsion, D) 1:3 emulsion, E) 1:4 emulsion, F) release-half life (h) from the empirical model applied to the mean ( ± SD) release data of each investigated emulsions.
Table 4
Estimated release rate constant (krel, (h−1)) presented as mean and coefficient
of variance (CV%) from empiric compartmental modelfitted to the observed means of the release data.
Aqueous phase of emulsion
W/L S/L I/L IW/L
Aqueous-to-lipid phase ratio krel(CV%) krel(CV%) krel(CV%) krel(CV%)
1:1 5.2 (39) 8.2 (77) 1.5 (9.0) 2.0 (17) 1:2 2.9 (40) 20 (280) 0.59 (5.9) 1.6 (8.7) 1:3 13 (36) 6.8 (11) 0.41 (5.3) 0.63 (37) 1:4 44 (210) 99 (260) 0.35 (4.9) 0.48 (3.9)
used in liver cancer treatment: studies in healthy pigs and liver cancer patients, combined with pharmacokinetic and biopharmaceutical modelling, Acta Universitatis Upsaliensis, 2017.
[42] E. Tasca, M. D’Abramo, L. Galantini, A.M. Giuliani, N.V. Pavel, G. Palazzo, M. Giustini, A stereochemically driven supramolecular polymerisation, Chem. Eur J. 24 (32) (June 7, 2018) 8195–8204.
[43] K.E. Gutowski, G.A. Broker, H.D. Willauer, J.G. Huddleston, R.P. Swatloski, J.D. Holbrey, R.D. Rogers, Controlling the aqueous miscibility of ionic liquids: aqueous biphasic systems of water-miscible ionic liquids and water-structuring salts for recycle, metathesis, and separations, J. Am. Chem. Soc. 125 (2003) 6632–6633. [44] C.M. Riley, R. McLemore, M.C. Preul, B.L. Vernon, Gelling process differences in
reverse emulsion, in situ gelling polymeric materials for intracranial aneurysm embolization, formulated with injectable contrast agents, J. Biomed. Mater. Res. B Appl. Biomater. 96 (2011) 47–56.
[45] K. Eivindvik, C. Sjøgren, Physicochemical properties of iodixanol, Acta Radiol. 36 (1995) 32–38.
[46] Martindale: the complete drug reference, 10 Oct 2016, 2016.https://www. medicinescomplete.com/about/.
[47] A. Hellqvist, R. Heiene, S. De Baere, S. Croubels, Y. Hedeland, Development of a capillary electrophoretic method for determination of plasma clearance of iohexol in dogs and cats, Biomed. Chromatogr. 29 (2015) 504–513.
[48] P.C. Sontum, C. Christiansen, V. Kasparkova, T. Skotland, Evidence against mole-cular aggregates in concentrated solutions of X-ray contrast media, Int. J. Pharm. 169 (1998) 203–212.
[49] F. Deschamps, K.R. Harris, L. Moine, W. Li, L. Tselikas, T. Isoardo,
R.J. Lewandowski, A. Paci, N. Huang, T. de Baere, R. Salem, A.C. Larson, Pickering-emulsion for liver trans-arterial chemo-embolization with oxaliplatin, Cardiovasc. Interv. Radiol. 41 (2018) 781–788.
[50] S.-Y. Lin, W. Wu, W. Lui, In vitro release, pharmacokinetic and tissue distribution studies of doxorubicin hydrochloride (Adriamycin HCl) encapsulated in lipiodo-lized w/o emulsions and w/o/w multiple emulsions, Die Pharmazie 47 (1992) 439–443.
[51] T.H. Lin, S.Y. Lin, Encapsulation and prolonged release behaviour of w/o/w type multiple emulsions, J. Chin. Chem. Soc. 35 (1988) 463–470.
[52] A. Kabalnov, H. Wennerström, Macroemulsion stability: the oriented wedge theory revisited, Langmuir 12 (1996) 276–292.
[53] C. Goddeeris, F. Cuppo, H. Reynaers, W. Bouwman, G. Van den Mooter, Light
scattering measurements on microemulsions: estimation of droplet sizes, Int. J. Pharm. 312 (2006) 187–195.
[54] T. Tanaka, T. Masada, H. Nishiofuku, Y. Fukuoka, T. Sato, S. Tatsumoto, N. Marugami, S. Higashi, K. Kichikawa, Development of Pumping Emulsification Device with Glass Membrane to Form Ideal Lipiodol Emulsion in Transarterial Chemoembolization, European radiology, 2018, pp. 1–5.
[55] O. Cay, J. Kruskal, P. Thomas, M.E. Clouse, Targeting of different ethiodized oil–-doxorubicin mixtures to hypovascular hepatic metastases with intraarterial and intraportal injections, J. Vasc. Interv. Radiol. 7 (1996) 409–417.
[56] S. Higashi, N. Tabata, K.-H. Kondo, Y. Maeda, M. Shimizu, T. Nakashima, T. Setoguchi, Size of lipid microdroplets effects results of hepatic arterial che-motherapy with an anticancer agent in water-in-oil-in-water emulsion to hepato-cellular carcinoma, J. Pharmacol. Exp. Ther. 289 (1999) 816–819.
[57] P. Favoulet, J.P. Cercueil, P. Faure, L. Osmak, N. Isambert, J.L. Beltramo, F. Cognet, D. Krause, L. Bedenne, B. Chauffert, Increased cytotoxicity and stability of Lipiodol-pirarubicin emulsion compared to classical doxorubicin-Lipiodol: potential ad-vantage for chemoembolization of unresectable hepatocellular carcinoma, Anti Canccer Drugs 12 (2001) 801–806.
[58] S. Baumgarten, R.C. Gaba, R.B. Breemen, Confirmation of drug delivery after liver chemoembolization: direct tissue doxorubicin measurement by UHPLC‐MS‐MS, Biomed. Chromatogr. 26 (2012) 1529–1533.
[59] R.C. Gaba, S. Baumgarten, B.O. Omene, R.B. Van Breemen, K.D. Garcia, A.C. Larson, R.A. Omary, Ethiodized oil uptake does not predict doxorubicin drug delivery after chemoembolization in VX2 liver tumors, J. Vasc. Interv. Radiol. 23 (2012) 265–273.
[60] M. Martinez, M. Rathbone, D. Burgess, M. Huynh, In vitro and in vivo considera-tions associated with parenteral sustained release products: a review based upon information presented and points expressed at the 2007 Controlled Release Society Annual Meeting, J. Control. Release 129 (2008) 79–87.
[61] G. Frenning, E. Ahnfelt, E. Sjögren, H. Lennernäs, Computationalfluid dynamics (CFD) studies of a miniaturized dissolution system, Int. J. Pharm. 521 (2017) 274–281.
[62] A.T. Florence, D. Whitehill, The formulation and stability of multiple emulsions, Int. J. Pharm. 11 (1982) 277–308.
[63] I.R. Dubbelboer, E. Sjögren, H. Lennernäs, Porcine and human in vivo simulations for doxorubicin-containing formulations used in locoregional hepatocellular carci-noma treatment, AAPS J. 20 (2018) 96.