J
Ö N K Ö P I N GI
N T E R N A T I O N A LB
U S I N E S SS
C H O O LJÖNKÖPING UNIVERSITY
Can investors earn abnormal returns by investing in IPOs?
Underpricing in the Swedish
IPO market
Master thesis within Business Administration Author: Tobias Henricson Tutors: Johan Eklund
Master thesis within Business Administration
Title: Underpricing in the Swedish IPO market: Can investors earn abnormal re-turns by investing in IPOs?
Author: Tobias Henricson
Tutors: Johan Eklund & Andreas Högberg Jönköping June 2012
Keywords: Initial Public Offerings (IPOs), IPO underpricing in Sweden, time trends in IPO pricing, underpricing patterns.
Abstract
This thesis examines underpricing in Sweden using unique data on the 185 firms going public through initial public offerings (IPOs) and listing on the Stockholm Stock Exchange between 1994-2011. The average initial return in the Swedish IPO market adjusted for in-dex movements is 11.49% but underpricing of individual IPOs was as high as 241.04%. Further, time trends in underpricing, the level of average initial returns effect on IPO sup-ply underpricing and differences between sectors, segments and investment banks are ex-amined. Finally, it is argued that investors must be rewarded for taking the high risk associ-ated with IPO investing and that the average initial return of 11.49% is a reasonable com-pensation for that risk.
Table of Contents
Abstract 1
Definitions 3
1 Introduction 4
2 Background 5
2.1 The Process of Going Public in Sweden 6
2.2 Underpricing of IPOs 10
2.2.1 Information asymmetries 13
2.2.2 Competition in the IPO market 14
2.2.3 IPO risk 15
2.3 Implications of the Efficient Market Hypothesis 16
3 Method and Data
17
3.1 Statistical significance 19
3.2 Cross-sectional study 19
3.3 Granger causality tests 20
3.4 Criticism of sources 21
4 Results and Analysis
21
4.1 Time trends 21
4.2 Initial return by segment 26
4.3 Initial IPO return by sector 28
4.4 Initial return by lead manager 29
4.4.1 Domestic versus U.S. banks 32
4.5 A hypothetical example of IPO investing 33
4.6 A reasonable return for the risk 34
5 Conclusion
34
5.1 Suggestions for further research 36
References
37
Appendices
42
Appendix 1 – Regression output
42
Appendix 2 – Average initial return divided by year
43
Appendix 3 – Average initial return divided by GICS
44
Definitions
Equity-carve out/ partial spinoff – A company that sells a small fraction of the shares in a subsidiary through an IPO or rights offer. It is not uncommon that the company will sell their remaining stake in the subsidiary at some point when the stock price has risen.
Green Shoe provision – Gives the members of the underwriting group the option to pur-chase additional shares at the offering price (Ross, Westerfield, Jaffe, & Jordan, 2008). Initial Public Offering (IPO) – When the shares of a company are first offered to the public.
Initial Return – The percentage change between the IPO’s offer price and first closing price.
Investment bank – in this thesis an investment bank is referred to as the advisor to the is-suing company and may also act as underwriter for the issue.
Issuer - the company offering its shares to the public.
Lock-in period – the time period after the IPO in which the original owners are not al-lowed to sell their shares in the company.
Money left on the table – initial return times the number of shares issued.
Prospectus – Is a document containing information needed to form a well-founded analy-sis of the issuing firm and the shares offered. The information should be easy to under-stand and analyse.1
Rights offer – An issue of common stock to existing shareholders
Stagging/flipping – Buying into an IPO and immediately sell the shares once they start trading.
Syndicate - is a self-organizing group of companies formed to transact some specific busi-ness.
Underwriting spread – The fee charged to issuers by investment banks for underwriting the IPO. It is a negotiated and pre-set percentage of the total capital raised by the bank.
1 Introduction
Going public is probably one of the most exiting events in the life of a company. However, issuing an initial public offering (IPO) is associated with high costs, both direct and indi-rect. Evidence has repeatedly shown that IPOs are underpriced on average resulting in “money left on the table”. Leaving money on the table essentially means that the issuing firm could have sold fewer shares at higher a price and still raise the same amount of capi-tal or the same amount of shares at a higher price resulting in more capicapi-tal raised. On the other hand, underpricing provide great opportunities for investors to earn abnormal re-turns. Subscribing to an IPO and immediately liquidate the holding once the shares starts trading is called stagging or flipping. An investor following this strategy starting with 100 000 SEK would after investing in 47 IPOs led by Carnegie have generated a wealth of 6 982 692 SEK, assuming that shares are purchased at the issue price and sold at the first day’s closing price, that is a 6 883% return the initial investment. In other words, the Swe-dish IPO market provides great potential to earn abnormal returns.
Jenkinson and Ljungqvist (2001) compiled underpricing studies performed on 35 countries and found that IPOs are underpriced in all those countries. Loughran and Ritter (2004) found that the average underpricing in the U.S. between 1980-2003 were 18.7% and 65% during the Dot-com bubble. Bodnaruk et al. (2008) found that the average underpricing on the Stockholm Stock Exchange between 1995-2001 were 14.2%. Academics measure un-derpricing as the difference between the IPO’s offer price and its first closing price in the stock market.
Internationally IPO underpricing has been given a great deal of attention from many aca-demics. In Sweden, however, the research has been much less comprehensive and the cov-erage ends after 2001. After 2000 we have experienced two of the century’s worst econom-ic crises, wheconom-ich are likely to affect underpreconom-icing levels. An updated study focusing on un-derpricing in the Swedish IPO market is therefore highly relevant. The purpose of the the-sis is thus, primarily to examine if Swedish IPOs conthe-sistently are underpriced and provide IPO investors with abnormal returns. Secondarily, it aims to identify patterns in IPO pric-ing that can be used to increase the likelihood of investpric-ing in “good” IPOs. Relevant re-search questions are: Is underpricing present in the Swedish IPO market? Can investors consistently beat the market by investing in IPOs? Have there been any trends in IPO pric-ing over the sample period? Does IPO pricpric-ing differ between segments, sectors and un-derwriters?
This thesis studies the 185 firms going public through issuing IPOs on Nasdaq OMX Stockholm between 1994 and 2011. The data was originally provided by Nasdaq OMX Nordic but has been verified in several instances. The result shows that Swedish IPOs, on average, are 11.49% underpriced. However, the level of underpricing varies widely between years, segments, sectors and lead managers. For example during the Dot-com bubble ini-tial returns averaged at about 20% whereas after the bubble burst average iniini-tial return were negative 2%.
The structure of this thesis is as follows: section 1 presents background information on why firms go public, how firms go public, results from previous studies and why IPOs are underpriced. Section 3 presents the method and data used, section 4 presents and analyses the results and section 5 concludes.
2 Background
Why do firms go public? A whole thesis could be written to fully answer this question, however that is not the purpose of this study. The textbook explanations for going public include: raising new capital to finance investments, better access to future financing, im-proved liquidity and the ability for shareholders diversify their holdings (Berk, DeMarzo, & Hartford, 2008).
A company can raise new capital by offering existing shareholders and/or the public to subscribe for new shares in the company i.e. a rights issue. Raising capital from the current owners is of course not unique to the public company. However, if the owners already have most of their personal wealth invested in the company they may be less willing or able to invest further in the company. Thus the public company has better access to equity fi-nancing. Pagano, Panetta and Zingales (1998) also found that public firms have better ac-cess to debt financing and are able to borrow at lower interest rates than private firms. Fur-thermore, the public equity market provides firm owners with a platform for easier diversi-fication. For private companies there is no official market for share trading, therefore the cost of finding a buyer is much higher. In public firms there are usually many owners and as the shares are traded on an exchange shareholders can easily change their holdings. Di-versification and liquidity therefore constitutes a major reason for going public. Being pub-licly traded also lowers the owners monitoring costs since it is easy follow the share value in the stock market. For the private firm it much more complicated to know the value of the shares because specialist may be needed to come up with a reasonable share value and even then investors may not be willing to pay that price. Public firms can therefore easier to convince potential investors and/or creditors of the firm’s true value. Moreover, during the going public process firms receives much attention from the analysts, financial press and the public. The increased publicity is likely to result in higher interest for the company; hence going public may have a positive effect on the interest for and sales of the compa-ny’s products or services.
Ritter and Welch (2002) argues that the main reason for a firm to go public is to raise equi-ty capital and to enter the public equiequi-ty market in which the owners can exchange shares for cash at a future date. They argue that nonfinancial reasons only play a minor role in go-ing public decision. This is consistent with Zgo-ingales’ (1995) findgo-ings that publicly traded companies are more likely to be identified by potential acquirers than private firms. Thus, going public may facilitate an acquisition of the firm. Further, Brau, Francis, and Kohers (2003) show evidence that being a public company enables the owners to receive a higher price for their shares than in an outright sale. Pagano et al (1998) show that IPOs often are related to change in the control of the firm and that firms tend to go public when valua-tions for firms in the same industry are relatively high. Rajan and Servaes (1997) and
Loughran, Ritter and Rydqvist (1994) also find that firms’ take advantage of high firm valu-ations in timing the IPO. These findings all leads to the conclusion that firms go public to maximize the value of the firm, essentially the owners’ personal wealth.
Being publicly traded indeed provides many advantages to a company and its owners but taking a firm public is often very costly. There are both substantial direct and indirect costs associated with the transaction. Examples of direct costs are underwriting, legal and audit-ing advisory and marketaudit-ing fees. Indirect costs are the management’s opportunity cost and money left on the table resulting from underpricing the company’s shares. Leaving money on the table essentially means that the firm could have sold less shares at higher price and still raise the same amount of capital or sell the same amount of shares at a higher price, raising more capital. For investors on the other hand, underpricing makes up great oppor-tunities to earn arbitrage profits by subscribing in IPOs and immediately liquidate the posi-tion once the shares starts trading, commonly referred to as stagging or flipping.
Underpricing of IPOs and leaving money on the table have been highly debated over the years. This chapter presents how firms go public, reasons for IPO underpricing, results from previous studies and implications of the efficient market hypothesis.
2.1 The Process of Going Public in Sweden
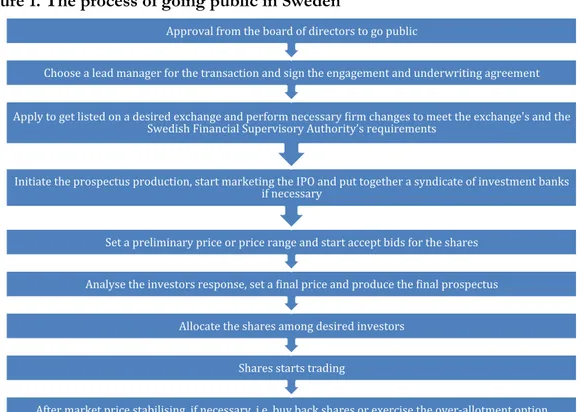
This section is based on Finansinspektionen’s (2007) report “Bakgrundsrapport: Processen vid nyintroduktioner och emissioner (2007:11)”, Jenkinson and Ljungqvist’s (2001) book “Going Public: The Theory and Evidence on How Companies Raise Equity Finance” and Lipman’s (2000) book “The Complete Going Public Handbook: Everything You Need to Know to Successfully Turn a Private Enterprise into a Publicly Traded Company”. The process of taking a firm public in Sweden has been summarised in figure 1.
Figure 1. The process of going public in Sweden
Before the company can start the work towards going public, its board of directors must approve the IPO decision. Once the decision is made, the company need to make sure that regulations set by the Swedish Financial Supervisory Authority and the chosen stock ex-change or unofficial market are met. Involving an advisor i.e. an investment bank already at this stage is normally the case. There are two fundamental ways of selecting advisor. The first method is through a competitive offering in which the investment bank offering the best price is selected. The second is called a negotiated offering where the issuing firm ne-gotiates with several investment banks and may choose advisor for other reasons than the price. Several researchers have found that the fees charged by investment banks are less important than their reputation. Logue, Rogalski, Seward and Foster-Johnson (2002) claim that IPO issuers are willing to pay extra for a reputable investment bank because they are better marketers of the IPO. Further they claim that even though top tier investment banks charge more, the total cost borne by the issuer is lower with a high-quality underwriter, be-cause less money is left on the table. Fernando, Gatchev and Spindt (2005) also found that underwriting spread does not determine the choice of investment bank. Instead they argue that issuing firms choose underwriter based on their reputation because of the more repu-table investment banks superior ability to sell the IPO. Ljungqvist, Marston and Wilhelm (2006) show that previous underwriting performance and lending relations are the main factors when issuers choose lead manager. Krigman, Shaw and Womack (2001) found that the main arguments for changing underwriter are to get a more prestigious underwriter and to purchase influential analyst coverage.
Once the issuer has selected investment bank, which also accept the job, the two parts sign an engagement letter, stating the terms of the underwriter’s involvement. In many IPOs the parts also sign an underwriting agreement stating that the investment bank commits to
pur-After market price stabilising, if necessary, i.e. buy back shares or exercise the over-‐allotment option Shares starts trading
Allocate the shares among desired investors
Analyse the investors response, set a =inal price and produce the =inal prospectus Set a preliminary price or price range and start accept bids for the shares
Initiate the prospectus production, start marketing the IPO and put together a syndicate of investment banks if necessary
Apply to get listed on a desired exchange and perform necessary =irm changes to meet the exchange's and the Swedish Financial Supervisory Authority’s requirements
Choose a lead manager for the transaction and sign the engagement and underwriting agreement Approval from the board of directors to go public
chase unsold shares if investors draw back their offers or the investment bank is unsuccess-ful in selling all shares. In exchange for the risk carried by the bank they keep commission, a percentage of capital raised known as gross spread. The size of the gross spread varies greatly between different underwriters and IPOs. There are also other costs associated with going public such as the management’s opportunity cost, application fees, legal and audit-ing advisory, etc. If the IPO is of substantial size the responsible investment bank (lead un-derwriter/manager) may need to put together a syndicate with other investment banks (partner underwriters) to increase the investor network and sales capacity. The partners are normally only involved in underwriting and/or marketing the IPO to potential investors. At this point the lead underwriter can start preparing the firm for listing and to make sure that they meet relevant regulations. Simultaneously they produce the material required by the financial supervisory authority and the market place.
The Swedish Financial Supervisory Authority requires firms going public to produce a pro-spectus. The prospectus should be written in a way that is easy to understand and contain all information needed to make a well-informed estimation of return opportunity and risk associated with the investment. The prospectus should contain information both about the company, its financial situation and the characteristics of the shares being offered. The of-ficial prospectus must be provided on the issuing firm’s webpage at the latest one day be-fore the offer begins. (Finansinspektionen [FI], 2007). The exchange or the unofficial mar-ket, which the firm aims to quote their shares on, also have extensive regulations that must be met in order to get approved. Since the public knows little about the issuer a due dili-gence investigation of the firm is performed. The due dilidili-gence includes identifying legal contracts (e.g. patents and licensing rights), examining the top management and board’s background and a financial audit making sure that the issuer’s books are in order.
The listing process varies in time between different market places. Getting listed on the Stockholm Stock Exchange may take up to a year (FI, 2007). Therefore the issuing firm and its advisor evaluate plausible market place to get listed on and apply to get listed as soon as possible. Once the application is received the exchange appoints an auditor who works alongside the lead underwriter auditing the material they produce such as the due dil-igence and the prospectus.
During the preparations the issuer and the lead underwriter discuss amount of capital to raise, type of shares to issue, to whom the shares should be offered and the value of the company. There are different ways of pricing an IPO the issuer can set a fixed price or a price interval i.e. book-building (see next page). To come up with the final price or price range the lead underwriter’s analysts’ perform preliminary firm valuations. Valuation meth-od varies widely but the discounted cash flow analysis and peer group analysis are com-monly used (Jenkinson, & Ljungqvist, 2001). To find out investors’ response to a price it is common to send out a preliminary price and prospectus to potential investors. The pro-spectus can then be revised depending on the reaction from the investors’. It is important to notice that the underwriter only may advice the issuing firm regarding the price. It is the issuer that sets the final price. Once the prospectus is sent to and approved by the Swedish Financial Supervisory Authority the investment bank starts marketing and to offer IPO
shares to potential investors. Apart from the syndicate’s marketing, the issuing firm’s top management may go on an IPO road show. During the road show the top management visit and present the company to investors that are considered important to get on board, thus the purpose is to create an interest in the company and the securities offered. Howev-er, it is important that the information disclosure does not vary from the already publicly available information. Other forms of marketing that sometimes are used include press briefings and advertising.
The final stage before going public is to set the final price and allocate the shares among the investors. If using a fixed price and the issue is under-subscribed then all offers can be met and the underwriter take the unallocated shares into its own stock. If over-subscribed the underwriter try to put together a set of investors that will contribute to a good liquidity in the shares. The issuer may also have preferences regarding investors and ownership dis-tribution that the underwriter must have in mind. There is no Swedish law regulating the al-location of shares however the exchange or market normally has rules regarding alal-location of shareholders. The underwriter reports their suggestion regarding allocation but it is the issuer taking the final decision.
The book-building effort, which normally is used in large IPOs, starts with inviting inves-tors to bid for the shares offered. Bids are accepted within the price range specified in the prospectus. Depending on the demand the lead underwriter may revise the initial price range. If the demand is weak it might be in place to lower the price range and vice versa. At the end of the bidding period the lead underwriter has a pretty good understanding of in-vestors demand at different price levels. The issuing firm sets a price with recommenda-tions from the investment bank and start to allocate shares to desired investors. The cho-sen investors are then contacted to confirm their bids. This is when the issuing firm first announce the result from the IPO.
Many underwriting agreements include price stabilising actions taken by the investment bank or the whole syndicate. The reason is to ensure that the initial trading price do not differ much from the issue price. If the share price falls the stabilising manager place buy orders to put upward pressure on the price. If there is excess demand for the issue the in-vestment bank may instead exercise the over-allotment option also referred to as a Green Shoe provision. The option gives the underwriter the right to sell more shares than origi-nally planned, normally to a maximum of 15 per cent of the total capital raised and within 30 days from the issue. Other services provided by the investment bank may include mar-ket making to improve liquidity and/or analyst coverage to provide investors with infor-mation.
2.2 Underpricing of IPOs
IPO pricing has been the focus of many studies before this and most of them show evi-dence for IPO underpricing. Jenkinson and Ljungqvist (2001) show that initial returns are positive in almost all countries2. They come to the conclusion that underpricing is typically
more than 15% in industrialised countries and about 60% in emerging markets. However most research has focused on the IPO market in the United States and the evidence is less complete when looking outside the U.S.
Essentially, underpricing of IPOs means providing some lucky investors with abnormal re-turns at the cost of the issuer, “leaving the money on the table”. As researchers repeatedly have shown evidence for IPO underpricing, one might ask the question why issuers accept such high underpricing of their shares? Loughran, and Ritter (2002) argue that the owners of underpriced issues do not get upset because they realise that they are much wealthier than they originally thought. Further, an issue’s reported underpricing often greatly exag-gerates the original owners wealth loss, unless they sell all their shares at the initial public offering. E.g. suppose that an issue is underpriced by 10% and the original owners sell 20% of the company’s current shares, thus a secondary offering. Then there is only a 2% wealth loss to the original owners. Loughran and Ritter (2002) also argues that issuers are willing to leave large amounts of money on the table in exchange for influential analyst coverage, which they get with the top tier investment banks. But what is the reason for underpricing of initial public offerings? Over the years academics have presented several possible expla-nations. Rock (1986) suggests that IPO underpricing is an efficient way to compensate in-vestors for their informational disadvantage regarding the firm’s true value. Without un-derpricing, uninformed investors would rather buy the shares in the after market once the “good” IPOs have distinguished them selves from the “bad” IPOs. Thus, the underpricing may be thought of as return for taking the risk (Jenkinson, & Ljungqvist, 2001). Allen and Faulhaber (1989) believe that firms underprice their IPOs to signal quality to investors. Jenkinson and Ljungqvist (2001) show that underpricing tend to result in good press for the company e.g. broadcast.com heavily underpriced their issue resulting in an initial return of 249% and a very strong media interest. Further, they argue that underpricing insure against under-subscription and that excess demand in an IPO makes it possible allocate fewer shares to each investor, which minimises the risk of diluting the original owners con-trol of the company. Loughran and Ritter (2002) comes to the conclusion that investment banks underprice, which lowers their commission, to attract investors whom will compen-sate the banks by providing them with business. Chi and Padgett (2005) found that IPO underpricing is at least in part a consequence of low supply and high demand. All in all, even though IPO underpricing is a large cost to the issuer, it may also provide a desired
2 Jenkinson and Ljungqvist (2001) compiled 38 IPO studies covering: Australia, Austria, Belgium, Brazil,
Canada, Chile, China, Denmark, Finland, France, Germany, Great Britain, Greece, Hong Kong, Israel, Italy, Japan, Korea, Malaysia, Mexico, Netherlands, New Zealand, Nigeria, Norway, Philippines, Poland, Portu-gal, Singapore, Spain, Sweden, Switzerland, Taiwan, Thailand, Turkey and USA. They found that IPOs are underpriced in all countries with the exception for tender offers in Great Britain.
outcome (Jenkinson, & Ljungqvist, 2001). Some of the explanations will be covered more in-depth later in this chapter.
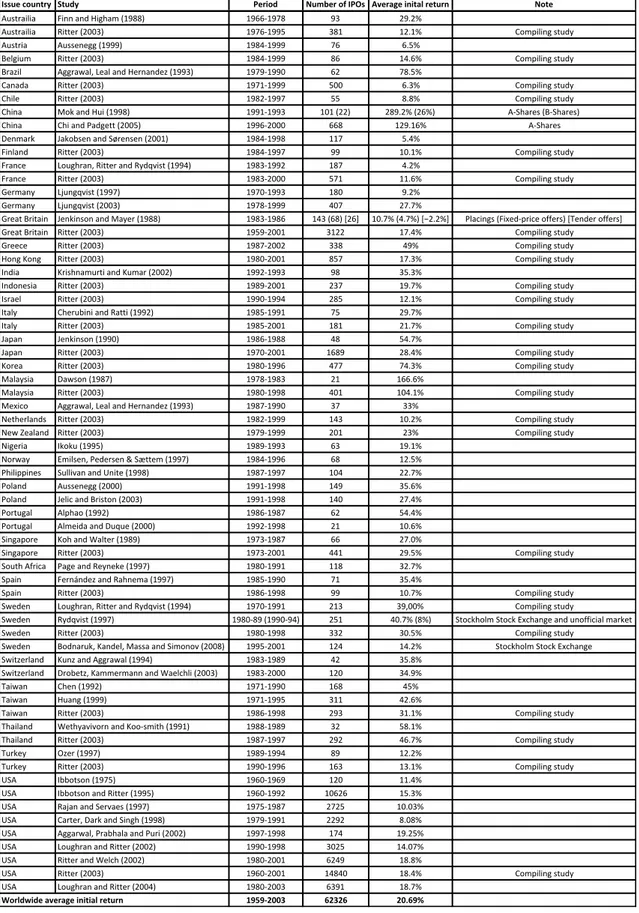
Table 1 presents results from previous IPO underpricing studies. Most studies focusing on the Swedish market uses old data and therefore needs to be updated. Rydqvist (1997) ex-plains that pre 1990 IPOs were allocated to employees, customers and suppliers as tax-efficient compensation. After tax changes were imposed in 1990 underpricing of IPOs dropped significantly. Rydqvist’s (1997) 1990-1994 data set and Bodnaruk et al.’s (2008) studies are therefore the best indications of the current IPO underpricing in Sweden. From table 1 it can also be concluded that IPO underpricing tend to be higher in emerging mar-kets compared to developed economies. Most emerging marmar-kets have average initial re-turns above 20%. Brazil, China, Korea and Malaysia have rather extreme underpricing all with average initial returns above 74%. In developed economies average initial is return is typically in the range of 5-30%. However, there are some extreme cases both in emerging and developed markets e.g. the low average initial return of 9% in Chile and high average initial returns of 49% in Greece. Nevertheless, Jenkinson and Ljungqvist’s (2001) conclu-sion that initial returns are higher in emerging markets can be confirmed.
Even though investors need incentives in terms of higher returns to take on more risk, av-erage first day returns of 289% in China3 (Mok & Hui, 1998) seems very excessive. Chi and
Padgett (2005) argues that the extreme underpricing in China is explained by a big gap be-tween IPO supply and demand. Bebe-tween 1996 and 2000 approximately 800 firms went public by issuing IPOs in China. 800 firms may not sound very low but keep in mind that China’s economy is almost 13 times as large economy as the Swedish economy and that the Chinese population is almost 144 times the Swedish population.4 Thus Sweden has a much
higher supply of IPOs with its 101 firms issuing IPOs during the same time period (see ap-pendix 7.1). Because the demand for Chinese IPOs by far exceeds the IPO supply, the shares are distributed using a lottery system but only a small per cent of the subscriptions get allocations (Chi, & Padgett). One might therefore argue that the IPO market is likely to follow the basic economic principles of supply and demand. Then, investors can expect relatively low initial returns when IPO supply is relatively high and vice versa. To which ex-tent this is true depends on the elasticity of supply in the IPO market.
3 It applies to Chinese A-shares, which are sold exclusively to domestic investors and traded in Yuan. Chines
B-shares are traded in US dollars on the Shanghai Stock Exchange and in Hong Kong dollars on the Shen-zhen Stock Exchange and may also be traded by foreign investors. (Chi, & Padgett, 2005)
4 In 2010 China’s GDP was 5878.257 Billion USD compared to 458.725 Billion USD in Sweden. China’s
population in the same year were 1341.414 million persons compared to the 9.327 million persons in Swe-den. (International Monetary Fund, 2011)
Table 1. Previous studies
!""#$%&'#()*+ ,)#-+ .$*/'- 0#12$*%'3%!.4" 56$*78$%/(/)79%*$)#*( 0')$
!"#$%&'('& )'**+&*,+-'./&0+123445 236672384 39 :3;:<
!"#$%&'('& ='$$>%+1:??95 23867233@ 942 2:;2< AB0C'('*.+#$",D
!"#$%'& !"##>*>..+123335 234E72333 86 6;@<
F>(.'"0 ='$$>%+1:??95 234E72333 46 2E;6< AB0C'('*.+#$",D
F%&G'( !..%&H&(I+J>&(+&*,+->%*&*,>G+123395 23837233? 6: 84;@<
A&*&,& ='$$>%+1:??95 238272333 @?? 6;9< AB0C'('*.+#$",D
A/'(> ='$$>%+1:??95 234:72338 @@ 4;4< AB0C'('*.+#$",D
A/'*& KBL+&*,+-"'+123345 233272339 2?2+1::5 :43;:<+1:6<5 !7M/&%>#+1F7M/&%>#5
A/'*& A/'+&*,+N&,.>$$+1:??@5 23367:??? 664 2:3;26< !7M/&%>#
O>*0&%L P&LBQ#>*+&*,+MR%>*#>*+1:??25 234E72334 228 @;E<
)'*(&*, ='$$>%+1:??95 234E72338 33 2?;2< AB0C'('*.+#$",D
)%&*S> JB"./%&*I+='$$>%+&*,+=D,TU'#$+1233E5 23497233: 248 E;:<
)%&*S> ='$$>%+1:??95 23497:??? @82 22;6< AB0C'('*.+#$",D
V>%0&*D JW"*.TU'#$+123385 238?72339 24? 3;:<
V>%0&*D JW"*.TU'#$+1:??95 238472333 E?8 :8;8<
V%>&$+F%'$&'* P>*L'*#B*+&*,+K&D>%+123445 234972346 2E9+1645+X:6Y 2?;8<+1E;8<5+XZ:;:<Y N(&S'*.#+1)'[>,7C%'S>+B\\>%#5+X]>*,>%+B\\>%#Y
V%>&$+F%'$&'* ='$$>%+1:??95 23@37:??2 92:: 28;E< AB0C'('*.+#$",D
V%>>S> ='$$>%+1:??95 23487:??: 994 E3< AB0C'('*.+#$",D
-B*.+^B*. ='$$>%+1:??95 234?7:??2 4@8 28;9< AB0C'('*.+#$",D
_*,'& ^%'#/*&0"%$'+&*,+^"0&%+1:??:5 233:72339 34 9@;9<
_*,B*>#'& ='$$>%+1:??95 23437:??2 :98 23;8< AB0C'('*.+#$",D
_#%&>( ='$$>%+1:??95 233?7233E :4@ 2:;2< AB0C'('*.+#$",D
_$&(D A/>%"Q'*'+&*,+=&$$'+1233:5 234@72332 8@ :3;8<
_$&(D ='$$>%+1:??95 234@7:??2 242 :2;8< AB0C'('*.+#$",D
P&C&* P>*L'*#B*+1233?5 234672344 E4 @E;8<
P&C&* ='$$>%+1:??95 238?7:??2 2643 :4;E< AB0C'('*.+#$",D
^B%>& ='$$>%+1:??95 234?72336 E88 8E;9< AB0C'('*.+#$",D
K&(&D#'& O&H#B*+123485 238472349 :2 266;6<
K&(&D#'& ='$$>%+1:??95 234?72334 E?2 2?E;2< AB0C'('*.+#$",D
K>['SB !..%&H&(I+J>&(+&*,+->%*&*,>G+123395 23487233? 98 99<
`>$/>%(&*,# ='$$>%+1:??95 234:72333 2E9 2?;:< AB0C'('*.+#$",D
`>H+a>&(&*, ='$$>%+1:??95 238372333 :?2 :9< AB0C'('*.+#$",D
`'.>%'& _LBL"+1233@5 234372339 69 23;2<
`B%H&D b0'(#>*I+N>,>%#>*+c+Md$$>0+123385 234E72336 64 2:;@<
N/'('CC'*># M"(('U&*+&*,+e*'$>+123345 234872338 2?E ::;8<
NB(&*, !"##>*>..+1:???5 233272334 2E3 9@;6<
NB(&*, P>('S+&*,+F%'#$B*+1:??95 233272334 2E? :8;E<
NB%$".&( !(C/&B+1233:5 234672348 6: @E;E<
NB%$".&( !(0>',&+&*,+O"T">+1:???5 233:72334 :2 2?;6<
M'*.&CB%> ^B/+&*,+f&($>%+123435 238972348 66 :8;?<
M'*.&CB%> ='$$>%+1:??95 23897:??2 EE2 :3;@< AB0C'('*.+#$",D
MB"$/+!\%'S& N&.>+&*,+=>D*>L>+123385 234?72332 224 9:;8<
MC&'* )>%*g*,>G+&*,+=&/*>0&+123385 234@7233? 82 9@;E<
MC&'* ='$$>%+1:??95 234672334 33 2?;8< AB0C'('*.+#$",D
MH>,>* JB"./%&*I+='$$>%+&*,+=D,TU'#$+1233E5 238?72332 :29 93I??< AB0C'('*.+#$",D
MH>,>* =D,TU'#$+123385 234?743+1233?73E5 :@2 E?;8<+14<5 M$BSL/B(0+M$BSL+b[S/&*.>+&*,+"*B\\'S'&(+0&%L>$
MH>,>* ='$$>%+1:??95 234?72334 99: 9?;@< AB0C'('*.+#$",D
MH>,>* FB,*&%"LI+^&*,>(I+K&##&+&*,+M'0B*BU+1:??45 233@7:??2 2:E 2E;:< M$BSL/B(0+M$BSL+b[S/&*.>
MH'$G>%(&*, ^"*G+&*,+!..%&H&(+1233E5 234972343 E: 9@;4<
MH'$G>%(&*, O%BQ>$GI+^&00>%0&**+&*,+f&>(S/('+1:??95 23497:??? 2:? 9E;3<
]&'H&* A/>*+1233:5 23827233? 264 E@<
]&'H&* -"&*.+123335 23827233@ 922 E:;6<
]&'H&* ='$$>%+1:??95 234672334 :39 92;2< AB0C'('*.+#$",D
]/&'(&*, f>$/D&U'UB%*+&*,+^BB7#0'$/+123325 234472343 9: @4;2<
]/&'(&*, ='$$>%+1:??95 234872338 :3: E6;8< AB0C'('*.+#$",D
]"%L>D hG>%+123385 23437233E 43 2:;:< ]"%L>D ='$$>%+1:??95 233?72336 269 29;2< AB0C'('*.+#$",D eM! _QQB$#B*+1238@5 236?72363 2:? 22;E< eM! _QQB$#B*+&*,+='$$>%+1233@5 236?7233: 2?6:6 2@;9< eM! =&W&*+&*,+M>%U&>#+123385 238@72348 :8:@ 2?;?9< eM! A&%$>%I+O&%L+&*,+M'*./+123345 238372332 ::3: 4;?4<
eM! !..&%H&(I+N%&Q/&(&+&*,+N"%'+1:??:5 233872334 28E 23;:@<
eM! JB"./%&*+&*,+='$$>%+1:??:5 233?72334 9?:@ 2E;?8<
eM! ='$$>%+&*,+f>(S/+1:??:5 234?7:??2 6:E3 24;4<
eM! ='$$>%+1:??95 236?7:??2 2E4E? 24;E< AB0C'('*.+#$",D
eM! JB"./%&*+&*,+='$$>%+1:??E5 234?7:??9 6932 24;8<
:;<;=>??@ A>@>A >?BA;C D'*9-E/-$%76$*78$%/(/)/79%*$)#*(
2.2.1 Information asymmetries
As discussed previously one of the firm’s main motivation for going public is to maximize firm value and thus the owners’ personal wealth. Therefore firms generally go public when firms in the industry receive high valuations. The investors are however, less informed of the firm’s true value, which creates an information asymmetry problem that gives an ad-vantage to the issuer. Rock (1986) explains IPO underpricing as a natural consequence of the information asymmetry between the issuer and the investor and that issuers underprice to compensate investors for their informational disadvantage.
Akerlof (1970) first explained the information asymmetry problem with the used car mar-ket. He argued that the seller of a used car better knows the value of the car compared to the buyer. Because the buyer cannot distinguish between a good and a bad car he will offer the same price for both the good and the bad car. Hence, owners of good cars will keep their cars since they know their cars superior value to those bad cars. Putting this into the IPO markets context, issuers know the value of their firms but investors cannot distinguish between good and bad firms. Because investors cannot distinguish between good and bad IPOs, they will offer the same price for both IPOs. Then, good firms may be less willing to go public because they have to sell their shares at a discount. The bad firms however, have an increased incentive to go public because their shares are likely to be overpriced. This causes an adverse selection problem were mainly bad firms go public and good firms stay private. This may explain why the average firm going public show long-run underperfor-mance as Ritter (1991), Brav and Gompers (1997), Jenkinson and Ljungqvist (2001) and many more have shown evidence for. However, Rock (1986) argues that there are both in-formed and uninin-formed investors in the IPO market. The inin-formed investors know the true value of the IPO whereas the uninformed investor has no information on the true val-ue of the IPO. Since, the uninformed investor is unable to distinguish between a good and a bad IPO he will invest equal amount in all IPOs. The informed investor however, who is able to identify good and bad IPOs will only invest in good IPOs. Because IPOs with good prospects typically are oversubscribed, Rock (1986) argues that the informed investor will register interest for more shares than he is in fact willing to purchase. This is to ensure the allocation he is truly after. The uniformed investor on the other hand, will only subscribe for his desired allocation and is therefore likely to get fewer shares than wanted since good issues tend to be oversubscribed. For IPOs with bad outlook, the informed investor does not register any interest and therefore receives no allocation. The uninformed investor however, subscribes for the same value as in the good IPO case. Because the interest for bad IPOs tends to be lower, the uniformed investor is likely to get his desired share alloca-tion. The uninformed investor will therefore receive a lower average initial return than that for the whole IPO market. The informed investor on the other hand, is likely to receive a higher average return than the total average initial IPO return since he only invests in good performing IPOs.
Because the underwriter’s income from an IPO transaction depends on the capital raised they want to minimise the risk of having to take in large quantities of the issuers shares into own stock. Thus, banks may be tempted to set a lower price to ensure the sale of as many
shares as possible. But on the other hand they want to set a high price to maximise the total capital raised. Both maximises fees charged. Because the bank has superior knowledge of asset pricing a moral hazard problem arises were it is uncertain whether the bank acts in the best interest of their client or in their own best interest. However, investment banks cannot underprice IPOs too much since it would mean loosing underwriter business on the other hand they must underprice enough to attract investors and not loose business from inves-tor clients (Jenkinson, & Ljungqvist, 2001). Therefore it can be assumed that investment banks looking to stay in business want to underprice moderately.
Signalling is also used as a common explanation for underpricing IPOs. As Ibbotson (1975, p. 264) puts it, issuers underprice to “leave a good taste in investors mouths so that future underwritings from the same issuer could be sold at attractive prices”. According to Zin-gales (1995) owners decide to take their firm public to maximize the revenue of a future sale of the firm. He suggest that equity carve-outs, where the initial owners sell only a small fraction initially and the rest of the company at a future date when the share price has in-creased substantially, is the most value maximizing strategy when selling a firm in most cas-es. Pagano, Panetta and Zingales (1998) show that the controlling group had changed sig-nificantly three years after a firm’s IPO, which to some extent confirm that a future sale of the firm is a reason for taking it public. Allen and Faulhaber (1989) suggest that firms de-liberately underprice their IPOs to signal their good prospects to investors. However, be-cause firms with bad prospects cannot recoup the loss resulting from underpricing they cannot afford to send the signal. The good firms share prices will eventually increase as in-vestors realise the firms true value. By only selling a fraction of the company at the IPO the signalling theory can be used to maximise the owners’ total gain. When the share price has risen to a satisfactory level and the potential lock-in period (the time period after the IPO in which the original owners are not allowed to sell their shares in the company) has ex-pired the owners can take advantage of a high share price and sell their existing stakes. Sig-nalling by underpricing thus suggest that the initial owners utilities are maximized.
2.2.2 Competition in the IPO market
Several studies have shown that U.S. investment banks tend to charge a higher gross spread than their international competitors. For instance, Chen and Ritter (2000) show that the gross spread for U.S. IPOs is clustered at 7% and that spreads in other countries typically is about half of that. However, Jenkinson and Ljungqvist (2001) argue that underwriters also can compete for business with the offer prices they set. Loughran and Ritter (2002) found that IPOs, on average, leave about twice the size of the gross spread on the table. Ljungqvist, Jenkinson and Wilhelm (2003) find that U.S. investment banks charge higher fees than local banks outside USA. However, they also show that U.S. banks set better of-fer prices, which results in less underpricing, thus leaving less money on the table. Logue et al. (2002) argues that top tier investment banks charge higher spreads but leave less money on the table. Thus, there seems to be a trade-off between the gross spread charged and the level of underpricing. The direct fees i.e. gross spread charged by banks may seem high but the indirect costs i.e. money left on the table may be even higher. Gross spreads and money
left on the table seem to vary widely among different banks, choosing the right lead man-ager may therefore have great impact on the total cost borne by the issuing firm.
Investment banks openly admit that IPO transactions are very profitable and that there is no price competition because they do not want to make it a commodity business (Chen, & Ritter, 2000). If prices are not set at competitive levels one might ask why do not new firms enter the market and compete on the fees? Then issuing firms would be able to shop around for the bank with the lowest fees. Jenkinson and Ljungqvist (2001) argue that repu-tation is absolutely crucial in the financial markets, which makes it hard for new entrants to compete with the well-established players. Hence, the IPO market might not be perfectly competitive. Because a large investor network is essential to be successful in the underwrit-er market the largunderwrit-er banks may have a competitive advantage to their smallunderwrit-er competitors. Nevertheless, Swedish and Scandinavian banks compete with both big European and top tier U.S. banks, which certainly increase the competition in the Swedish IPO market. 2.2.3 IPO risk
The risk of investing in a company’s shares is that its value will fall and in worst-case sce-nario that the security becomes worthless because the company goes bankrupt. Thus, the risk faced by the IPO investor is that the share price will fall below the offer price and/or that the investor are not able to sell the shares due to poor liquidity. The volatility measures standard deviation and variance are the most common way to measure security risk. How-ever because a private company has no record over their historical share prices it is impos-sible to use volatility to measure risk for a single IPO. The shares track record also provides a benchmark when evaluating if a share is correctly priced. In a rights issue for example, which are underpriced to encourage investments from current shareholders or the public, the historical share price is necessary to conclude by how much the offer is underpriced. Consequently the lack of a historical price makes it harder to estimate whether the IPO‘s offer price is set over, under or at the true value of the share. Further, there is a risk that there will be low or no trading activity in the shares once they start trading. However, most IPO transactions contain an agreement that requires the lead or a stabilising manager to uphold the share liquidity in the aftermarket. Thus, if the trading activity is low the bank can buy shares to create demand or sell more shares to increase supply. The interest for the IPO during the pre-market may provide some indication of the future demand for the shares.
Even though the risk of a single IPO cannot be estimated using volatility measures, it is possible to come up with the volatility for IPOs in general using a set of previously issued IPOs. This should provide investors with some indication of how much IPOs tend to fluc-tuate around the mean initial return. To make a more precise estimate of a specific IPO’s risk requires a much more complex analyses, involving studying the prospectus, annual re-ports, the company’s and its branch outlooks, etc.
It is well known that there is a positive relationship between risk and return i.e. investors demand and are rewarded with higher returns when investing in risky securities compared to investing in less risky securities. The previous studies listed in table 1 show that initial
IPO returns are, on average, high. Thus, because initial returns in IPOs are high, the risk of investing in IPOs must also be high. Still, investing in a large enough number of IPOs should provide investors with a high average initial return. Some of the IPOs will produce relatively low, or even negative, initial returns whereas other will generate relatively high ini-tial returns. Thus, investors average iniini-tial return will move towards the total IPO markets average initial return, as the number of IPO investments increases. Hence, the risk of shrinking the investors’ wealth decreases with the number of IPO investments. Diversifica-tion is well argued to reduce market risk in portfolio theory. However, investors may not always be able to get share allocation in all IPOs they subscribe for. In undersubscribed is-sues, all investors of course get allocated since the issuer and the bank want to sell as many shares as possible. In oversubscribed issues on the other hand, there is an excess demand for the shares. Consequently, not all investors get allocation and/or investors get less share allocation than they desire. Hence, the risk that an IPO investor’s average initial return falls below the total market average return decreases with the number of investments but in-crease if the investor is unable to get share allocation.
Jenkinson and Ljungqvist (2001) compile different uncertainty factors that academics have found affects underpricing of IPOs e.g. firm age, width of the offer range, earnings forecast and underwriter reputation. A new started firm is obviously more risky than a firm with es-tablished operating relationships and a track record of positive results. Hanley (1993) found that the width of the offer price range indicates the uncertainty about an IPO’s true value. A wide offer range indicates greater uncertainty about the true value of the company’s shares and vice versa. Clarkson and Merkley (1994) found a relationship between disclosing earnings forecasts in the prospectuses and uncertainty about the true issue price. Namely that disclosing earnings forecast in the prospectus decreases the uncertainty about the true value. As argued previously a reputable investment bank can benefit the issuer in many ways, for example by creating trust among investors. Further, Ritter (1984) argues that risk-ier IPOs are more underpriced than less risky IPOs.
To conclude, investing in IPOs is riskier than investing in many other securities, therefore IPO investors are on average rewarded with higher returns. Even though there are high risks associated with IPO investing they can be minimised by diversification and firm risk analyses.
2.3 Implications of the Efficient Market Hypothesis
An efficient market is “a market where prices at every point in time represent best esti-mates of intrinsic value. This implies in turn that, when an intrinsic value changes, the actu-al price will adjust “instantaneously”, where instantaneously means, among other things, that the actual price will initially overshoot the new intrinsic values as often as it will under-shoot it” (Fama, 1965, p. 94). Thus, in an efficient security market security prices fully re-flect all available information. In 1970 Fama developed the three different strengths of market efficiency, weak form efficient, semi-strong form efficient and strong form effi-cient. If the market is weak form efficient historical prices cannot be used to predict future stock prices. For the semi-strong form to hold all publicly available information is
immedi-ately incorporated into stock prices, therefore investors cannot use already public infor-mation to consistently earn abnormal returns. If the market is strong form efficient inves-tors private information cannot be used to predict future prices, thus insiders are not be able to consistently earn abnormal returns. (Fama, 1970).
Because empirical evidence shows that underpricing exists in almost all IPO markets, one must either reject the efficient market hypothesis or believe that issuers deliberately under-price their issues. Assuming the latter, the market must at least be semi-strong efficient for the underpricing definition (the difference between the offer price and the first day closing price) to hold. To justify the use of first day’s closing prices in the definition, the shares of-fered must be assumed to have adjusted to their “intrinsic value” at the end of the first trading day, which the semi-strong form of market efficiency assumes. Behavioural finance proponents on the other hand, would oppose the fast adjustment and perhaps use the first week or moth’s average price instead. However, the purpose of this study is not to con-clude how much money the issuing firm left on the table but to examine if investors can earn abnormal returns by investing in IPOs. Thus, whether the underpricing definition holds in an efficient market or not is somewhat irrelevant.
3 Method and Data
This study focuses on numerical data to examine underpricing and differences in under-pricing differences in the Swedish IPO market, thus it uses a descriptive quantitative ap-proach. Ritter and Welch (2002) claim that the typical way academics measure IPO under-pricing, is by taking the percentage difference between the issue/offer price and the first day closing price. Underpricing of IPOs is therefore often referred to first-day return or initial return. Because this definition is common practice within the field, it is also used when calculating underpricing in this study. The mathematical formula of underpricing is as follows:
!"#$%&%'('") !"#$%$&'&() = !"#$% !"# !"#$%&' !"#$% − !"!"# !"#$% !""#$ !"#$%
The data set is composed of all firms listing on the major Swedish Stock Exchange, Nasdaq OMX Nordic Stockholm (Stockholm Stock Exchange), between 1994 and 2011 though is-suing IPOs. Firms listing on the minor official stock exchange, Nordic Growth Market Equity, and unofficial exchanges are not included in this study due to insufficient infor-mation. The IPO data consists of secondary data supplied by Nasdaq OMX Nordic, which have been verified in several instances. The issue prices have been confirmed using the Swedish Tax Agency’s stock history, prospectuses supplied by the Swedish Financial Su-pervisory Authority and issuing firms’ webpages. First day closing prices has been collected from Nasdaq OMX Nordic’s webpage. Information on dead stocks, e.g. firms that have been acquired by other firms or gone bankrupt, has been collected from microfilms of the financial newspaper Dagens Industri; the stock price information from Dagens Industri has also been used to verify the closing prices supplied by Nasdaq. Information on the acting Lead Manager for the issues has been gathered from the issuing firms prospectuses.
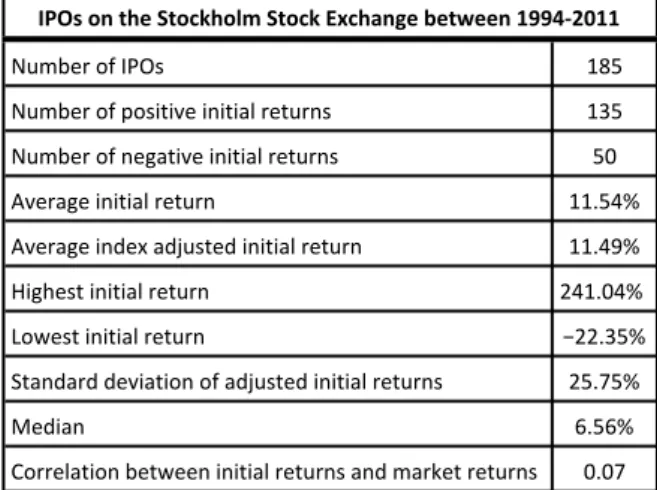
185 firms issued IPOs and listed on the Stockholm Stock Exchange between 1994-2011. This study examines all those 185 firms and should therefore provide a good indication of underpricing in the Swedish IPO market as a whole. Table 2 present descriptive statistics for the data. The IPOs were on average underpriced by 11.49% but the initial returns var-ied greatly and ranged from -22.35% to 241.04%. The high return variation generates a high standard deviation of 25.75% in the Swedish IPO market, which essentially means that IPO returns are highly uncertain. The results are presented further in the result and analysis chapter.
Table 2. Descriptive statistics for the data set
Figure 2 further illustrates the IPO data set and ranks the IPO observations from the high-est to lowhigh-est initial return. As can be seen in the figure the highhigh-est initial return is more than twice as high as the second highest initial return and is therefore an extreme value. However, it is not excluded from the data set since this thesis aims to investigate all IPOs issued on Nasdaq OMX Stockholm between 1994-2011.
Figure 2. Initial returns for IPOs in the data set
!"#$%&'()'*+,- ./0 !"#$%&'()'1(-2324%'2523267'&%3"&5- .80 !"#$%&'()'5%96324%'2523267'&%3"&5- 0: ;4%&69%'2523267'&%3"&5 ..<0=> ;4%&69%'25?%@'6?A"-3%?'2523267'&%3"&5 ..<=B> C29D%-3'2523267'&%3"&5 E=.<:=> F(G%-3'2523267'&%3"&5 HEE<80> I365?6&?'?%42632(5'()'6?A"-3%?'2523267'&%3"&5- E0<J0> K%?265 L<0L> M(&&%7632(5'$%3G%%5'2523267'&%3"&5-'65?'#6&N%3'&%3"&5- :<:J !"#$%&'%()*%+(&,-)&./%+(&,-%01,)2'3*%4*(5**'%67789:;66 !"#$% &#$% '#$% (&#$% ('#$% &&#$%
3.1 Statistical significance
A null hypothesis is set up to confirm the significance of the results. The hypothesis is test-ed using a linear regression between initial IPO returns (dependent variable) and the corre-sponding OMXS30 returns (independent variable).
!!: !"#$!%# !"!#!$% !"# !"#$!% ≤ !"#$!%# !"#$30 !"#$!% !!: !"#$!%# !"!#!$% !"# !"#$!% > !"#$!%# !"#$30 !"#$!%
The null hypothesis is rejected at α = 10%, verifying that positive initial IPO returns are statistically significant. Thus, there is a 90% probability of earning abnormal returns when investing in IPOs. A 90% confidence interval is chosen since the 95% and 99% confidence intervals are unable to prove statistical significance. The regression output is found in ap-pendix 1.
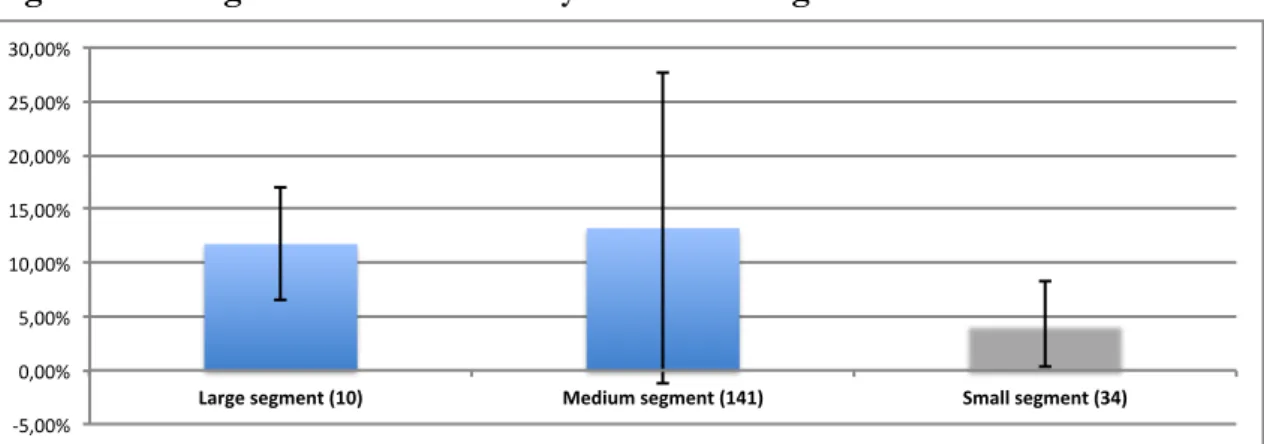
3.2 Cross-sectional study
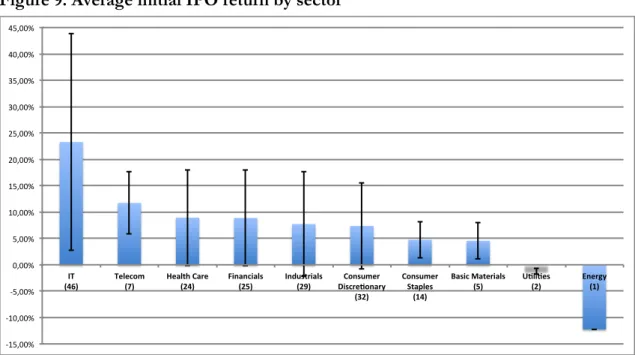
A cross-sectional study is used to examine underpricing differences between different years, market segments, sectors and lead managers. In the first analysis, IPOs are divided in to 18 subsets depending on which year between 1994-2011 the IPO was issued 1994-2011. In the second analysis, IPOs are divided into 3 subsets depending on which market seg-ment the IPOs listed in. Before Nasdaq acquired the Stockholm Stock Exchange, shares were divided between the three different lists A, O and OTC depending on the trade vol-ume of the shares. Essentially, the largest companies were listed on the A-list, the smallest on the OTC-list and the midsized companies on the O-list. After the acquisition Nasdaq made some changes to the subdivisions of shares creating the three segments Large Cap, Mid Cap and Small Cap. Thus, shares are still divided into groups based on the size of the company. Therefore, three market segments are presented, one large segment including both the A-list and the Large-Cap issues, one medium segment including the O-list and the Mid-Cap issues and finally one small segment including the OTC-list and the Small-Cap is-sues. This is to create less confusion and to make it easier to follow the reasoning. Keep in mind though that when referring to IPOs issued in the large segment it can be IPOs listed on either the A-list or Large-Cap and the same goes for the medium segment and small segment. The third analysis divides IPOs into 10 subsets depending on the issuing firms sector classifications according to the Global Industry Classification Standard (GICS), also used by Nasdaq. The different classifications and thus subsets are Energy, Materials, Indus-trials, Consumer Discretionary, Consumer Staples, Health Care, Financials, Information Technology (IT), Telecommunication Services (Telecom) and Utilities (MSCI, 2010). In the fourth analysis IPOs are divided into 29 subsets, one for each investment bank who acted as lead manager for at least one IPO transaction. In some of the IPOs two or more banks acted as joint lead managers. These IPOs will therefore appear in each lead manager’s sub-set. Some of the banks have acquired other banks that were active in the IPO market. In most cases, the acquired banks will be gathered under the acquiring bank’s name. When re-ferring to IPOs lead by Kaupthing it includes IPOs led by the acquired banks Matteus, Nordiska and Aragon. Nordea include Aros, Nordbanken and MNB Maizels. Swedbank
include Föreningsbanken and Sparbanken. In 2010 Carnegie acquired HQ but since they were such a big player in the IPO market they are presented separately. Cerdit Lyonnais, Fisher Partners, Kaupthing, Lehman Brothers and S.G. Warburg were also acquired by other banks, however, none of the acquirers have been present in the Swedish market since which is why their original names are used. Finally, the results from the different analyses are compiled to present a general picture of the underpricing in the Swedish IPO market. In the cross sectional study initial returns are adjusted for movements in the stock market index, OMXS30. If initial returns are positive after the market movement adjustment it can be concluded that IPOs outperform the market. Since closing prices are used when calcu-lating initial returns for IPOs closing prices will also be used when calcucalcu-lating the index re-turn. The stock market movements are calculated as follows.
!!"#$!" = ln !"#$%& !"#$% !"#$30! !"#$%& !"#$% !"#$30!
3.3 Granger causality tests
The Granger causality test determines a relationship between two time series. In contrast to correlations, which simply states how strong the relationship between two variables is, the Granger causality test is a statistical hypothesis test that concludes which variable is caused by the other, or if both are caused by each other. Hence, with a significant Granger causali-ty test one variable can be used to forecast the other variable. Granger causalicausali-ty tests have been used to strengthen the results and analysis by confirming or rejecting relationships be-tween different variables.
!!: !"#$30 !"#$ !"# !"#$%&" !"#$% !"!#!$% !"#$!%& !!: !"#$30 !"#$ !"#$%&" !"#$% !"!#!$% !"#$!%&
The null hypothesis cannot be rejected for any of the significance levels 90%, 95% or 99%, thus OMXS30 returns does not affect initial returns.
!!: !"#$%&# !""#!$ !"!#!$% !"#$!% !"#$ !"# !"#$%&" !"#$% !". !" !"# !""#$" !ℎ! !"##"$%&' !"!"
!!: !"#$%&# !""#!$ !"!#!$% !"#$!% !"#$ !"#$%&" !"#$% !". !" !"# !""#$" !ℎ! !"##"$%&' !"#$
The null hypothesis cannot be rejected for any of the significance levels 90%, 95% or 99%, thus average annual initial return in one year does not affect the number of IPO issues the following year.
!!: !"#$30 !"#$ !"# !"#$%&" !"#$% !". !" !"# !""#$" !!: !"#$30 !"#$ !"#$%&" !"#$% !". !" !"# !""#$"
The null hypothesis is rejected at α = 10% and 1 lag for the period between 1994-2011 and at α = 5% between 2000-2011. Thus, OMXS30 returns affect the number of IPO issues in the Swedish IPO market.
3.4 Criticism of sources
Because the exchange where the firms listed, Nasdaq OMX Stockholm, supplied the IPO data it is considered very reliable. Because the Swedish Tax Agency, Dagens Industri and the issuing firms ‘prospectus’ have verified much of the information its reliability is further enhanced. However, no matter the thoroughness of the data handling there is always the risk of human errors. The references used are also considered reliable, since the focus has been on work from the most acknowledged researchers within the subject. Furthermore, the oldest and most recent studies have been given less attention on to eliminate the risk of outdated and inaccurate results. Also the results from the study are considered reliable first-ly because they are statisticalfirst-ly significant and secondfirst-ly because they are inline with the re-sults from previous studies.
4 Results and Analysis
Between 1994 and 2011, 185 firms went public through Initial Public Offerings on the Stockholm Stock Exchange. The average initial IPO return after adjustment for market movements in the OMXS30 index were 11.49%. The result is statistically significant at α = 10%, meaning that 9 of 10 IPOs perform abnormal returns. This empirically proves that IPOs issued in the Swedish IPO market are underpriced. Consequently, IPOs provide in-vestors with great opportunities to earn abnormal returns. But as always, in order to achieve high return investors must be willing to accept more risk. The uncertainty of re-turns measured by standard deviation is much higher for the IPOs (25.75%) compared to that of the market (1.51%). Therefore, IPO investors must expect quite high variation in initial returns. Nevertheless, 73% of the IPOs generated positive initial returns, which puts the odds in favour of the IPO investor. The highest initial return of 241.04% is truly desir-able to any investor but not many investors are willing to accept the risk of an initial loss of 22.35%, which is the most negative initial return for an IPO during the period. Thus, stag-ging is not a perfect investment strategy that always generates abnormal returns.
This chapter will further examines the Swedish IPO market’s characteristics and analyse how investors may benefit from the knowledge.
4.1 Time trends
The highest initial return of 241.04% is more than twice as high as the second highest ini-tial return (104.84%) and thus an extreme value. The reason for the IPO’s extreme under-pricing is likely to be described by the timing of the IPO. As can be seen in figure 3, it was issued just before the stock market peaked during the Dot-com bubble. Excluding the ex-treme value from the data set yields an average initial return of 10.24%, only a modest de-crease of 1.25%. The standard deviation, however, is substantially reduced and falls by
6.33%, from 25.75% to 19.42 %. Because IPOs outperform the market by far even when excluding the extreme value, it will not be excluded further in the analysis. Also the IPO with the largest initial loss of -22.35% can be explained by the timing of the issue. It was is-sued in the middle of 2001 after the market had plunged 45% from its all time high at 1539 just over a year earlier. After the IPO was issued the stock market continued to fall for an-other year before hitting the bottom at 421 in 2002. The stock market had then fallen 73%. Thus the IPO was issued during of one of the worst economic downturns in history. Keep-ing in mind that the cause of the downturn was a security price bubble, makes it is easy to understand investors’ scepticism towards high-risk securities. The ten years following the Dot-com bubble (2002-2011) initial returns did not fluctuate as much and stayed at much lower levels compared to the 90s, see figure 4. The average initial return for the period was 4.36% and the standard deviation for the period was 9.17%, which both are significantly lower than for the whole period.
Figure 3. Index adjusted initial IPO returns and the stock market movement
The line represents the OMXS30 value between 1994-‐2011 and the dots represent the IPO issued during the same period. The stock market value is measured on the left vertical axis and initial IPO returns are measured on the right vertical axis. The dots highlighted with a number next to them in-‐ dicate the highest and lowest initial IPO return and the peak and bottom of the Dot-‐com bubble.
With the example of extreme initial IPO returns in mind, the relationship between the stock market and the IPO market seems obvious. However, a Granger causality test shows that OMXS30 in fact does not affect initial returns. This is further confirmed by a very low R square statistic, stating that very little of initial returns can be explained by OMXS30 re-turns5. This contradicts the observation that the highest and lowest initial return can be
ex-plained by market timing. Figure 4 further illustrates the relationship between initial IPO return and the stock market movement. Only in 9 out of 17 years does both initial returns and the stock market either increase or decrease at the same time from the previous year. Thus, the IPO market moves in the opposite direction than that of the stock market in nearly 50% of the cases, again concluding that stock market returns have little forecasting power over initial IPO returns. However, there are patterns that investors can benefit from knowing. The highest average initial returns and number of IPO issues occurred during the
5 The R square statistic can be found in Appendix 1. A correlation of 0.07 between the two variables further
indicates a strong independence between initial IPO returns and OMXS30 returns.
!"#$ %!&$ #&'($ #)&*$ +"",$ "!#,$ !"#$% !&'$% #$% "'$% (#$% #'$% )#$% *'$% +#$% &&'$% &"#$% &,'$% &##$% &-'$% &*#$% "''$% "&#$% "('$% ",#$% &''% "''% (''% ,''% #''% )''% -''% *''% +''% &'''% &&''% &"''% &(''% &,''% &#''% &)''%
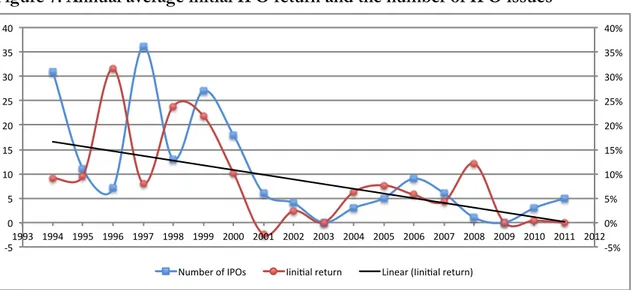
Dot-com bubble, 1996-2000. After the Dot-com bubble (2001-2003) and the Global Fi-nancial Crisis (2009-2011), initial returns and number of IPO issues was well below aver-age6. Ritter and Welch (2002) and Loughran and Ritter (2004) found similar patterns in
USA. Thus, when the market is booming, IPO issues and underpricing are likely to in-crease, providing investors with higher initial returns. During a period of crisis on the other hand, IPO issues and initial returns are likely to fall below normal levels.
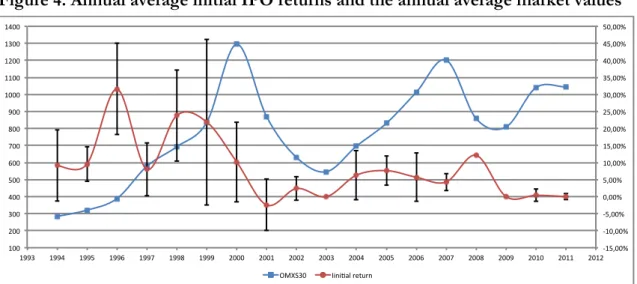
Figure 4. Annual average initial IPO returns and the annual average market values
Average annual initial returns are measured on the right vertical axis and the average annual OMXS30 value is measured on the left vertical axis. The bars extending from the average annual initial returns indicate the standard deviation of initial returns for each given year.
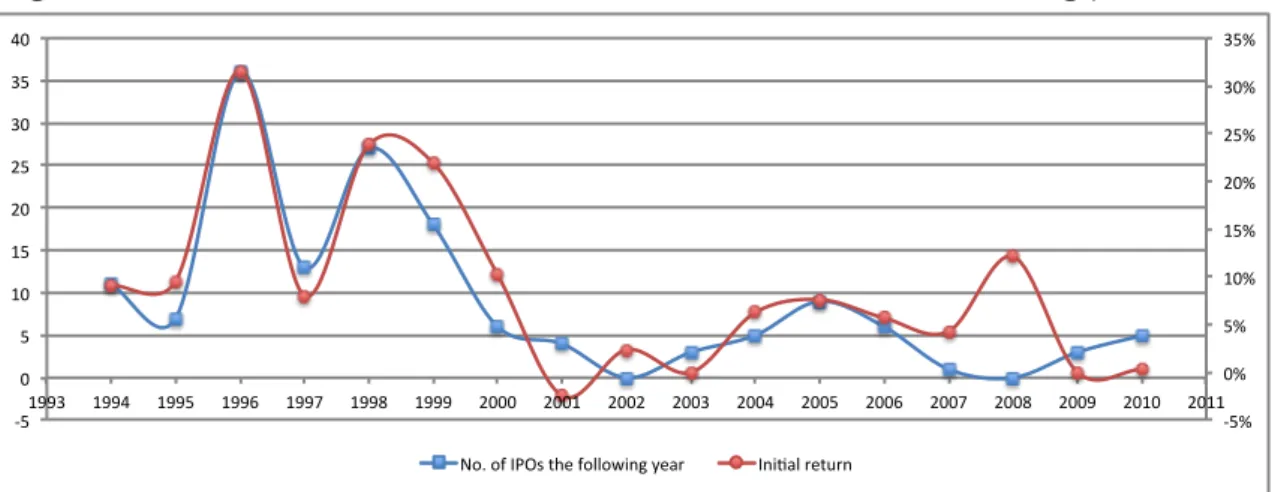
Researchers within the subject have long observed and focused research on those cyclical trends in the IPO market. Especially the phenomenon of hot-issue markets i.e. firms tends go public when other firms receive high stock market valuations e.g. Jenkinson and Ljungqvist (2001), Loughran and Ritter (2002) and Allen and Faulhaber (1989). Applied to this data set the relationship cannot be confirmed at first glance. In fact, the linear depend-ence between the stock market value and the number of IPO issues is -0.25, meaning that there is a negative relationship between the stock market value and the number of IPO is-sues, the opposite relationship of other studies. However, looking at figure 5 one can see that the two variables clearly move together, at least post year 2000. A Granger causality test proves the relationship and that OMXS30 returns affect the number of IPO issues. The strong linear dependence of 0.72 between IPO issues and the stock market further confirms the relationship. The result is also inline with the findings of previous studies.
6 The initial return was even negative in 2001 and in 2003 and 2009 there were no IPO issues at all.
!"#$%%&' !"%$%%&' !#$%%&' %$%%&' #$%%&' "%$%%&' "#$%%&' (%$%%&' (#$%%&' )%$%%&' )#$%%&' *%$%%&' *#$%%&' #%$%%&' "%%' (%%' )%%' *%%' #%%' +%%' ,%%' -%%' .%%' "%%%' ""%%' "(%%' ")%%' "*%%' "..)' "..*' "..#' "..+' "..,' "..-' "...' (%%%' (%%"' (%%(' (%%)' (%%*' (%%#' (%%+' (%%,' (%%-' (%%.' (%"%' (%""' (%"(' /012)%' 3454678'9:;<95'