2019; 5(2): 101-113
Published by the Scandinavian Society for Person-Oriented Research Freely available at https://www.person-research.org
https://doi.org/10.17505/jpor.2019.09
101
Affect Dynamics as Predictors
of Symptom Severity and Treatment Response
in Mood and Anxiety Disorders:
Evidence for Specificity
Hannah G. Bosley, Peter D. Soyster, and Aaron J. Fisher
University of California, Berkeley
Corresponding author: Hannah G. Bosley, Fisher Laboratory Psychology Department, 2121 Berkeley Way,Berkeley, CA 94704
Email: bosley@berkeley.edu
To cite this article:
Bosley, H. G., Soyster, P. D., & Fisher. A. J. (2019). Affect dynamics as predictors of symptom severity and treatment response in mood and anxiety disorders: Evidence for specificity. Journal for Person-Oriented Research, 5(2), 101-113. https://doi.org/10.17505/jpor.2019.09
Abstract: Studies of affect dynamics in psychopathology often focus on the prediction of broad constructs like subjective well-being and psychological health. Less is known about how fluctuation in affect over time relates to specific symptom measures (e.g., anxiety or depression), or how these domains change in treatment. A clinical sample of 32 adults with mood and anxiety disorders (13 generalized anxiety, 5 major depression, 14 comorbid) completed four daily assessments of positive (PA) and negative affect (NA) for 30 days prior to receiving cognitive behavioral treatment. Anxiety and depression symptom severity were assessed pre- and post-treatment. We calculated three metrics of affect dynamics for each person’s PA and NA time series: (1) variability (experiencing emotional extremes, the standard deviation of a person’s PA or NA vector); (2) instability (magnitude of point-to-point change in emotion, the vector’s mean squared successive difference); and (3) inertia (the extent to which emotions self-perpetuate over time, the lag-1 autocorrelation of the vector). Multiple regression models were run to test dynamics of positive and negative affect as between-subjects predictors of symptom severity and pre-to-posttreatment change in symptoms. Findings suggest NA dynamics are unrelated to depression symptom severity or treatment response, but we observed a specific effect of NA instability (MSSD) on both severity and response of anxiety symptoms. All PA dynamics were unrelated to anxiety or depression symptom severity. However, variability, instability, and inertia of PA were all found to relate to treatment response for both anxiety and depression symptoms. Taken together, our results suggest that affect dynamics have some specificity in their relationship to clinically relevant phenomena such as symptom severity and treatment outcomes at the between-subjects level of analysis.
Introduction
Most forms of mental illness are related to problematic emotional patterns—difficulties with the frequency, inten-sity, expression, and regulation of emotions like fear, anger, and sadness. Because these patterns play out over time, during people’s everyday lives, researchers have increas-ingly begun to collect intensive repeated measures data via ecological momentary assessment (EMA; Hamaker & Wichers, 2017). Within standard EMA paradigms, indivi- duals are prompted by a smartphone or wearable device to provide self-report ratings of emotions many times over the course of several days or weeks, yielding person-specific
time-series data that allows for modeling of the time- varying dynamics in emotion as they occur in daily life (see Carpenter, Wycoff, & Trull 2016; Moskowitz et al., 2009; Shiffman, Stone, & Hufford 2008; Trull & Ebner-Priemer, 2013 for reviews). Such models hold a great deal of poten-tial for improving clinical care by providing a nuanced, person-specific understanding of complex idiosyncratic patterns in a client’s emotions (Trull & Ebner-Priemer, 2009). Nevertheless, there is a need to be thoughtful about the ways in which EMA time-series data are leveraged for this purpose.
The multivariate time series generated by EMA methods provide a rich source of information related to individual
102 phenomenology as a function of time, allowing researchers to not only investigate individual differences in level (e.g., severity or intensity), but also the temporal dynamics among variables—the differential patterns of variation and covariation that unfold from moment to moment. Still, a challenge remains to identify and extract useful units of information from a time series that can be used to inform the prediction of clinically-relevant phenomena, and sever-al methodologies have been applied to this task to date (Epskamp et al., 2018; Fisher et al., 2019; Fisher, 2015; Fisher & Soyster, 2019; Heron & Smyth, 2010, Schiepek et al, 2016; Roche et al., 2014). With observations across many participants, variables, and time-points, EMA time-series data provide fertile ground for both idiographic and nomothetic analyses (Hamaker & Wichers, 2017). Re-searchers can examine between-persons distributions of within-person temporal patterns with a degree of granulari-ty and precision that is not available from cross-sectional measurements. Thus, even at the between-subject level, EMA provides detail beyond basic differences in severity or intensity. However, with increased granularity and oper-ational precision comes the responsibility for researchers to demonstrate that these levels of analysis provide predictive information above and beyond mean levels. Can intra- individual measures of fluctuation and variation provide incremental information about etiology, symptom severity, or treatment outcome (Wright & Zimmerman, 2019)? As the field continues to explore person-level temporal dy-namics, there is a need to determine which of these metrics provide incremental predictive validity for understanding clinical phenomena between subjects.
The extant affect dynamics literature has provided a set of metrics that quantify intraindividual patterns of fluctua-tion in constructs like positive affect (PA) and negative affect (NA) in terms of their volatility, predictability, and constancy (Kuppens & Verduyn, 2017). As we’ve noted, these metrics are derived from the analysis of within-person time-varying processes; however, their aggregation across participants creates nomothetic distributions of idiographic temporal patterns, revealing rank-order differences in tem-poral dynamics between individuals or groups. Three of the most common affect dynamics in the literature include var-iability, defined as the within-person standard deviation (SD) of the PA or NA observations; instability, the mean squared successive difference (MSSD) of PA or NA; and inertia, which is defined as the lag-1 autoregression (AR) of the PA or NA vector.
Variability represents whether a person endorsed ex-tremes of positive or negative emotion, regardless of when extreme ratings occurred. Instability is intended to capture the magnitude of point-to-point shifts in PA or NA; high instability means that a person tended to experience large shifts in PA or NA from one moment to the next. Thus, this metric reflects variability as a function of temporal order. Finally, inertia captures the extent to which emotions self-perpetuate or predict themselves over time. Crucially,
the SD, MSSD, and AR are correlated processes. It has been demonstrated in simulated time-series data that for constant levels of variability, instability/MSSD and inertia/ AR are inversely related (Jahng, Wood, & Trull, 2008).
Affect Dynamics and Psychopathology
Mounting empirical evidence supports the notion that affect dynamics are associated with well-being and psycho- logical health, broadly speaking (Kuppens & Verduyn, 2017; Trull, Lane, Koval, & Ebner-Priemer, 2015; Wichers, Wigman, & Myin-Germeys, 2015). A question remains regarding which specific types of affect dynamics are most relevant to psychopathology—and which (if any) metrics can outperform PA and NA mean levels in the prediction of negative psychological outcomes (Dejonckheere et al., 2019).
Affective instability (MSSD) and inertia (that is, lag-1 autoregression) are inversely related (Jahng, Wood, & Trull, 2008), so we might expect these metrics to have opposite effects on well-being. However, there is a paradox in the literature wherein high instability and high inertia are both associated with lower self-reported well-being and greater psychopathology (Houben, Van Den Noortgate, & Kuppens, 2015). Commonly, depression is the specific form of psychopathology under examination (cf. Koval, Pe, Meers, & Kuppens, 2013). One interpretation of this instability- inertia paradox might be that optimal emotion fluctuation lies in the middle of a hypothetical continuum from emo-tional “flexibility” to emoemo-tional “rigidity”. Perhaps in- stability and inertia occupy the two poles, respectively, of that continuum. That is, extreme instability may indicate maladaptive levels of emotional flexibility, changing too much in response to the environment, while extreme inertia may suggest emotional rigidity or not changing enough.
Koval, Pe, Meers, & Kuppens (2013) offer another ex-planation, arguing that the instability/inertia paradox results from statistical overlap in these constructs. In a depressed sample, they found that depressive symptoms were associ-ated with greater inertia and variability of NA, but not in-stability. Bos, deJonge, & Cox (2018) replicated these findings; showing in a depressed sample that the associa-tion between depression and instability is accounted for by the SD, and the association between depression and SD is accounted for by mean level. A recent paper provides com-pelling evidence that perhaps affect dynamics only predict individual differences in well-being due to their association with mean levels of NA and PA. Dejonckheere and col-leagues (2019) compared a range of metrics of affect dy-namics including variability, instability, and inertia, finding across 15 studies (N = 1,777) that none of these dynamics added incremental value to the between-subjects prediction of well-being above and beyond mean level. These findings seem to indicate that instability may not be relevant to the prediction of psychological health.
103 to be addressed. While affect dynamics have been studied in clinical samples for many years, studies modally focus on the relationship between affect dynamics and depression symptoms (Trull, Lane, Koval, & Ebner-Priemer, 2015) or subjective well-being (Houben, Van Den Noortgate, & Kuppens, 2015). More remains to be known about how affect dynamics relate to specific symptom measures and psychopathology more broadly. For example, much less is known about affect dynamics’ relationship to anxiety dis-orders, despite the fact that anxiety disorders are more prevalent than depression (Kessler et al., 2005). Further, in the current literature, studies of NA dynamics and psycho-pathology are more common than studies that include PA dynamics. Some have found that PA dynamics are less rel-evant to depression symptoms: for instance, Thompson et al (2012) demonstrated that individuals with depression ex-hibited no significant differences from healthy controls in terms of their variability, instability, or inertia of PA. Koval, Sutterlin, & Kuppens (2015) showed that PA inertia is less relevant to depression than NA inertia. However, more re-mains to be known about how PA dynamics relate to other forms of psychopathology.
Affect Dynamics and Treatment Outcome
The experience of psychopathology can be conceptua- lized as a complex dynamical system: that is, a system with multiple stable states whose underlying conditions are in-fluenced by many factors (Wichers, Wigman, & Myin- Germeys, 2015). In these systems, it may be difficult to identify exact mechanisms responsible for state transitions (for example, into or out of a depressive episode); but these transitions are often preceded by generic “warning signs” like rising autocorrelation and variance of a signal (Wichers, Wigman, & Myin-Germeys, 2015). Affect dynamics may therefore be a useful warning signal of imminent state tran-sitions concerning psychopathology. A “state transition” is a major goal of psychotherapy—that is, to establish new, more adaptive patterns among emotions and behaviors. Thus, it may be useful to gain a more nuanced understand-ing of affect dynamics as predictors of change in treatment.
There are mixed findings concerning the relationship between specific affect dynamics and treatment response, and many gaps remain in the literature. Peeters et al (2010) demonstrated that depressed patients who exhibited less emotional reactivity to negative daily events were less likely to recover from MDD. Peeters and colleagues found that greater instability of NA was a positive sign for treat-ment outcome—those with higher instability exhibited greater reductions in symptoms following treatment. How-ever, Husen et al (2016) demonstrated that greater instabil-ity of NA was linked to poorer response to CBT in a sample with mixed mood and anxiety disorder diagnoses. Of note, there were different patterns of comorbidity in these samples, indicating that affect dynamics may differentially relate to treatment outcome across forms of psycho-
pathology (for instance, perhaps instability of NA is posi-tively related to change in depression, but not in other forms of psychopathology).
With respect to PA dynamics, there is clear evidence—at least in depressed samples—that patterns of fluctuation in PA are related to treatment outcome. Wichers et al (2012) demonstrated that moments of increase in PA during an EMA time series are predictive of favorable response to treatment for depression. These authors found that mo-ments of PA increases are actually more predictive of symptom remission for depressed individuals than mo-ments of reduction in NA. This might suggest that varia- bility or instability of PA, more than that of NA, is a posi-tive indicator for treatment response. Relatedly, there is evidence that greater inertia of PA is associated with better current and future recovery from depression (Heller et al., 2009; Hohn et al., 2013). This remains to be extended to other forms of psychopathology beyond depression.
The Present Study
The present study aims to build upon and extend the prior literature by investigating NA and PA dynamics as predictors of 1) anxiety and depression symptom severity and 2) pre-to-post-treatment change in these symptoms in a clinical sample of adults with mood and anxiety diagnoses. We ran a series of hierarchical multiple regression models for each valence (PA and NA) and each symptom domain (anxiety and depression) beginning with instability of affect as the independent variable, and iteratively adding mean level, and the other affect dynamics (variability + inertia). Thus, we examined whether or not affect dynamics “beat the mean” (following Dejonckheere et al., 2019) in the pre-diction of symptom severity and treatment outcome.
While these analyses were largely exploratory in nature, several predictions followed from the literature. We pre-dicted that instability would be associated with symptom severity and treatment outcome when modeled alone; however, consistent with Dejonckheere et al., 2019, we also hypothesized that mean levels of affect would be signifi-cantly associated with symptom severity, mitigating the effects of other dynamics.
Methods
Participants
This study utilized data from an open trial of a personal-ized modular intervention for depression and anxiety, the procedural details and outcomes of which have been re-cently published elsewhere (Fisher et al., 2019). Briefly, in this study participants with GAD and MDD completed four daily self-report assessments of affect, behavior, and symptoms during a 30-day period prior to receiving cogni-tive-behavioral treatment. They subsequently received interventions tailored to their symptom profiles as assessed during the EMA period.
104 Individuals experiencing symptoms consistent with pos-sible GAD and MDD were recruited from the greater San Francisco Bay Area via flyers, referrals, and internet adver-tisements. After passing a brief telephone screening, 174 potential participants were invited to an in-person appoint-ment where they completed a structured clinical interview to verify diagnosis and assess severity of symptoms. Inclu-sion criteria were a primary diagnosis of GAD or MDD, age between 18 and 65 years, and a web-enabled mobile phone. Exclusion criteria were any history of psychosis or mania, concurrent treatment or cognitive–behavioral treat-ment within the past 12 months, and as-needed medication. We calculated interrater reliability for diagnosis based on video recordings of the structured clinical interviews. The inclusion criteria, GAD and MDD, returned kappa values of 0.68 and 0.84, and percent agreement of 95% and 92%, respectively, with two mismatches for GAD and three mismatches for MDD.
In total, 57 individuals (33%) met inclusion criteria for the current study. Of these, 40 began treatment. Seven par-ticipants withdrew from the study during treatment, and one participant was unable to complete a post-treatment assessment, leaving 32 participants in the present sample who completed a full course of treatment and post- treatment assessment. Of the 32 individuals included in the present study, 20 (62.5%) identified as female, and the av-erage age was 37.9 years (SD = 14.3). Sixteen participants (50%) identified as white, nine identified as Asian (28.1%), four (12.5%) identified as Latino/a, one identified as Black (3.1%), and two selected “other” (6.3%). In terms of diag-nosis, 13 individuals were diagnosed with current primary GAD, 5 were diagnosed with current primary MDD, and 14 met criteria for co-primary diagnoses of both GAD and MDD. 16 of these participants met for at least one current comorbid disorder other than GAD or MDD; other comor-bid diagnoses included agoraphobia (n = 2; 6.25%), persis-tent depressive disorder (n = 3; 9.38%), posttraumatic stress disorder (n = 1; 3.13%), social anxiety disorder (n = 10; 31.25), and specific phobia (n = 4; 12.5%).
Measures
Anxiety Disorders Interview Schedule for DSM-V.
(ADIS-V; Brown & Barlow, 2014). The ADIS-5 is a semi- structured clinical interview that is designed to diagnose current anxiety, mood, and related disorders according to new DSM-5 criteria. This version of the ADIS-5 builds upon previous versions (the ADIS, ADIS-R, and ADIS-IV for DSM-III, DSM-III-R, and DSM-IV, respectively), which had well-established reliability. The ADIS-IV demonstrates good-to-excellent interrater reliability for DSM- IV disorders (kappa ranging from 0.67 to 0.86, with the exception of dysthymia, kappa = .31).
Depression Anxiety and Stress Scales. (DASS;
Lov-ibond & LovLov-ibond, 1995). The DASS is a 42-item self- report measure that captures three related dimensions of
symptom severity: depression, anxiety, and stress. In line with the tripartite model (Clark & Watson, 1991) these subscales were created to measure symptoms unique to anxiety and depression. The depression subscale captures anhedonia or low PA unique to depression, the anxiety subscale captures hyper-arousal unique to anxiety, and the stress subscale assesses high NA symptoms shared across both categories. Therefore, to capture the full range of self-reported depression and anxiety syndromes, the present study utilized the depression + stress subscales to measure self-reported depression severity, and the anxiety + stress subscales to measure self-reported anxiety symptom sever-ity. As each of the three subscales consists of 14 items, our depression and anxiety composites (each of which included its respective subscale + the stress subscale) were each in-dicated by 28 items. Items were rated on a 4-point Likert scale ranging from 0-3 with the anchors “did not apply to me at all”, “applied to me to some degree or some of the time”, “applied to me to a considerable degree or a good part of the time”, and “applied to me very much or most of the time”. Total scores for each subscale of the DASS were calculated by summing across the 14 items that made up each subscale. The stress subscale was added to both the depression and anxiety subscales to generate two 28-item measures of depression and anxiety, respectively. Scores on each of these two measures could range from 0 to 84. In the present sample, the average DASS anxiety score was 34.41 (SD = 14.37) and the average DASS depression score was 44.34 (SD = 13.29).
Daily Affect via EMA. During each of the four daily
EMA survey pings, participants rated their experience of survey items over the preceding hours using a 0–100 visual analog slider with the anchors “not at all” and “as much as possible” for the 0 and 100 positions, respectively. Surveys contained the symptoms in the DSM-5 criteria for GAD and MDD (down and depressed, hopeless, loss of interest or pleasure, worthless or guilty, worried, restless, irritable, difficulty concentrating, muscle tension, fatigued), as well as an additional 11 items measuring positive affect (positive, energetic, enthusiastic, and content), negative affect (angry and afraid), rumination (dwelled on the past), behavioral avoidance (avoided people, avoided activities, and procras-tinated), and reassurance seeking (sought reassurance). In the present study, the four PA items (positive, energetic, enthusiastic, content) and seven NA items (angry, irritable, worthless/guilty, frightened/afraid, down/depressed, wor-ried, hopeless) were averaged at each observation to create a composite PA and composite NA variable at each obser-vation. Of note, worthless/guilty, frightened/afraid, and down/depressed were measured as couplets in a single item (e.g., “felt worthless or guilty”) to reflect the language used in clinical assessment for anxiety and depression. These composite affect measures were used to generate affect dynamics variables in the present study. In the present sample, within-person reliability for PA ranged from α = 0.50 to α = 0.92 (M = 0.81, SD = 0.09); within-person
reli-105 ability for NA ranged from α = 0.45 to α = 0.93 (M = 0.79, SD = 0.12).
Procedure
Clinical Interview. Interested individuals contacted the
Idiographic Dynamics Laboratory at the University of California, Berkeley, and trained research assistants admin-istered a brief telephone screening interview to assess eli-gibility for the study. Those who were eligible after the initial screening were invited to an in-person appointment for a structured clinical interview. The ADIS-5 was admin-istered by graduate students in clinical psychology super-vised by a doctoral level clinical psychologist. At this ap-pointment, participants also completed a battery of self- report symptom measures including the DASS.
EMA Surveys. After enrolling in the study, participants'
mobile phone numbers were entered into a secure web- based survey system which prompted participants to answer survey questions four times per day during waking hours. The precise sampling window was tailored to parti- cipants’ self-reported wake up times, and during this win-dow, they received surveys approximately every 4 hours. The exact time of the ping was randomized within a 30-min window. Participants had a time limit of approximately four hours to respond to each survey; each survey expired once the subsequent survey was sent. Each survey prompt was sent to participants as a text message containing a hyperlink to a web-based survey. Every time pings were sent to parti- cipants, the back-end of the system recorded a time stamp, whether the participant completed the survey or not. Par-ticipants were instructed to complete surveys for a mini-mum of 30 days (the total number of days ranged from 29 to 42; M = 34.25).
Personalized Treatment. Following the 30-day EMA
period, participants received a course of modular cognitive- behavioral treatment for mood and anxiety disorders. Treatment was personalized via selection of relevant modules from the Unified Protocol (Barlow et al., 2017) to address the most relevant symptoms and mechanisms for each participant (Fisher et al., 2019; Fisher & Boswell, 2016; Fernandez, Fisher, & Chi, 2016). The average num-ber of sessions delivered in the study was 10.38, ranging from 4 to 14 (mode = 9). Within days of completing treat-ment, participants completed an in-person follow-up assessment appointment to assess change in diagnosis and symptom experience. At this appointment, trained graduate students again administered a diagnostic structured clinical interview and participants completed various self-report instruments including the DASS.
Data Preparation and Analysis. Data were processed
and analyzed using R (version 3.5.3; R Core Team, 2019). Complete R syntax as outlined in this paper is available in the supplementary material on OSF [https://osf.io/34xyh/]. First, composite PA and composite NA were calculated for each observation of each participant’s time series by taking
the average of PA and NA items respectively at each ob-servation. PA items included energetic, enthusiastic, content, positive (for PA) and angry, irritable, worthless/guilty, frightened/afraid, down/depressed, worried, hopeless (for NA). To account for any mean level shifts over time, linear trends were removed from the PA and NA composite measures by regressing each measure on time and extract-ing the residuals. Next, each participant’s positive and negative affect dynamics (variability, instability, and inertia) and mean levels were calculated from their de-trended EMA time series, using the PA and NA composite vectors. Missing observations (e.g., those for which the participant failed to respond during the correct four-hour time window) were excluded as a function of listwise deletion; however, their timestamp was retained in order to maintain approxi-mately even spacing.
Variability was calculated as the standard deviation of the PA and NA vectors for each person. Importantly, varia-bility is a measure without temporal dependence. High variability indicates that a participant used a wider range of points on the scale to rate their emotions, regardless of when in the time series any extreme or outlying ratings occurred.
Night-to-morning lags were removed before calculating inertia and instability, as these measures rely on temporal dependence. Inertia was defined as the lag-1 autocorrela-tion of the PA/NA composite variables. In this sense, inertia indicates the extent to which emotions self-perpetuate over time, as a measure of the extent to which variance in PA/NA as observed at time T can be predicted from the same variable at the previous observation (T-1). To calcu-late inertia, we used the AutoR function in the psych pack-age in R. Given that the presence of a time-dependent trend can inflate estimates of the strength of the autoregression (Jahng, 2008), PA and NA variables were first de-trended by regressing these variables on cumulative time. The lag-1 autoregression was run on the residuals—that is, PA and NA with the linear time-dependent trend removed. To cal-culate instability, we used the mean squared successive difference (MSSD) as calculated via the psych package in R (Revelle, 2017). Instability indicates the average magni-tude of moment-to-moment shifts in intensity of PA or NA within a person’s EMA time series.
Affect Dynamics and Symptom Severity. To assess
re-lationships between symptom severity at baseline and each measure of affect dynamics, multiple regression models with anxiety and depression symptom severity regressed on emotion dynamics were estimated in an iterative fashion, adding predictors one at a time to an increasingly complex model. Separate models were constructed for each affective valence (PA and NA) and for each symptom domain (anxi-ety and depression) yielding a total of four hierarchical models. We began with instability (MSSD) of affect as the only predictor of each symptom domain, and iteratively added mean levels, variability, and inertia.
106 examined effects of affect dynamics on treatment outcome by using a similar iterative modeling approach as described above. These models were constructed in a similar fashion, except that treatment outcome rather than symptom severi-ty was modeled as the dependent variable, with baseline symptom severity included as a covariate in each stage. As with the symptom severity models, we constructed four total models of treatment outcome, for each affective va-lence (PA and NA) and symptom domain (anxiety and de-pression). With the same rationale as described above, in-stability was tested first, and then mean levels, inin-stability, and inertia.
Treatment outcome was defined as the change scores (post-treatment scores minus pre-treatment scores) for each of the two symptom domains (anxiety and depression). Change scores were chosen as the outcome metric of inter-est to allow us to assess whether affect dynamics pre- treatment have an effect on one’s general malleability to change during treatment, and baseline severity for each domain was modeled as a covariate to account for where on the scale that change occurs. In these treatment response
models, the direction of effect is negatively valenced, such that negative numbers of a larger magnitude indicate great-er change in symptoms during treatment. Thgreat-erefore, if an affect dynamic variable is negatively associated with treat-ment outcome this reflects that higher levels of the emotion dynamic variable are associated with more pronounced change in treatment.
Results
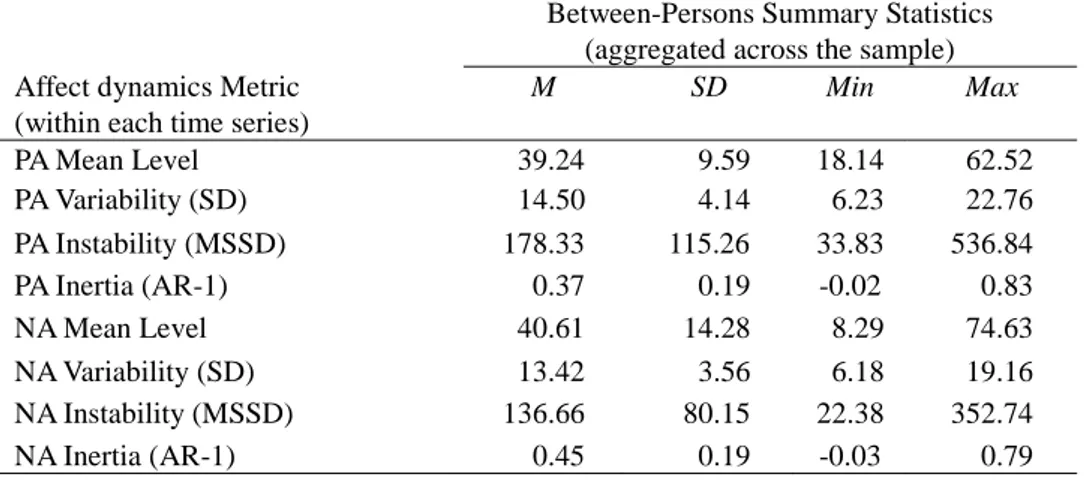
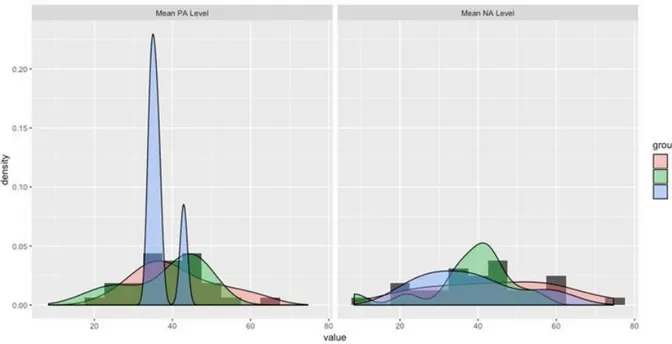
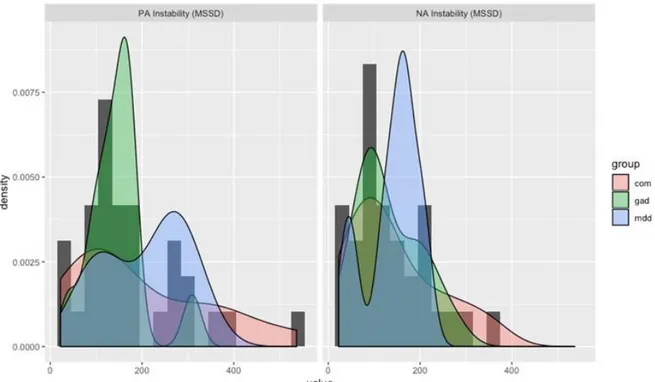
For the sample of 32 treatment completers, the total number of observations ranged from 110 to 158 (M = 129.75, SD = 12.05). The percentage of missing data ranged from 0% to 31.8% (M = 12.39%, SD = 0.08%). Group-aggregated descriptive statistics (means, SDs, and ranges) for all affect dynamics variables are presented in Table 1 and visualized as distributions in Figures 1a and 1b. Descriptive statistics by diagnostic group for all outcome measures (baseline and change scores for the DASS anxiety and depression measures) are provided in Table 2.
Table 1. Descriptive statistics for affect dynamics.
Between-Persons Summary Statistics (aggregated across the sample) Affect dynamics Metric
(within each time series)
M SD Min Max PA Mean Level 39.24 9.59 18.14 62.52 PA Variability (SD) 14.50 4.14 6.23 22.76 PA Instability (MSSD) 178.33 115.26 33.83 536.84 PA Inertia (AR-1) 0.37 0.19 -0.02 0.83 NA Mean Level 40.61 14.28 8.29 74.63 NA Variability (SD) 13.42 3.56 6.18 19.16 NA Instability (MSSD) 136.66 80.15 22.38 352.74 NA Inertia (AR-1) 0.45 0.19 -0.03 0.79
Table 2. Correlations among affect dynamics variables
1 2 3 4 5 6 7 8 1: PA Mean Level 1 2: PA Variability 0.19 1 3: PA Instability 0.28 0.81*** 1 4: PA Inertia -0.03 0.21 -0.22 1 5: NA Mean Level -0.27 -0.25 -0.28 -0.16 1 6: NA Variability 0.01 0.69*** 0.53** 0.24 0.00 1 7: NA Instability 0.00 0.56*** 0.58*** -0.15 0.05 0.79*** 1 8: NA Inertia 0.05 0.12 -0.15 0.71*** 0.04 0.31 -0.24 1 Note. * p < .05; ** p < .01; *** p <.001
107 Panel A: Mean Levels.
Panel B: Variability (SD)
108 Panel C: Instability (MSSD)
Panel D: Inertia (AR-1)
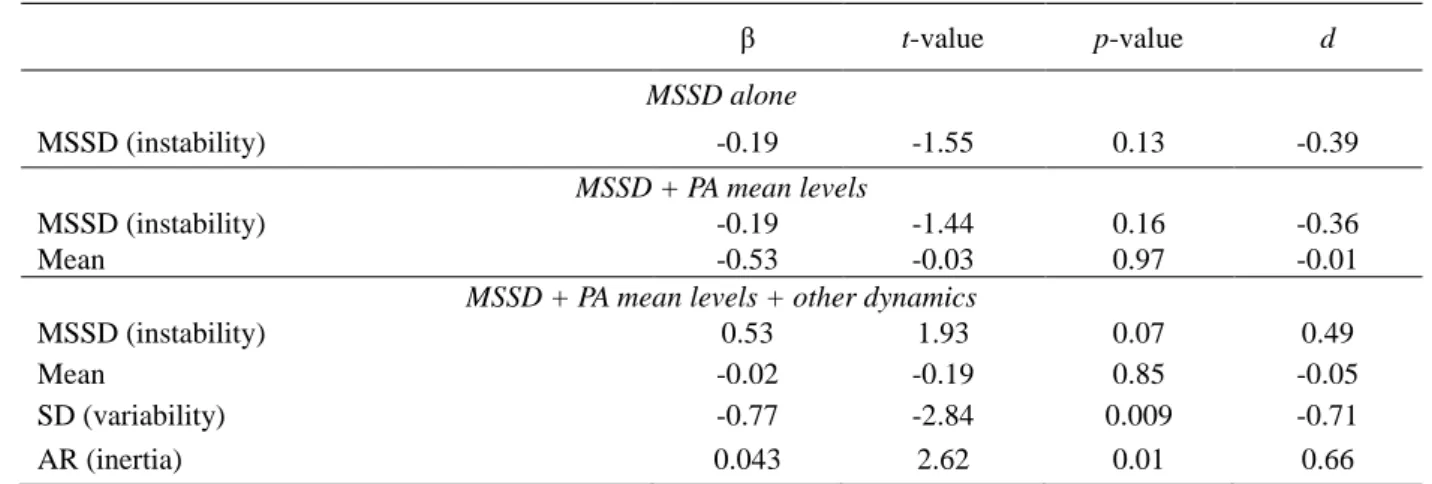
109 Table 3. PA Dynamics and Depression Treatment Response
Note. PA = positive affect; MSSD = mean squared successive difference; d = Cohen’s d
Table 4. PA Dynamics and Anxiety Treatment Response
Note: PA = positive affect; MSSD = mean squared successive difference; d = Cohen’s d
Affect Dynamics and Symptom Severity
Greater mean levels of NA were associated with more severe depression symptoms (β = 0.46, p = 0.01); no other affect dynamics beyond mean level were found to relate to depression symptom severity. However, for anxiety symp-toms, greater instability of NA was significantly associated with worse symptoms (β = 0.49, p = 0.002), even when controlling for mean levels of NA (β = 0.34, p = 0.03). In the final model, when variability and inertia were added, the effect of instability fell below the threshold of statistical significance (p = 0.10). No significant associations were found between any PA dynamics (including mean levels) and anxiety symptom severity.
Affect Dynamics and Treatment Response
NA and PA dynamics were tested as predictors of pre-to-
posttreatment change in depression and anxiety symptom scores, controlling for baseline symptom levels. Of note, in these models we utilize change scores as the dependent variable (posttreatment – pretreatment); therefore, as nega-tive scores of a greater magnitude reflect more change in treatment, negative beta coefficients indicate a direct (ra-ther than an inverse) relationship between the independent variable and treatment response. Baseline symptom severi-ty was significantly associated with treatment response across all models, such that individuals with greater severi-ty of symptoms demonstrated more pronounced change after treatment. The number of sessions varied between participants, but when this was added as a covariate it did not impact the observed effects.
We found no metric of NA dynamics to be significantly associated with change in depression symptoms. However, instability/MSSD of NA was significantly associated with
β t-value p-value d MSSD alone MSSD (instability) -0.19 -1.55 0.13 -0.39 MSSD + PA mean levels MSSD (instability) -0.19 -1.44 0.16 -0.36 Mean -0.53 -0.03 0.97 -0.01
MSSD + PA mean levels + other dynamics
MSSD (instability) 0.53 1.93 0.07 0.49 Mean -0.02 -0.19 0.85 -0.05 SD (variability) -0.77 -2.84 0.009 -0.71 AR (inertia) 0.043 2.62 0.01 0.66 β t-value p-value d MSSD alone MSSD (instability) -0.25 -2.27 0.03 -0.57 MSSD + PA mean levels MSSD (instability) -0.21 -1.81 0.08 -0.46 Mean -0.15 -1.27 0.21 -0.32
MSSD + PA mean levels + other dynamics
MSSD (instability) 0.52 2.36 0.03 0.59
Mean -0.18 -1.74 0.09 -0.44
SD (variability) -0.81 -3.67 0.001 -0.92
110 change in anxiety symptoms (β =- 0.32, p = 0.02); indicat-ing that greater instability of NA prior to treatment pre-dicted more pronounced change in anxiety symptoms dur-ing treatment. However, when variability and inertia were added in the final iteration of this model, the effect of in-stability fell below the threshold of statistical significance. No other metric of NA dynamics, including mean levels, significantly predicted change in anxiety symptoms.
Most of the significant relationships observed in the present analyses were PA dynamics predicting treatment response (see Tables 3 and 4). Variability, instability, and inertia of PA pre-treatment were all significantly associated with change in anxiety symptoms (βs = - 0.80, 0.52, and 0.34 respectively; all ps <0.05). Similarly, we found that PA variability and inertia were significantly associated with change in depression (βs = - 0.77 and 0.43 respectively; ps <0.05). This indicates that individuals with greater varia- bility in PA pre-treatment had more pronounced change in their depression and anxiety symptoms during treatment. The opposite was true for inertia (greater inertia of PA was associated with less change in depression and anxiety symptoms). We found no significant effects of mean levels of PA in these models.
Discussion
The present study examined dynamics of NA and PA as predictors of anxiety and depression symptom severity, as well as pre-to-posttreatment change in symptoms, in a co-hort of individuals diagnosed with mood and anxiety dis-orders who subsequently received CBT. For each valence and symptom domain, we ran a set of multiple regression models beginning with instability of affect as the only pre-dictor, iteratively adding mean levels of affect, variability and inertia. We found that greater instability (MSSD) of NA was associated with greater anxiety symptoms, and more pronounced change in anxiety from pre-to-post treatment, even when controlling for mean levels of NA. Conversely, NA dynamics were not shown to be related to depression symptom severity or treatment response. While PA dynam-ics were not related to depression or anxiety symptom se-verity at baseline, we found that all three PA dynamics (variability, instability, inertia) were significantly associated with pre-to-posttreatment change in anxiety and depression symptoms.
Taken together, our findings point to specificity in the relationships between affect dynamics and symptom do-mains. It may not be accurate to say that affect dynamics are related to well-being and psychological health generally. Dejonckheere et al. (2019) illustrated this by demonstrating that affect dynamics did not add meaningful incremental value predictive value for psychological health, above and beyond mean levels. Crucially, their study defined psycho-logical health as a composite including subjective well- being, depression symptoms, and borderline personality symptoms. In the present study, we took a narrower
ap-proach to defining psychological health, examining the relation between affect dynamics and specific symptom measures that assess depression and anxiety pathology separately. Consistent with Dejonckheere et al., we did not find a relationship between NA dynamics and depression symptom severity or treatment response. However, we did show that instability of NA exhibited a significant direct relationship with anxiety symptom severity and the extent to which anxiety symptoms change in treatment. Further, we found that PA dynamics are generally unrelated to base-line symptom severity, but that all three dynamics of PA were significantly associated with treatment response for both anxiety and depression. In short, while we cannot say that affect dynamics are linked to well-being broadly, there is evidence for more granular relationships: NA instability may be linked to severity and response of anxiety symp-toms, and PA dynamics may be linked to treatment out-come—but not baseline severity—of anxiety and depres-sion.
The finding that PA dynamics (variability, instability, and inertia) are related to treatment response for both anxiety and depression is consistent with prior findings. To wit, it has been shown that greater reactivity to positive events leads to better treatment outcomes for depression (Wichers et al., 2012) and that higher inertia of PA is also linked to better outcomes for depression (Heller, 2009; Hohn et al., 2013). However, it is surprising that the direction of effects in the present study is counter to what is predicted by the literature. As expected (given Wichers et al., 2012) we showed that greater variability of PA was associated with more pronounced treatment response. Contrary to expecta-tion, however, greater instability and inertia of PA were both associated with less pre-to-posttreatment change in anxiety and depression symptoms. This echoes the instability-inertia paradox in the literature concerning the prediction of well-being. Until future studies can examine this further, it might be prudent to interpret the finding for PA variability, as this is consistent with the literature: greater variability in PA is linked to better treatment out-comes for anxiety and depression. Clinicians may therefore want to cultivate awareness of and responses to PA such as encouraging mindfulness and savoring positive experiences (Feldman, Joorman, & Johnson, 2008) as a strategy in treatment.
Limitations
A handful of limitations in the present study must be noted. First, although we had a large number of observa-tions per-person yielding high within-person statistical power, our sample size of 32 treatment completers provided relatively low between-subject statistical power in the pre-sent study. It is therefore possible that we were unable to detect some effects that would be observable with a larger sample. For instance, in our symptom severity models, we did not consistently find significant associations between
111 mean levels of affect and symptom experiences. We might expect, given findings by studies such as Dejonckheere et al (2019), that such effects would emerge. The present study utilized specific symptom measures rather than more general measures of self-reported well-being, so it is possible that this lack of associations with mean levels is due to the fact that specific symptoms are less associated with mean levels of affect than with broader measures of “psychological health”, but it is also possible that this is a function of low statistical power. However, it is worth noting that the effects of PA dynamics on treatment response for both symptom domains were detected despite low power. Thus, perhaps these findings are particularly robust.
It should also be noted that in the present study, affect dynamics were measured pre-treatment, during a 30-day window between diagnosis and the beginning of CBT in-tervention. Therefore, conclusions about affect dynamics’ associations with change in treatment should be interpreted accordingly. PA dynamics before treatment begins may predict an individual’s response to treatment, and this information may be utilized clinically to generate hypothe-ses about a person’s likely responhypothe-ses to intervention based on their pre-treatment patterns. However, as participants did not continue completing EMA measurements during treatment, we are unable to answer questions about how affect dynamics changed during therapy as a function of intervention, or how these changes may have been associ-ated with change in symptoms. This merits further consid-eration in future work, especially in context of the sugges-tion that, considering psychopathology as a dynamical system (cf. Wichers, Wigman, & Myin-Germeys, 2015) affect dynamics may herald the onset of state-transitions within the system.
Future Directions
The present study raises many questions that should be explored in future work. First, the study’s primary findings—the effect of NA instability on anxiety symptom severity and treatment response, and the effect of all PA dynamics on treatment response for anxiety and depres-sion—should be investigated further in a larger sample with more between-subjects statistical power. It would be worth exploring whether specific diagnostic category or patterns of comorbidity influence these results. One conclusion that begins to emerge from the present findings is specificity in the relationship between affect dynamics and specific symptom domains. In most previous studies, affect dynam-ics have been explored as predictors of broad, general con-structs like “well-being” and “psychological health”, with many studies utilizing composite measures that comprise variables such as depression symptoms, borderline symp-toms, and subjective well-being. It may be worth consider-ing explorconsider-ing the relationship between affect dynamics and psychopathology with finer-grained detail in future studies.
For example, we showed that NA instability was specifi-cally connected to anxiety symptoms, but not depression symptoms. It may be worthwhile to unpack the NA con-struct into discrete emotions: perhaps we would then dis-cover more meaningful relations between emotion dynam-ics and specific forms of psychopathology. Examining links between affect dynamics and psychopathology with more granularity might reveal that dynamics of sadness or guilt relate specifically to depression, dynamics of excitement or enthusiasm relate to mania in bipolar disorder, or dynamics of anger or irritability relate to externalizing psycho- pathology.
While a handful of studies, including the present one, have examined affect dynamics as predictors of treatment response, such studies are less common in the literature. Our findings (and others) suggest that affect dynamics—in our case, specifically PA dynamics—may be relevant pre-dictors of how someone will respond to CBT intervention. If explored further this could offer potential clinical appli-cation in the realm of personalizing intervention: it may be the case that certain types of affect dynamics predict better versus worse response to different modalities of interven-tion. If this were the case, measuring affect dynamics during a brief pre-treatment window could be useful in tailoring intervention to be optimally effective for each individual. In addition, while the present study did not measure affect dynamics during treatment, future studies could take this approach. This might be a useful indicator of progress in treatment (for example, clinicians could benefit from knowing whether or not an intervention is changing affect dynamics over time).
Finally, while the present study examined affect dynam-ics as a between-persons predictor of symptoms and treat-ment response, it is possible that analyzing these relation-ships at the within-person level would yield very different conclusions. Future research should explore this further. For example, if symptoms were measured daily and affect were assessed multiple times daily, within-person associa-tions between symptoms on day t and variability, instability, and inertia of affect as captured within the day t window could be estimated. It would be useful for person-oriented clinical science to better understand the how affect dynam-ics contribute value to the between-person and within- person prediction of clinically relevant phenomena; and it would be interesting to compare the differences in these predictive relationships from the between-persons to the within-persons level. Empirical studies have repeatedly demonstrated that distributions of idiographic estimates are highly variable compared to nomothetic ones (Fisher, Jeronimus, & Medaglia, 2018), so a reasonable hypothesis is that affect dynamics exhibit idiosyncratic relationships with symptoms throughout the population. Future research must be done to determine what metrics are relevant pre-dictors of specific clinical phenomena at the within-person level.
112
Declaration of conflicting interests
The authors declare that there is no conflict of interest.
Author contributions
HB conducted the main analyses and served as the pri-mary author of the manuscript. PS and AF assisted with data management and analysis, conceptualization of study aims and preparation of the final manuscript.
Action editor
Evelien Snippe served as action editor for this article.
References
American Psychiatric Association (1994). Diagnostic and statistical manual of mental disorders (4th ed.). Washington, DC: American Psychiatric Association. Barlow, D. H., Farchione, T. J., Sauer-Zavala, S., Latin, H.
M., Ellard, K. K., Bullis, J. R., ... & Cassiello-Robbins, C. (2017). Unified protocol for transdiagnostic treatment of emotional disorders: Therapist guide. Oxford University Press.
Bradley, B., DeFife, J. A., Guarnaccia, C., Phifer, M. J., Fani, M. N., Ressler, K. J., & Westen, D. (2011). Emotion dysregulation and negative affect: association with psy-chiatric symptoms. The Journal of Clinical Psychiatry, 72(5), 685. https://doi.org/10.4088/JCP.10m06409blu. Bos, E.H., de Jonge, P., Cox, R.F.A., 2018. Affective
varia-bility in depression: Revisiting the inertia-instavaria-bility paradox. British Journal of Psychology, 110(4), 814-827. https://doi.org/10.1111/bjop.12372
Brown, T. A., & Barlow, D. H. (2014). Anxiety and Related Disorders Interview Schedule for DSM-5 (ADIS-5L). Lifetime Version. Client Interview Schedule. Oxford University Press.
Carpenter, R. W., Wycoff, A. M., & Trull, T. J. (2016). Ambulatory assessment: New adventures in characteriz-ing dynamic processes. Assessment, 23(4), 414-424. https://doi.org/10.1177/1073191116632341
Caldirola, D., Grassi, M., Riva, A., Daccò, S., De Berardis, D., Dal Santo, B., & Perna, G. (2014). Self-reported quality of life and clinician-rated functioning in mood and anxiety disorders: relationships and neuropsychological correlates. Comprehensive Psychiatry, 55(4), 979-988. https://doi.org/10.1016/j.comppsych.2013.12.007 Cowdry, R. W., Gardner, D. L., O'Leary, K. M., Leibenluft,
E., & Rubinow, D. R. (1991). Mood variability: a study of four groups. The American Journal of Psychiatry, 148(11), 1505-11.
https://doi.org/10.1176/ajp.148.11.1505
Dejonckheere, E., Mestdagh, M., Houben, M., Rutten, I., Sels, L., Kuppens, P., Tuerlincx, F., (2019). Complex af-fect dynamics add limited information to the prediction of psychological wellbeing. Nature Human Behavior, 3(5),
478-491. https://doi.org/10.1038/s41562-019-0555-0. Epskamp, S., van Borkulo, C. D., van der Veen, D. C.,
Servaas, M. N., Isvoranu, A. M., Riese, H., & Cramer, A. O. (2018). Personalized network modeling in psycho-pathology: The importance of contemporaneous and temporal connections. Clinical Psychological Science, 6(3), 416-427.
https://doi.org/10.1177/2167702617744325
Fernandez, K. C., Fisher, A. J., & Chi, C. (2017). Development and initial implementation of the Dynamic Assessment Treatment Algorithm (DATA). PloS One, 12(6), e0178806.
https://doi.org/10.1371/journal.pone.0178806
Fisher, A. J., Bosley, H. G., Fernandez, K. C., Reeves, J. W., Soyster, P. D., Diamond, A. E., & Barkin, J. (2019). Open trial of a personalized modular treatment for mood and anxiety. Behaviour Research and Therapy, 116, 69-79. https://doi.org/10.1016/j.brat.2019.01.010.
Fisher, A. J., & Soyster, P. (2019). Generating Accurate Personalized Predictions of Future Behavior: A Smoking Exemplar. Manuscript under review.
Fisher, A. J., & Boswell, J. F. (2016). Enhancing the personalization of psychotherapy with dynamic assess-ment and modeling. Assessassess-ment, 23(4), 496-506. https://doi.org/10.1177/1073191116638735.
Fisher, A. J., Medaglia, J. D., & Jeronimus, B. F. (2018). Lack of group-to-individual generalizability is a threat to human subjects research. Proceedings of the National Academy of Sciences, 115(27), E6106-E6115. https://doi.org/10.1073/pnas.1711978115
Fisher, A. J., & Newman, M. G. (2016). Reductions in the diurnal rigidity of anxiety predict treatment outcome in cognitive behavioral therapy for generalized anxiety dis-order. Behaviour Research and Therapy, 79, 46-55. https://doi.org/10.1016/j.brat.2016.02.006
Hamaker, E. L., Ceulemans, E., Grasman, R. P. P. P., & Tuerlinckx, F. (2015). Modeling affect dynamics: State of the art and future challenges. Emotion Review, 7(4), 316-322. https://doi.org/10.1177/1754073915590619 Hamaker, E. L., & Wichers, M. (2017). No time like the
present: Discovering the hidden dynamics in intensive longitudinal data. Current Directions in Psychological Science, 26(1), 10-15.
https://doi.org/10.1177/0963721416666518
Hamilton, M. A. X. (1959). The assessment of anxiety states by rating. British Journal of Medical Psychology, 32(1), 50-55.
https://doi.org/10.1111/j.2044-8341.1959.tb00467.x Hamilton, M. (1986). The Hamilton rating scale for
depres-sion. In Assessment of depression (pp. 143-152). Springer, Berlin, Heidelberg.
Heron, K. E., & Smyth, J. M. (2010). Ecological momentary interventions: incorporating mobile technology into psychosocial and health behaviour treatments. British Journal of Health Psychology, 15(1), 1-39.
113 Höhn, P., Menne-Lothmann, C., Peeters, F., Nicolson, N.A.,
Jacobs, N., Derom, C., Thiery, E., van Os, J., Wichers, M., 2013. Moment-to-Moment Transfer of Positive Emotions in Daily Life Predicts Future Course of Depression in Both General Population and Patient Samples. PLoS One 8, e75655. https://doi.org/10.1371/journal.pone.0075655 Houben, M., Van Den Noortgate, W., & Kuppens, P. (2015).
The relation between short-term emotion dynamics and psychological well-being: A meta-analysis. Psychological Bulletin, 141(4), 901. https://doi.org/10.1037/a0038822. Husen, K., Rafaeli, E., Rubel, J.A., Bar-Kalifa, E., Lutz, W.,
2016. Daily affect dynamics predict early response in CBT: Feasibility and predictive validity of EMA for outpatient psychotherapy. Journal of Affective Disorders, 206, 305–314.
https://doi.org/10.1016/J.JAD.2016.08.025
Jahng, S., Wood, P. K., & Trull, T. J. (2008). Analysis of affective instability in ecological momentary assessment: Indices using successive difference and group comparison via multilevel modeling. Psychological Methods, 13(4), 354. https://doi.org/10.1037/a0014173.
Kaiser, T. (2017). dyncomp: an R package for Estimating the Complexity of Short Time Series.
https://doi.org/10.17605/OSF.IO/GWTKX
Koval, P., Pe, M. L., Meers, K., & Kuppens, P. (2013). Affect dynamics in relation to depressive symptoms: Variable, unstable or inert? Emotion, 13(6), 1132. https://doi.org/10.1037/a0033579
Koval, P. (2014). Understanding Emotional Inertia: Pro-cesses Underlying the Autocorrelation of Negative Af-fect. PhD thesis.
Kuppens, P., & Verduyn, P. (2017). Emotion dynamics. Current Opinion in Psychology, 17, 22-26.
Kuppens, P., Sheeber, L. B., Yap, M. B., Whittle, S., Simmons, J. G., & Allen, N. B. (2012). Emotional inertia prospectively predicts the onset of depressive disorder in adolescence. Emotion, 12(2), 283.
https://doi.org/10.1016/j.copsyc.2017.06.004 Kuppens, P., Allen, N. B., & Sheeber, L. B. (2010).
Emotional inertia and psychological maladjustment. Psychological Science, 21(7), 984-991.
https://doi.org/10.1177/0956797610372634
Moskowitz, D. S., Russell, J. J., Sadikaj, G., & Sutton, R. (2009). Measuring people intensively. Canadian Psychology/ Psychologie Canadienne, 50(3), 131. https://doi.org/10.1037/a0016625
Lovibond, P. F., & Lovibond, S. H. (1995). The structure of negative emotional states: Comparison of the Depression Anxiety Stress Scales (DASS) with the Beck Depression and Anxiety Inventories. Behaviour Research and Therapy, 33(3), 335-343.
https://doi.org/10.1016/0005-7967(94)00075-u
Peeters, F., Berkhof, J., Rottenberg, J., Nicolson, N.A., 2010. Ambulatory emotional reactivity to negative daily life events predicts remission from major depressive disorder. Behaviour Research and Therapy, 48, 754–760.
https://doi.org/10.1016/J.BRAT.2010.04.008
Piccirillo, M. L., Beck, E. D., & Rodebaugh, T. L. (2019). A clinician’s primer for idiographic research: Considera-tions and recommendaConsidera-tions. Behavior Therapy, 50(5), 938-951.
https://doi.org/10.1016/j.beth.2019.02.002
Revelle, W. R. (2017). psych: Procedures for personality and psychological research.
https://CRAN.R-project.org/package=psych
Roche, M. J., Pincus, A. L., Rebar, A. L., Conroy, D. E., & Ram, N. (2014). Enriching psychological assessment using a person-specific analysis of interpersonal processes in daily life. Assessment, 21(5), 515-528. https://doi.org/10.1177/1073191114540320
Spindler, G., Stopsack, M., Aldinger, M., Grabe, H. J., & Barnow, S. (2016). What about the “ups and downs” in our daily life? The influence of affective instability on mental health. Motivation and Emotion, 40(1), 148-161. https://doi.org/10.1007/s11031-015-9509-7
Stone, A. A., Broderick, J. E., Schneider, S., & Schwartz, J. E. (2012). Expanding options for developing outcome measures from momentary assessment data. Psychoso-matic Medicine, 74(4), 387-397.
https://doi.org/10.1097/PSY.0b013e3182571faa Thompson, R.J., Mata, J., Jaeggi, S.M., Buschkuehl, M.,
Jonides, J., Gotlib, I.H., 2012. The Everyday Emotional Experience of Adults with Major Depressive Disorder: Examining Emotional Instability, Inertia, and Reactivity. Journal of Abnormal Psychology, 121, 819–829. https://doi.org/10.1037/a0027978
Trull, T. J., & Ebner-Priemer, U. (2013). Ambulatory assessment. Annual Review of Clinical Psychology, 9, 151-176.
https://doi.org/10.1146/annurev-clinpsy-050212-185510 Trull, T. J., Lane, S. P., Koval, P., & Ebner-Priemer, U. W.
(2015). Affective dynamics in psychopathology. Emotion Review, 7(4), 355-361.
https://doi.org/10.1177/1754073915590617
Wichers, M., Wigman, J. T. W., & Myin-Germeys, I. (2015). Micro-level affect dynamics in psychopathology viewed from complex dynamical system theory. Emotion Review, 7(4), 362-367.
https://doi.org/10.1177/1754073915590623
Wichers, M., Lothmann, C., Simons, C.J.P., Nicolson, N.A., Peeters, F., 2012. The dynamic interplay between nega-tive and posinega-tive emotions in daily life predicts response to treatment in depression: A momentary assessment study. British Journal of Clinical Psychology, 51, 206–222.
https://doi.org/10.1111/j.2044-8260.2011.02021.x Wright, A. G., & Zimmermann, J. (2018, August 5). Applied
Ambulatory Assessment: Integrating Idiographic and Nomothetic Principles of Measurement.