Parameters Affecting Automation
Engineering Efficiency
Author
Kristoffer Danielsson, Faculty of Engineering, Lund University
Supervisors
Bertil Nilsson, Faculty of Engineering Lund University
Magnus Wendt, Global Projects, Tetra Pak Processing Systems AB
iii
Preface
This project concludes my education in engineering. The creation of this report has not been the straight forward, easy, walk in the park I expected. As the project evolved and more data were gathered the results just wasn’t satisfying. So more data was gathered, slowly came the realisation that this data needed to be processed and analysed, this has not been an easy task.
When I started the project my belief was that this project was to give me insights in some theoretical frameworks and experience in writing a report. As the project is finished I realize that the personal benefits drawn from this experience is not only the theoretical knowledge gained, more importantly I have learned the benefits of a structural approach and that collecting even more data isn’t always the way to go.
The topic of this thesis describes both the path I’ve chosen for my specialisation within the electrical engineering education and the numerous voluntary projects on which I have worked. It feels like a perfect end to a great time within Lund University, Faculty of engineering.
I would like to thank Bertil Nilsson for his guidance, advices and his attention for details, without him this project would not have reached the same quality. I would also like to thank the people at Global Projects for being understanding, supportive and providing insight essential for this thesis. Especially I would like to thank Wojciech and Magnus for their time and their feedback. And on a personal note I would like to thank Emma for listening to my concerns and thoughts, and my family for their support and guidance during my studies.
Lund 15 may 2012
v
Executive summary
Title: Parameters Affecting automation engineering efficiency
Author: Kristoffer Danielsson
Supervisors: Bertil I Nilsson, Department of Industrial Management and Logistics, Faculty of Engineering, Lund University
Magnus Wendt, Manager Project Leaders, Global projects, Tetra Pak Processing Systems AB
Background & Problem:
The increased global competition has forced companies to perform project faster and better and minimising resource utilisation. This emphasis on efficiency is recognised by Tetra Pak Processing systems. Projects are complicated temporary endeavours, by
exploring the efficiency decreasing parameters knowledge about how to increase efficiency can be gained.
Purpose: The purpose of this thesis is to find the parameters affecting automation engineering efficiency. As the parameters are found suggestions on minimizing impact of the parameters are made. An evaluation model will be created from in which project affect can be analysed.
Method: This project uses a modified action research approach with and abductive research strategy. In addition an internal benchmarking between projects are conducted. The data collection is done via interviews and studying archive material
Thesis Results and Conclusion:
Data gathered during the initial phase of the project provided a first set of parameters which were to be assessed in an evaluation model, these parameters included, Functional description, Template Plant Master and Customer Value. As the model was later used and the parameters evaluated and given scores the result was that the top 3 affecting parameters in automation projects was; Modules, Template Plant Master and Customer Value. Conclusions drawn from the study are that there are two different areas of affecting parameters, first the ones affecting the projects in a direct context, secondly parameters affecting in an organisational aspect. The most critical sub area is the tools and templates which prevent the re usage of code and also decreases efficiency and productivity within projects
Key words: Automation projects, LEAN software development, CMMI-DEV, PMMM, Project management, Efficiency, TQM-projects
vi
List of Tables
Table 1: Abbreviation list for this thesis ... 8
Table 2 Definitions of productivity from different sources from (Tangen, 2004) ... 17
Table 3 Examples of definitions of efficiency and effectiveness, collected and presented by (Tangen, 2004) ... 18
Table 4 Definitions of efficiency, efficacious, effectiveness, and efficacy ... 19
Table 5 Summary of the characteristics and barriers for the five levels in PMMM adapted from (Kerzner 2001) ... 26
Table 6 Project office versus Centre of excellence (Kerzner, 2001, p 100). ... 28
Table 7 Levels of CMMI, summarized from (SEI, November 2010) ... 31
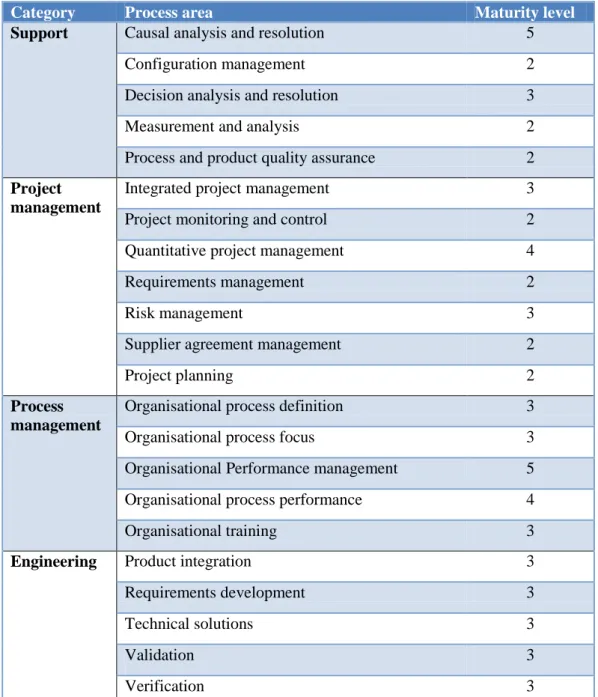
Table 8 Process areas, categories and maturity levels (Software engineering institute, SEI, 2010, p. 33) ... 32
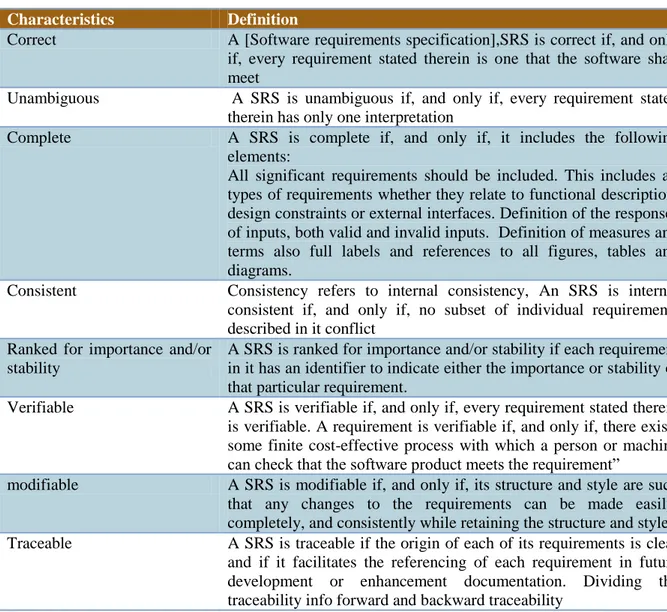
Table 9 Quality criteria for Software requirements specifications collected and summarized from (IEEE recommended practice for software requirements specifikation, 1998) ... 35
Table 10 The Seven types of waste in manufacturing (Melton, 2005) ... 40
Table 11 The seven wastes of Software development (Poppendieck & Poppendieck, 2003, p. 4) ... 41
Table 12: A comparison of Lean architecture to Classic software architecture (Coplien & Björnvig, 2010, p. 5) ... 49
Table 13: The principles of TQM from (Choppin, 1995) ... 51
Table 14: Measurements for project control (Shtub, Bard, & Globerson, 1994) s460 ... 55
Table 15: A short introduction of the projects ... 56
Table 16: Questions asked during the first set of interviews ... 56
Table 17: The evaluation model questions asked during interviews ... 69
Table 18: Evaluation model questions to be found in an archive study ... 70
Table 19: Number of respondents from each of the projects ... 71
Table 20: The questions which the respondents have answered with either a yes or a no ... 72
Table 21: List of the questions which have not been answered with a yes or a no ... 75
Table 22: Summary of the studied documentation, a minus sign means that no documentation were available(Tetra Pak) ... 78
Table 23: description of the FD quality based on an requirements specification classification from IEEE ... 78
Table 24: Scores for all project member categories summarized, with and without blank answers included ... 80
Table 25: Scores( in percent) for each of the project member categories ... 80
Table 26: Parameters per project scored for the negative impact they have of project outcome ... 83
Table 27: Parameters which affects the organisation and not individual projects ... 83
Table 28: Projects sorted on affecting value ... 84
Table 29: The parameters sorted by size, the most affecting parameters has the largest value ... 84
vii
List of figures
Figure 1 the Tetra Pak project business model (internal material, 2012) ... 1
Figure 2 The Tetra Pak project organisation (internal material, 2012) ... 2
Figure 3 Plant wide overview, what TPM can control. (internal material, 2012) ... 3
Figure 4 the main process of this thesis ... 7
Figure 5 12 Phase Benchmarking process, Modified from (Anand & Kodali, Benchmarking the benchmarking models, 2008) s 282 ... 12
Figure 6 the two dimensions that forms the foundation of the term efficiency reproduced from (Karlöf & Helin Lövingsson, 2007, p. 86) ... 19
Figure 7 the three variables to be managed in a project (Mantel, Meredith, Shafer, & Sutton, 2008) . 21 Figure 8 S-curve of a project life cycle, (Mantel, Meredith, Shafer, & Sutton, 2008, p. 8) ... 22
Figure 9 J-curve life cycle, (Mantel, Meredith, Shafer, & Sutton, 2008, p. 8) ... 22
Figure 10 Project resources (Kerzner 2001 s 36) ... 24
Figure 11 The five levels of project management maturity (Kerzner 2001, p 42) ... 25
Figure 12 Factors to consider for continuous improvements (Kerzner, 2001, p 111) ... 29
Figure 13 the three critical dimensions (Software engineering institute, SEI, 2010, p. 4) ... 30
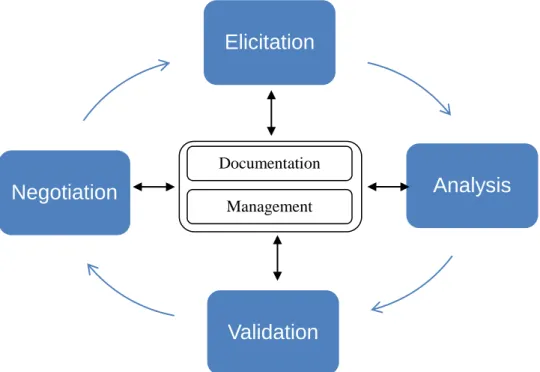
Figure 14 The Requirements Engineering Cycle (Sommerville, 2005, p. 17) ... 34
Figure 15 The benchmarking wheel, adopted from (Andersen & Pettersen, 1997) ... 37
Figure 16 12 phases in a 54 step benchmarking process (Anand & Kodali, Benchmarking the benchmarking models, 2008) ... 37
Figure 17 Progress of automation technologies (Viswanadham, 2002, p. 54)... 38
Figure 18 The benefits of Lean (Melton, 2005, p. 663) ... 40
When a company decides to implement LEAN a Value stream map is a good way of organising the discovery of waste. The value stream map follows a product through the process from beginning to end in the value chain. And as a tool it has proved to be useful “ in industry after industry, the process of mapping the value stream has invariably led to deeper insight about how internal processes work- or don’t work- to meet customer needs” (Poppendieck & Poppendieck, 2003, p. 9). To illustrate the tool a traditional value stream map is shown in figure 19 below:... 42
Figure 20 Traditional value stream map (Poppendieck & Poppendieck, 2003, p. 10) ... 42
Figure 21: A software kanban system, modified from (Poppendieck & Poppendieck, 2003, p. 75) .... 44
Figure 22: continuously improving design sustain productivity (Poppendieck & Poppendieck, 2003, p. 144) ... 48
Figure 23: The seven principles of LEAN software development adapted from (Poppendieck & Poppendieck, 2003) ... 50
Figure 24: Plan risk management: Inputs, Tools and Techniques, and outputs. Adopted from (PMI, project management institute, 2008, p. 277) ... 52
Figure 25: The project is viewed as a production line and the input/raw material is the pre-project ... 65
Figure 26: A brief overview of the progress of this thesis ... 67
Figure 27: Answer distribution for all projects, questions answered with yes or no ... 72
Figure 28: Distribution of which answers respondents have chosen to elaborate on, yes or no questions. ... 74 Figure 29: question 7 ... 76 Figure 30: question 10 ... 76 Figure 31: question 11 ... 76 Figure 32: question 11 b ... 76 Figure 33: question 21 ... 76 Figure 34: question 26 ... 76
viii
Figure 35: question 28 ... 76
Figure 36: question 48 ... 76
Figure 37: Question 53 ... 77
Figure 38: First survey, Management support , All respondents ... 79
Figure 39: First survey, Management support, Only APL responses ... 79
Figure 40: Second survey, Integrated process, All respondents ... 79
Figure 41: Second survey, integrated process, Only APL responses ... 79
Figure 42: third survey, Informal project management, all respondents ... 79
ix
Contents
1 Introduction ... 1
1.1 Tetra Pak Processing Systems AB ... 1
1.2 Purpose/problem description... 3
1.3 Objectives & goals ... 4
1.4 Delimitations ... 4
1.5 Deliverables ... 5
1.6 Disposition ... 6
1.7 Abbreviation list ... 8
2 Methodology ... 9
2.1 Scientific methods -a brief overview ... 9
2.2 Methodology of choice and tradeoffs ... 14
2.3 Conducting the study, an explanation of the phases. ... 15
3 Theoretical framework ... 17
3.1 Productivity and efficiency ... 17
3.2 Projects ... 20
3.3 Project management ... 23
3.4 Project evaluation models ... 23
3.5 Requirements ... 32
3.6 Benchmarking ... 36
3.7 Automation projects ... 38
3.8 Lean projects and Lean Software projects ... 39
3.9 TQM in projects ... 51
3.10 Managing Risks in projects ... 52
3.11 Processes and process orientation ... 53
3.12 KPI ... 54
3.13 The Pareto principle ... 55
4 Empirics phase 1 ... 55
4.1 Parameters Found to affect efficiency... 56
5 Analysis phase 1 ... 65
5.1 Analysis of empirics from first set of interviews, the construction of the model ... 65
6 Evaluation model ... 67
6.1 General questions ... 68
7 Empirics phase 2 ... 71
7.1 Results from interviews ... 71
x
7.3 Results from the PMMM Kerzner scale ... 80
8 Analysis phase 2 ... 81
8.1 Project analysis ... 81
8.2 Analysing affecting parameters ... 82
8.3 Parameter analysis ... 85
9 Analysis summary ... 88
10 Conclusions ... 90
10.1 Directly affecting ... 90
10.2 Organisational parameters... 92
11 Suggestions for improvements ... 93
12 Discussion ... 97
12.1 Comparing the end result towards the objectives. ... 97
12.2 Authenticity, validity and traceability ... 97
12.3 Comparing the results to theory ... 98
12.4 New areas of research ... 99
12.5 Personal reflections ... 99 13 Bibliography ... a
1
1 Introduction
The aim for this chapter is to provide the reader with an orientation of Tetra Pak Processing Systems and also give a brief overview of the commercial tool used by the automation team. Moreover it will define objectives, deliverables and delimitations of this thesis.
1.1 Tetra Pak Processing Systems AB
1.1.1 Global projectsTetra Pak Processing Systems AB (TPPS) is a company in the Tetra Pak group, one of the divisions within TPPS is called Global Projects (GP). The main responsibility for this division is coordination and implementation of those customer-order-projects which the market companies due to size or complexity lacks resources to complete. Automation is one of the services offered by GP, creating the control system for the plants designed and delivered by Tetra Pak.
Automation work is conducted in the form of a sub-project, based on the defined processes within TPPS. Because the scope of the orders both in time and in size is large it is a challenging task to maintain overview of the different activities within the sub-project, and relating them to the overall goal.
To be able to fulfil the goal of being more efficient the importance of efficacy in each project is a natural outcome. Efficacy can be achieved by knowing and being aware of what adds value to the customer, and finding a match between hours spent on activities and added customer value. Identifying the efficiency decreasing parameters will help GP gain the knowledge necessary to meet the present and future demands on effectiveness.
1.1.2 UCCD
The Process of TPPS is divided in to these following four steps, understand, create, convey, and deliver. Main focus during this thesis is on the Deliver phase.
Figure 1 the Tetra Pak project business model (internal material, 2012)
Understand: Involves finding the main objectives and needs for the customer and also deciding if the project is in line with the business goals of TPPS. This phase also involves understanding the plant performance, how much energy is needed, what waste is inevitable and the environmental impact of the plant. The performance requirements for this type of process; such as quality, safety, environmental, operational and supply capabilities and parameters are also studied during this phase.
2
Create; This phase is where a solution is created based on production concepts to fulfil the identified performance requirements. In this phase the process criteria are identified and described, such as outputs, inputs and main process steps. Moreover a description of customer value is done. A plant solution is then designed and evaluated against requirements and customer value.
Convey: This is where the solution is presented to the customer with a guaranteed plant performance to best fulfil customer value. Secondly a contract is signed and the customer and TP agrees upon when, how, and what to deliver. Also a risk response plan is created.
Deliver: Can be divided in to the production solution design, installation and validation. First the production solution is engineered, then installed and finally verified. Production Solution Design can be divided in; scope confirmation, functional design and technical design. In this phase the plant is created installed and verified so that the customer can benefit from the new infrastructure.
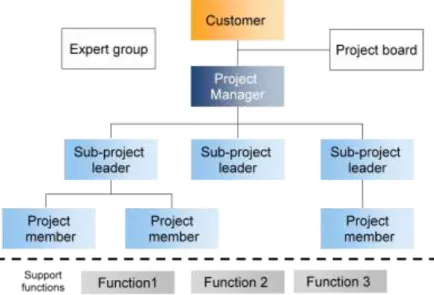
1.1.3 Project organisation
Within GP the plant orders are carried out as a project. Below the project organisation for GP is described.
Figure 2 The Tetra Pak project organisation (internal material, 2012)
The project structure can be described as follows; the market company is the interface towards the customer, and has responsibility and accountability towards the customer. The project can be divided in three sub-projects, as described above. These three areas are, Automation-, electrical, and process-design. Each of these subprojects has a project leader, which is coordinated by the project manager that is responsible for the whole project.
The automation project is coordinated by the automation project leader (APL), in the project team lead by the APL there is a system leader (SL), and a number of automation engineers (AE).
The project board consists of a maximum of six people; the project board has full accountability of the project and is to provide leadership and support to the project responsible.
3
1.1.4 Template PlantMaster
A commercial product called the Template Plant Master (TPM) is an automation solution developed by Tetra Pak. The purpose is to integrate and connect modules and process equipment with business information and ERP (enterprise resource planning) systems. In Figure 3 one can observe a plant which can be automated with the help of TPM.
Figure 3 Plant wide overview, what TPM can control. (internal material, 2012)
The TPM integrates all these parts in a template based system. Templates are based on existing software from, Rockwell, Wonderware, Siemens and ABB. The templates are designed to make engineering faster, better and allow for reusability. This integrated system is designed by Automation Solutions which is a group within TPPS AB. During this thesis the usage of TPM in the projects are widely investigated. It is therefore important that the reader understands the main concept of TPM. To further guide the reader TPM could be thought of in two aspects, first as a tool where templates are used to improve productivity in projects, secondly as a concept which can be communicated to the customer.
1.2 Purpose/problem description
The global competition increases the need to produce more with less resources and at a higher quality. These increasing demands put on companies are also recognized by TPPS. As a global leader in the processing industry, TPPS recognizes the importance of continuous improvement and strengthening of their leadership position.
Striving after effectiveness and realising the importance of being more effective, TPPS wants to improve their efficiency in Automation projects. By focusing on the activities performed in the projects and the external and internal variables affecting efficiency, Conclusions on how to improve can be drawn,. Mapping these areas of improvements to better deliver value to the customer, will help TPPS extend their leadership position.
This thesis studies engineering efficiency within the automation area, to deliver conclusions and suggest areas of improvements on where and how TPPS can increase their efficiency, and better prepare for the global challenges of tomorrow.
4
1.3 Objectives & goals
The objective of this study is to suggest improvements about how TPPS can become even more efficacious. Furthermore, with the help of literature, conclude on areas in which TPPS can improve and find the parameters affecting the automation engineering efficiency. The main objective of the study is described and to assess the main objective the following questions needs to be explored.
Parameters affecting efficiency in automation projects.
Is there a difference in the perception of affecting parameters based on the role of the individual
Implement LEAN, CMMI and TQM to minimize the effect of efficiency decreasing parameters
Test if a definition of efficiency from literature can be transferred to the projects at GP Maturity of GP in the PMMM sense.
Find conclusions on efficiency in automation projects at GP, drawn from a benchmarking study
These objectives are intended to be studied during this thesis. The main objective is to identify the parameters which affect automation engineering efficiency so that GP can improve its automation projects and increase productivity in their projects.
1.4 Delimitations
The focus of this thesis is on the parameters affecting automation engineering efficiency. Activities are studied in the context of their affect on the projects and their direct or indirect impact on the project. When studying the potential affect parameters have on the projects their impact on either time, cost or scope will be the measurement on which the judgement on including the parameter will be based,
The projects performed at GP are of different types, some projects are so called Greenfield projects where a plant is designed from scratch, in relation to Brownfield and Revamping projects which is upgrades and extensions of existing plants. This thesis will include all three. The automation part is a subproject within the creation of a plant; other areas such as process design and electrical design are examples of other subprojects. But as this thesis focuses on the parameters affecting automation engineering efficiency the study will be carried out from an automation perspective.
Three are different phases in the project, this study will focus on three areas within deliver; Functional description, Engineering, and FAT. Parameters affecting phases such as commissioning will not be studied within the scope of this thesis.
5
1.5 Deliverables
This thesis is written in cooperation with TPPS and therefore some well-defined deliverables are necessary. The deliverables is to form the basis for the result of the study but also to form checkpoint along the way where GP and the author can agree upon if the topic of choice is pursued in a satisfying manner:
1. A summary of lessons learned, Analysing the repetitiveness and usability. And how well they capture the parameters affecting efficiency.
2. A framework for evaluation of efficiency in projects.
3. Conclusions on what parameters which affects the efficiency.
4. Summary of the interviews stating the most common issues that decreases efficiency. Suggestions of improvements captured during interviews.
5. Suggestions on how to minimize the efficiency impact of the efficiency decreasing parameters
6. Ideas and suggestion on how GP can be more efficient not only based on the parameters but also ideas and practices found in literature that can be implemented.
7. The result will be delivered in the form of a report
8. The findings and conclusions will be presented on TPPS and at LTH.
When finished the intention is to deliver more knowledge about their projects to Tetra Pak, deliver a scientific contribution within the area of project efficiency, and also conclude the authors’ education in electrical engineering.
6
1.6 Disposition
In this chapter a brief overview of the disposition of this thesis is given. The aim of the disposition is to provide the reader with guidance in the structure of the report and also a possibility to choose the chapters which one will read.
Introduction
This chapter gives the reader an introduction of the company and provides a context for this thesis. It describes the project organisation and the UCCD process used by Tetra Pak. Finally it gives a short introductio n to the te mplate tool used by Global P rojects which is called Template Plant Master .
Methodology
Chapter 2 aims at defining some different scientific methodologies and approaches to this kind of study. As definitions are done the methodology for this thesis is described and also critically anal yzed.
Theoretical Framework
The intention of the theoretical frame work is to provide the reader with necessary knowledge in relating fields, also providing a foundation of related research. One should keep in mind that this topic is not a focused area of research and this has lead to the extent of the theor y chapter where a number of different theories have been explored. First in this chapter a definition of productivity and efficiency is provided . . Next projects and project manage ment is defined, followed by a description of some maturity models for projects. Require ments are subsequently explored with an intention to specifically provide kno wledge about soft ware requirements. LEAN and a LEAN extension for soft ware projects are explored, followed by a rationale for describing an automation project as a software project. Additionally some management theories are presented providing a frame work in particular for the conclusions Empirics 1
Semi-structured interviews have been conducted and in this empirics c hapter the results from these interviews are presented. The first topics from parameters are identified and will form the basis for the rest of the thesis. The choice of respondents have been made based on their involvement in one of the eight assigned pro jects distributed by Tetra Pak.
Analysis 1
After the interviews are conducted an evaluation model is the next step. In this chapter analysis on the first empirics will be conducted, and form the basis for the questions to be asked in the model.
Evaluation model
The model is a set of questions which will both be asked to the documents and during interviews. In this chapter the questions are presented and divided into ; question answered by studying documentation and questions to be a nswered during interviews .
Empirics 2
In this chapter the result from the evaluation model is presented, moreover a maturity assessment model by Kerzner is used and the result from this survey is presented. In this chapter the content of each of the parameters are described and explored further.
7
Analysis 2
The Analysis identifies the parameters affecting automation engineering efficiency based on the ranking of the parameters per project and also a summary of all projects. The scores from each of the parameters are then ranked to provide information about the affecting parameters. Analysis summary
In the final analysis the results from the first set of intervie ws are analysed in the light of the second set of intervie ws. This last analysis summary is done to connect the two interviews and to find whether there are similarities between projects and issues that are returning.
Conclusions
The conclusions chapter provides four areas from where conclusions about parameters can be drawn. The four areas which have bee n found to affect efficiency, and are believed to be areas to assess to increase efficiency. These areas are a well performed Understand Phase, proper tools, internal cooperation and a coherent project process.
Suggestions on improvements and lessons learned
In this chapter the main focus is on three suggestions of philosophies which GP could pursue to increase efficiency. The main suggestions involve minimizing waste, stating and measuring quality and developing the organisational learning by addressing the process improvements steps in CMMI.
Discussion
In the discussions chapter the methodology is evaluated against the ends result. Further research is emphasized and some personal reflections are given.
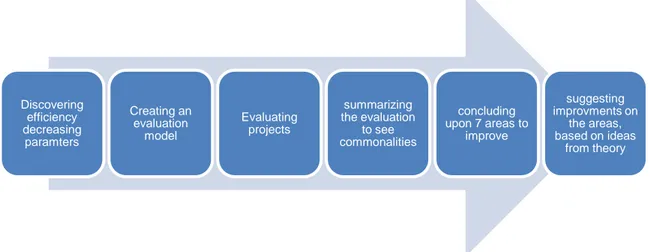
Below the process of this thesis is described, the disposition of the thesis follows the process.
Figure 4 the main process of this thesis
Discovering efficiency decreasing paramters Creating an evaluation model Evaluating projects summarizing the evaluation to see commonalities concluding upon 7 areas to improve suggesting improvments on the areas, based on ideas from theory
8
1.7 Abbreviation list
This table provides the reader with a list of the common abbreviations used in this thesis with the intention to make reading easier.
Table 1: Abbreviation list for this thesis
Abbreviation Explanation
KPI Key performance indicators
BPM Business process management
PMMM Project management maturity model
CMMI Capability mature model integration
CMMI-DEV Capability mature model integration for development
TOC Theory of constraints
TQM Total quality management
TPS Toyota production system, the basis for LEAN production
JIT Just in time
PI Performance indicators
TPPS Tetra Pak Processing Systems
GP Global projects
TP Tetra Pak
D&B Dairy and beverage another Tetra Pak internal company
FD Functional description
PFS Process functional specification
WBS Work breakdown structure
APL Automation project leader
PL Project leader
TC Technical coordinator
AE Automation engineer
SL System leader
PMI Project management institute
SEI Software engineering institute
SRS Software requirements specification
FAT Factory Acceptance Test
PM Project Management
AS Automation Solutions
9
2 Methodology
This chapter will give a short introduction to the science of research-methodology, explaining different types of research-strategies and -design available, and deepening the study on the areas relevant for this thesis. The second part of the chapter will justify the methods of choice and give the author’s motivation for those choices and their possible shortcomings. The third part will explain how the research will be conducted and what different types of activities that will be the foundation of this thesis.
2.1 Scientific methods -a brief overview
2.1.1 Research methodology, why and how?Höst, Regnell and Runesson (2006) argues that methodology is the choice of modus operandi for the thesis, and that it does not in detail describe do’s and don’ts but explains the way from overall objective to an increased knowledge in the subject. Denscombe (2009) states that choices on methodology are to be made, but no method is perfect, every choice has its drawbacks as well as its advantages. It is just a matter of choosing those that have the most advantages for the topic of choice. Bryman (2009) states that one should focus on three things; firstly knowing what not to do, secondly knowledge about your options, and finally the benefits of general knowledge. All these definitions gives different views on the scientific methodology; summarizing one can say that the choice of methodology defines the path to follow, what roads to avoid and also making the trip a bit smoother when writing your thesis.
2.1.2 Research design
The research design of choice is dependent on where and how data is available and also the overall objective of the study. Höst et al. (2006) defines it as the “goal and objective of the study” in addition to Denscombe (2009) who describes it as the method on how to gather and construct empirical data. Bryman (2009) defines it as the technique on how to gather data. The authors have the same view on what types of studies that exists.
Case study
A case study is a method in which the researcher tries to give a general description of a phenomenon by studying a specific case. Denscombe (2009) argues that this method is used to study a single unit. Höst et al (2006) widens the focus to an object as well as to a phenomenon. Bryman (2009) defines the term in a more geographical context to be limited to a certain place or an organisation. Denscombe ( 2009) also describes the importance and the considerations to be made choosing the case “ a case study is to be chosen carefully concerning the characteristics found in the case- characteristics that are especially significant for the problem or hypothesis the researcher wish to investigate.” (Denscombe, 2009, p. 64)
In practice the gathering of empirical data is done via, interviews, observations and analysis of archive material. It is a common method of choice when analysing a phenomenon and especially when that phenomenon is hard to distinguish from its environment (Yin 1994 in Höst et al. 2006).
Action research
Action research has four characteristics: it is practically oriented, it takes place during a change, it’s a cyclic process and the researcher is involved in the process. The researcher is involved and gathers
10
data during the process and observes the implications of the changes made. Höst et al (2006) concludes that the action research approach is a method of choice when implementing improvement, and observing the result of the change. Somekh (1995 see (Denscombe, 2009)) argues that action research is the integration of the research process and the action processes, meaning that the action is implemented and the research is conducted on effects of the changes made. Denscombe (2009) states that the most distinguishing detail of action research is the participation of the researcher in the process.
Survey
The survey methodology usually focuses on the width rather than the depth of a research field. Survey refers both to the methodology of gathering data and conducting a detailed and comprehensive study (Denscombe, 2009). Bryman (2009) on the other hand avoids the name survey and instead introduces the term “cross sectional study” arguing that survey to often is misinterpreted as the gathering of data via questionnaires. Bryman defines the cross sectional study as” gathering data from more than one case (often many more than one) at a certain point in time with the intention to come up with a series of quantifiable and qualitative data with relation to two or more variables (often much more than two) that are examined to detect patterns regarding different kinds of connection” (Bryman, 2009, p. 64)
Experiment
Experiment is the observation of a phenomenon and the understanding of that phenomenon via an empirical gathering of data. The experiment procedure isolates a number of variables and examines the causes of that isolation on the system (Bryman, 2009). The experiment method is normally used in applied science and something people relates to white coats and expensive equipment. According to Denscombe (2009) the experiment method is used to examine the cause-effect relationship by manipulation of single variables.
2.1.3 Data collection
Data forms the foundation for analysis and a number of gathering methods are available, a short introduction to the methods at hand is described below.
Surveys
Surveys are a data collection method often conducted on paper or in an electronic form where respondents are asked to answer a number of questions. To be characterized as research-related a survey must fulfil the following requirements: be designed to gather information that can be used as data, consist of a series of questions and gather information by asking people directly (Denscombe 2009). Bryman (2009) categorises the survey method as a quantitative data collecting method.
Observations
Observation is a data-collection method which relies on visual observation of a series of events (Denscombe 2009).
Different ways of participating in a group or activity is; observing-participant, complete-participation, participating, and completely observing (Höst et al 2006). Two dimensions can be identified: interaction and the knowledge of being observed. An observation can take place without the group
11 knowing and with the researcher having little interaction. Or the group being well aware of the observant and the researcher participates as yet another group member.
Archive material
Studying archive material in companies is a way of learning of past behaviour and analyzing the work with the end-result of for example a project at hand. When conducting an archive analysis and studying documents in general Denscombe (2009) uses Platt (1981) and Scotts (1990) criteria; authenticity, credibility, representatively, and contents. The document must be evaluated against and fulfil these four criteria to be able to fulfil the requirement of a valid research document.
Interviews
To gather information and data in qualitative research a common method is interviews. The interview can be conducted in different ways and depending on the aim with the interview there are different approaches to the technique. Denscombe (2009) describes a number of methods available. Below unstructured and semi-structured will be described. In these interviews the aim is to get the viewpoint of individuals about certain topics (Denscombe, 2009). The unstructured is often referred to as a conversation where the researcher listens and let the course of the interview be set by the interviewee. In a semi-structured interview some questions and topics to be discussed is set but the interviewee is given a freedom to pursue thought and develop arguments around the topics. Another interview form is the structured interview which focuses around a set of predefined questions and the respondent is asked to give short answers to the questions.
Denscombe (2009) describes some of the criteria for a successful interview which are derived from Kvale (2006). Some of these criteria are; the researchers need to be skilled in the topic, structured during the interview, and also to interpret the interviewee and clarify the answers about what the interviewee states.
Benchmarking
On the topic of benchmarking a variety of techniques and methods are available. The benchmarking models can be categorized in to three different categories (Anand & Kodali, Benchmarking the benchmarking models, 2008); Academic/research-based, Consultant/expert-based, Organization- based.
There is no consistent definition of the benchmarking term but as proposed by Maire et al (2006 in (Anand & Kodali, Benchmarking the benchmarking models, 2008)) the differences can be seen as a description of the evolution of benchmarking, as the methods are adopted and customized.
The background to term Benchmarking is often thought to be from the process of putting devices on a bench and comparing them. According to (Karlöf & Helin Lövingsson, 2007) the term derives from the land surveying term were a spot was marked in red on the bedrock which then was used as a reference point. The point was fixed in three dimensions and where used to measure heights for building and other construction work.
A definition is proposed by Kumar in Anand &Kodali (2008)
“It is the process of identifying, understanding and adapting outstanding practices from organizations anywhere in the world to help an organization improve its performance. It is an
12
activity that looks outward to find best practice and high performance and then measures actual business operations against those goals” (Kumar et al, 2006 in (Anand & Kodali, Benchmarking the benchmarking models, 2008))
Benchmarking in industry is said to be invented by the Xerox Corporation which due to decreasing margins travelled to Japan and did a comparison study of their copy and printer industry (Karlöf & Helin Lövingsson, 2007) , (Larsson, 2007).
The result of Anand & Kodali (2008) study is a 12 phase 54 step model for benchmarking. Below in, Figure 5 the proposed 12 phase model is illustrated.
Figure 5 12 Phase Benchmarking process, Modified from (Anand & Kodali, 2008, p. 282)
As seen in this figure the preferred benchmarking model involves the implementation and continuous improvement phase as well as the collection of data along with the planning of the collection. Meaning that the process does not end with the collection of knowledge but also focuses on improvements as findings are derived.
Some comments on the implementation on benchmarking and the weaknesses that comes with misinterpretation are made by (Karlöf & Helin Lövingsson, 2007) where comparisons can be made with either non regulated key figures, or regulated key figures, correct benchmarking involving correct key figures, process descriptions and effect cause correlations. The weaknesses of the two first methods are apparent and needs to be avoided if the benchmarking process is to gain knowledge to build on and examples to implement.
Team formation Subject identification customer validation Management Validation Self Analysis Partner selection Pre-Benchmarking activities Benchmarking GAP analysis Action Plans Implementation Continious improvment
13
2.1.4 Quantitative versus qualitative
One can categorize data in two categories; the quantitative which is often seen as numbers, and the qualitative which is often seen as subjective opinions. According to Höst et al (2006) quantitative data is: “such data that can be counted and classified, and qualitative as words and descriptions”. Bryman (2009) gives a deeper dimension to the different data collection strategies; claiming, that the quantitative research takes the approach of a deductive viewpoint, where as the qualitative approach is
more of an inductive approach.
There are ways to convert qualitative data to quantitative data with the help of for example content analysis (Bryman, 2009)
2.1.5 Two different types of research-conclusions
The choice of research-strategy is the first decision to be made by the researcher depending on the aim of the study; if it’s to produce theories by gathering empirical data or whether it is to verify theories by gathering empirical data. The strategy forms the basis for the hypothesis and therefore the foundation for the study. According to Bryman (2009) inductive and deductive methods are the relationship between theory and results, and Denscombe (2009) widens the perspective to it forming the underlying philosophy of the study
Inductive
Inductive theory is when the theory is the result of the research (Bryman, 2009). Basically the start of the project is gathering data via observation and producing theories to give a general explanation of the phenomena studied.
Deductive
Deductive methodology is a mapping of theories towards data, and via empirical tests verifying the results (Denscombe, 2009). This is the most common approach in the research field of social sciences.
Combining inductive and deductive
There is the possibility to alternate between the approaches and Björklund and Paulsson (2003) argue that this is to be called an abductive approach. Denscombe (2009) states that the two methods contain some degree of the other and do not give a distinct name on the mix.
Grounded theory
In 1967 Glasser & Strauss published a book called, The discovery of grounded theory: Strategies for quantitative Research. The idea behind their method is that during the empirical gathering of data the analysis is taking place simultaneously whereas the end result is a theory. The latest definition of grounded theory is “Theory which has been derived from data collected and analyzed in a systematically way during the research process. “ (Strauss & Corbin 1998 p12 see (Bryman, 2009)). Denscombe (2009) means that this approach is preferable in small-scale-project research and research that focuses on human interaction. Grounded theory offers a method suitable in four different categories of research: qualitative, exploratory, studies of human interaction, and small-scale-projects
Triangulation and methodology combination
At a first glance triangulation and methodology combination can seem identical, but there are differences between them. Triangulation is the viewing of the problem from different perspectives while methodology-combination is the usage of different methods to reach a conclusion. Denscombe (2009) gives some examples on different kind of methods in triangulation all with the common goal on verifying the result. The combination of methods gives the researcher a possibility to overcome the weaknesses of a chosen method by combining it with another one
14
2.2 Methodology of choice and tradeoffs
This thesis is written at Tetra Pak Processing Systems AB (TPPS) and their department for Global Projects (GP). The study will take place during four months and are to be presented in May 2012. It consists of the following parts:
A study of finished projects with the intention to identify the activities that affects automation engineering efficiency
Interviewing employees at TPPS.
Evaluation of the parameters affecting automation engineering efficiency
This is characterized as an abductive study which alternates between theory and result. Being mainly based on a cross sectional study at TPPS, the weaknesses with the cross sectional study is to be avoided by combining aspects of other methods such as the case and action research method. The study takes place at TPPS and investigates whether conclusions from old and ongoing project about engineering efficiency can be drawn. The data gathering is done via observations, interviews and studying archive material. This will give a view of the automation projects from a participants view. Combined together with the other data a systematic viewpoint can be constructed and analyzed to suggest areas of improvement.
The first set of interviews will be performed via a semi-structured interview model where some general questions about the situation and possible areas of improvement will be discussed. This will form the basis of the immersed literature study and also the evaluation model. The theories will be combined and condensed to fit the purpose of the thesis and give the foundation for further interviews. The second round of interviews will be a structured interview based on both theory and the study of the archive material. The findings in these interviews are to form the foundation for the conclusions By using some ideas from grounded theory the conclusions from interview and data gathering will be analysed and used during the thesis work.
In conclusion; the research is an abductive method which uses a combination of methodology and data gathering methods described above. That in this project is described as a modified action research
Furthermore the selection for the internal interviews will be based on availability and experience.
2.2.1 Choices made
The choices will be made based on how well they suited the information available, the expected results, and the characteristics of this study. In order to give conclusions and not stating the obvious a number of different data must be collected and analyzed. This is done with different techniques and creates a broad analysis. The choice of a modified action-research approach guarantees the result to be relevant and also implementable.
2.2.2 Critique of the research method of choice.
The modified Action research approach is not found in the literature studied and therefore the limitations and weaknesses of these methods are to be taken into consideration in the analysis. Asking for the implications based on a theoretical reasoning can be an approach that is time consuming and
15 does not provide a satisfying result by itself, therefore the result must be validated against other results and lessons learned.
Since the thesis cannot be defined as a focused area of research the connections to theory must be evaluated against a number of different theories in other fields. Nevertheless the theory available is perhaps not appropriate for this project and wrongful conclusions can therefore be made.
Finally the documentation about old projects and time spent is dependent on the form in which they are reported this can led to inadequacies in the archive analysis which means that a stronger focus is to be put on interviews and observations.
During the interviews the ethical aspects must be considered so that the employees feel comfortable sharing information about current weaknesses in automation projects.
2.2.3 Evaluation of results
Evaluation of the conclusions and the data will be done against theories and be assigned if the result is credible. To be implementable for TPPS the recommendations is to be done in such a way that they fit the organization of Global Projects and be based on the processes at TPPS. By evaluating the results against processes and added workload during the project the recommendations provides TPPS with a usable result for implementation in future projects.
Since the projects are complex and spans over long time it is not possible within the time limit of this thesis to conduct the study and observe the implementation of changes and evaluate the effects. Therefore this method is chosen to prevent the suggestions made from being of a non implementable character.
2.3 Conducting the study, an explanation of the phases.
By dividing the work in to a number of phases, the delivery of a phase can be mapped towards end delivery for a better overview of the project. This thesis will consist of four phases.
Phase 1: Preparation phase Phase2: Initial Data collection
Phase 3: Data collection and analysis
Phase 4: Conclusions, recommendations and evaluation.
Phase 1
Phase 1 is the preface of the project, this is where methodology is chosen and theories are explored. This is also where the basic understanding of TPPS is done and the problematization of the subject is done.
Phase 2
Initial data collection is done to determine the projects to study and the questions for the interviews. In this phase initial interviews are done to decide upon parameters
16
Phase 3
Phase 3 is the general Data collection and analysis which will be conducted simultaneously.
Phase 4
Finally the conclusions will be drawn based on analysis and data, recommendations and lessons learned will be derived from the conclusions and the project will be evaluated.
17
3 Theoretical framework
The intention of the theoretical framework is to provide the reader with necessary knowledge in relating fields, also providing a foundation of research relevant for this thesis. One should keep in mind that this topic is not a focused area of research and this has lead to the extent of the theory chapter where a number of different theories are explored to provide the reader with useful terminology and theories in project and project efficiency.
3.1 Productivity and efficiency
The purpose of this thesis is to identify parameters affecting the efficiency in automation projects. As Tangen (2004) concludes: does neither productivity nor efficiency have one definition. Neither is there a consensus between academia and industry on the definition. However this thesis will not try to solve this dispute.
As stated above is the definition for productivity neither consistent nor is there a coherent view of the term. It is believed that the term derives from the French physiocrats in the 18:th century, when it was defined as ‘production capability’ (SOU 1991:82, 1991). Depending on whether the definition is verbal or mathematical it has different meanings and depths (Tangen, 2004). Below are some definitions of both mathematical and verbal nature described.
Definition Reference
Productivity=units of output/units of input Chew 1988
Productivity=actual output/expected resources used Sink and Tuttle 1989 Productivity=total income/(cost+goal profit) Fisher 1990
Productivity=value added/input of production factors Aspén 1991 Productivity is defined as the ratio of what is produced to what is
required to produce it. Productivity measures the relationship between output such as goods and services produced and inputs that include labour, capital, material and other resources
Hill, 1993
Productivity is the ability to satisfy the market’s needs for goods and services with a minimum of total resource consumption
Moseng and Rolstadås 2001 Productivity refers to the ratio between the actual result of the
transformation process and the actual resources used
Jan van Ree 2002
Table 2 Definitions of productivity from different sources from (Tangen, 2004)
As concluded by Hayes “productivity, a concept that is almost as hard to explain as it is to measure, typically it is calculated by dividing a country’s (or an industry) ‘output’, adjusted for inflation , by the numbers of labour hours required to create it” (Hayes & Wheelwright, 1984, p. 2)
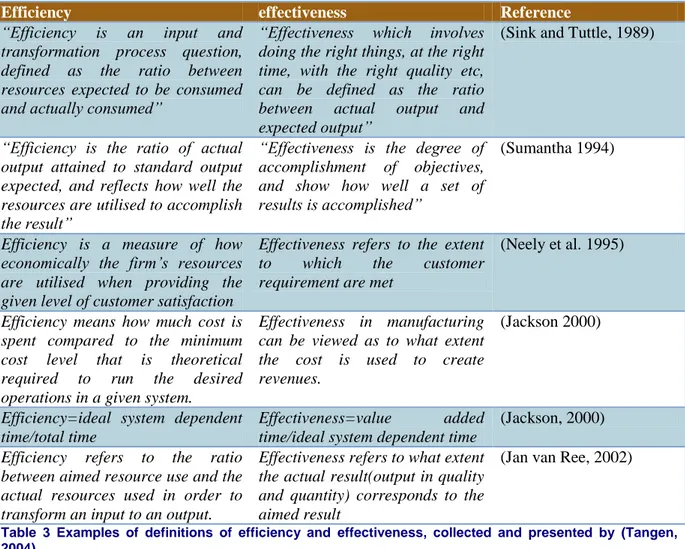
3.1.1 Efficiency
The core of the term efficiency is the relationship between delivering a value that is greater than the cost of producing the same value (Karlöf & Helin Lövingsson, 2007). Tangen (2004) discusses the differences between the term efficiency and effectiveness. While no coherent definition exists in the case of productivity. Tangen (2004) concludes that efficiency can be seen as “doing things right” and effectiveness is “doing the right things” (Sink and Tuttle 1989 in (Tangen, 2004)). Another definition of efficiency is “the gap between the production line and the best applied version of the same technique” (SOU 1991:82, p. 76) which is a definition that is production oriented. Karlöf et al (2007) also describes these two terms and concludes that efficiency is the balance between usage of resources
18
and input and effectiveness is defined as the fulfilment of an organizational goal. This definition does not involve the customer or adding value if that is not stated in the goals of the organization.
Efficiency effectiveness Reference
“Efficiency is an input and transformation process question, defined as the ratio between resources expected to be consumed and actually consumed”
“Effectiveness which involves doing the right things, at the right time, with the right quality etc, can be defined as the ratio between actual output and expected output”
(Sink and Tuttle, 1989)
“Efficiency is the ratio of actual output attained to standard output expected, and reflects how well the resources are utilised to accomplish the result”
“Effectiveness is the degree of accomplishment of objectives, and show how well a set of results is accomplished”
(Sumantha 1994)
Efficiency is a measure of how economically the firm’s resources are utilised when providing the given level of customer satisfaction
Effectiveness refers to the extent to which the customer requirement are met
(Neely et al. 1995)
Efficiency means how much cost is spent compared to the minimum cost level that is theoretical required to run the desired operations in a given system.
Effectiveness in manufacturing can be viewed as to what extent the cost is used to create revenues.
(Jackson 2000)
Efficiency=ideal system dependent time/total time
Effectiveness=value added time/ideal system dependent time
(Jackson, 2000) Efficiency refers to the ratio
between aimed resource use and the actual resources used in order to transform an input to an output.
Effectiveness refers to what extent the actual result(output in quality and quantity) corresponds to the aimed result
(Jan van Ree, 2002)
Table 3 Examples of definitions of efficiency and effectiveness, collected and presented by (Tangen, 2004)
As the Swedish language contains only one term regarding efficiency in the sense of the definitions above, some other terms are explained below to provide the reader with some definitions of words used later.
Efficiency “Economic efficiency, the efficiency with which scarce resources are used and organised to achieve stipulated economic ends. In competitive conditions, the lower the cost per unit of output, without sacrifice of quality, in relation to the value or price of the finished article, the greater the economic efficiency of the productive organisation.”( A. Gilpin Dict. Econ. Terms
19 57 ,1966)
“The relation between the prospective yield of a capital-asset and its supply price or replacement cost, i.e. the relation between the prospective yield of one more unit of that type of capital and the cost of producing that unit, furnishes us with the marginal efficiency of
capital of that type.”( J. M. Keynes Gen. Theory Employment iv. Ii. 135 ,1936)
“Productivity is the efficiency‥of production”( G. Hutton We too can Prosper i. 13,1953 ) Efficacious “That produces, or is certain to produce, the intended or appropriate effect; effective. (Said of
instruments, methods, or actions; not, in prose, of personal agents.)” (Oxford English
dictionary)
Effectiveness “The quality of being effective (in various senses)”. (Oxford Enligsh Dictionary)
Efficacy “Power or capacity to produce effects; power to effect the object intended” (Oxford English
Dictionary)
Table 4 Definitions of efficiency, efficacious, effectiveness, and efficacy
For the reason of this thesis the following context of the above mentioned words will be used.
Efficiency- Will be used to describe how well a project is performed compared to the ideal state.
Efficacious- is used in this thesis to describe actions and entities that has the intention to produce an efficient result.
Effectiveness- if a work is produced with little gap in relations to the best result achievable. Then it has a high effectiveness.
Efficacy- what does the tool produce, when a tool or measurement has the capacity to produce the intended effect
All these words describe in some sense the end result or the capacity to produce that end result. The definition chosen in this thesis are:
“Efficiency refers to the ratio between aimed resources use and the actual resources use in order to transform an input to an output.”(van Ree 2002)
3.1.2 Relationship between Efficiency and Productivity
Figure 6 the two dimensions that forms the foundation of the term efficiency reproduced from (Karlöf & Helin Lövingsson, 2007, p. 86) Cus tom er v al ue Productivity
20
As seen above the productivity is basically measuring the transformation of resources and efficiency describes how well this is done compared to an ideal state.
One aspect is the customer value, which is often defined as the percieved customer value. Customer value is the sacrifice which the customer is willing to do to get the intended quality. If the customer pays a price at which the delivered quality is percieved to match the sacrifice, then customer value has been added. (Karlöf & Helin Lövingsson, 2007)
Productivity is according to the definitions above a relationship between input and the output, also measuring how well the inputs are used to produce the intended output.
3.2 Projects
During some years it has been a lot of focus on projects. (Mantel, Meredith, Shafer, & Sutton, 2008) argues that the reason for this is simple; projects align responsibility and organizational goals to individual and small group work tasks when their job is not part of the routine work at the company. Some definitions of projects are provided below
” A project is an organized endeavour aimed at accomplishing a specific non routine or low-volume task” (Shtub, Bard, & Globerson, 1994, p. 1)
The basics of a project is that it is limited in time, is unique in some sense and have a specific and denoted deliverable (Mantel, Meredith, Shafer, & Sutton, 2008) other definitions of projects such as:” a temporary endeavour undertaken to create a unique product or service (project management institute, 2004)” Or
“ The entire process required to produce a new product, new plant, new system or other specified result”( Arcibald 1976 in (Shtub, Bard, & Globerson, 1994, p. 5) )
“A narrowly defined activity which is planned for a finite duration with a specific goal to be achieved” (General electric 2007 in (Shtub, Bard, & Globerson, 1994, p. 5))
Projects are often carried out in programs, where a number of projects are carried out to achieve a certain program goal. At TPPS a programme can be the construction of a plant facility and the projects are subparts of the construction of this facility, for example the automation part or the mechanical engineering part.
There are different types of projects, ranging from types that are set up to achieve strategic goals, to projects that are designed to improve project effectiveness (Mantel, Meredith, Shafer, & Sutton, 2008)No matter what the project is designed to do one must be able to measure the success of a project. Three interrelated and sometimes conflicting variables are used to define the parts to be managed in a project. These are:
21
Figure 7 the three variables to be managed in a project (Mantel, Meredith, Shafer, & Sutton, 2008)
According to (Mantel, Meredith, Shafer, & Sutton, 2008) some argue that quality is one goal, Mantel et al. on the other hand argues that the quality is an inherent part of the project specification. The project goals are all approved by the client.
Projects are as mentioned before temporary endeavours created to provide value to the customer. But does the project make this task easy. The answer would be yes if the future was predictable and deterministic. But as the world and future is not fully predictable and not deterministic the project is characterized by uncertainty (Mantel, Meredith, Shafer, & Sutton, 2008)
Managing the uncertainty while fulfilling the performance, cost and time requirements is a matter of trade offs and planning. The management of projects is in literature extensively described and as in fashion there exist as many different methods as there are project managers, in the following part some comments about project management is made. But the question is whether projects can be a routine work, with solid scheduling in the beginning. The answer to this is no quoting Mantel et al.: ” projects must have some flexibility. Again this is because we do not live in a deterministic world. Occasionally a senior manager (who does not have to manage the projects) presents the Project manager with a document precisely listing a set of deliverables, a fixed budget and a firm schedule. This is failure in the making for PM. Unless the budget is overly generous, the schedule overlong and the specifications easily accomplished, the system is, as mathematicians says, “over determined.” If mother nature so much as burps, the project will fail to meet its rigid parameters (Mantel, Meredith, Shafer, & Sutton, 2008, p. 7)
Concluding the project chapter, “A pm manager cannot be successful without flexibility (Mantel, Meredith, Shafer, & Sutton, 2008, p. 7)
When planning for a project one can use either of the curves in the figures below to map resource usage during the project life cycle. The derivative of the curve indicates the expected workload put on the project team. Whereas the left one indicates that 80 % of the work is performed during 20% of the time, and the right one indicates a slow start where the workload increases exponentially until project termination.
22
Figure 8 S-curve of a project life cycle, (Mantel, Meredith, Shafer, & Sutton, 2008, p. 8)
Figure 9 J-curve life cycle, (Mantel, Meredith, Shafer, & Sutton, 2008, p. 8)
These curves provide information about the accumulated usage of resources and are to indicate where a majority of the workload is put on the project.
3.2.1 Evaluating the project
Evaluation of a project is undertaken as a task to appraise against the initial plan of the project (Mantel, Meredith, Shafer, & Sutton, 2008). The task is not to be done only when the project is finished, but rather as a continuous review to create information that can be used for decision and control purposes.
A number of different techniques for evaluation exist and the description in this chapter aims at providing a generic insight on evaluation of projects. To measure project one must define what is seen as a successful project (Kerzner, 2001). In a study by Shenhar Levy and Dvir (1997) success was categorized as succeeding in four dimensions; how efficiently did the project meet its budget, customer satisfaction and impact, business success i.e. how successful was this project in business terms, and did the project create future potentials. Mantel et al. (2008) suggests that evaluation should be done with the selection process in mind, why was this project funded and selected. In conclusion: “a project evaluation is an appraisal for use by top management. Its criteria should include the needs of management; the organization’s stated and unstated goals; the original selection basis for the project; and its success to date in terms of its efficiency, customer impact/satisfaction, business success and future potential. Measuring the project’s success on budget, schedule, and performance is easier than measuring revenues or qualitative, subjective factors. Establishing the measures at