11 June 2014
1
Assessing the Market Attractiveness for a
Renewable Energy Source
-
A case study of the expanding wind power market in Finland
Carl Fredrik Leifland & Christoffer Löfquist | Faculty of Engineering, LTH at Lund University | 2014
Finland recently introduced a most beneficial feed-in tariff premium for wind power to boost the expansion in order to meet its target of 38 % energy consumption from renewable energy sources (RES). The market is still young where both developers and governmental agencies are gaining experience to stream-line the permitting process. The main question is: are there viable business opportunities in wind power in Finland?
The Master Thesis “Assessing the Market Attractiveness for a Renewable Energy Source – A case study of the expanding wind power market in Finland” by authors Carl Fredrik Leifland and Christoffer Löfquist conclude that indeed there are. However, several risk factors were also identified and are necessary to assess before possibly entering the market. The thesis was produced at the Faculty of Engineering, LTH at Lund University as the authors’ final assignment to attain their Masters of Science in Industrial Engineering and Management.
Evaluating a reference project indicated yield of 6.5 % to enter the market, while the main concerns are that a project must be included in the current tariff system and that the subsidy system will not be changed due to its extremely lucrative nature.
Evaluating a market
In order to reach the conclusion of Finland being a viable market, a new theoretical framework was developed based on existing theories. The framework is called the CL2-model and is deemed to be
applicable onto most geographical markets RES dependent on weather, such as wind power or solar power. The model, visualised in figure 1 below, consist of two fundamental categories: the market assessment and the lifecycle of the RES. The categories were assessed in three steps: the current market situation, the predicted future of the market, and the main risks of the market. Based on the findings, the market was then evaluated quantitatively through capital budgeting and also qualitatively.
Figure 1: The CL2-model
Market assessment
The market assessment part is divided into four main parts: global, national, energy, and RES. In accordance with figure 2, the user should start from the top and place more and more time investigating the next area. The first two parts focus more on the
11 June 2014
2
geographic area to be examined, while the second two focus more on the chosen RES. The market assessment is most likely to examine qualitative factors affecting a potential market entry. Due to the highly politicised matter of energy and electricity, this factor is most important to consider in this sub-model.Figure 2: The market assessment sub-model
The RES life cycle
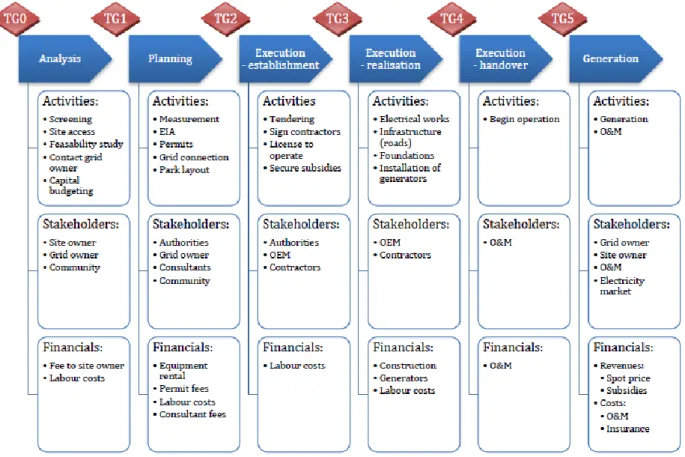
The life cycle is broken down into phases, based on Semcon’s XLPM project life cycle model to fit the life cycle of a weather dependent RES (henceforth WDRES). In each phase the different activities, stakeholders, and cost/benefits are described in accordance with the main CL2-model. Figure 3 illustrates the project
life cycle model used in the thesis. The sub-model is considered to be generalizable, although when applied it will have to be adapted onto the evaluated marked and WDRES. The planning phase in the process is often the most time consuming in order to complete an Environmental Impact Assessment and attains all necessary permits in order to start construction of the plant. The majority of the costs occur in the realisation phase, while the project will not generate any revenues until the generation phase. The thesis did not cover the issues of financing projects.
Figure 3: The WDRES life cycle sub-model
• Legislation • Policy • World business cycle • Conflicts
Global
• National economy • GDP, Interest rate, Currency • Political system • Legal system
• Safe? Free of corruption? • Labor force
• Cost of labour, t, Unemployment rate
National
• Production/Consumption • Powerplants • Politics
• Goals, Vision, Support systems • Electricity market
Energy
• RES plants operational • Pipeline • Grid connection • Suitable locations for RES
• Wind, temperature, icing, sunshine etc
Renewable
energy source
11 June 2014
3
Wind power in Finland
Risk assessment
The main driver for the wind power expansion in Finland is the feed-in tariff system. It ensures the producer a premium price of €105.4/MWh until the end of 2015, and from then on the premium is lowered to €83.5/MWh. A wind turbine or park can be included in the system for 12 years, but from then on the revenues are based only on the electricity spot price. The system is in place for up till 2500 MW installed wind power, as of June 2014 only 375 MW has been included in the system. The actual pipeline of projects includes over 8000 MW and the thesis concludes that the feed-in tariff system should be full around 2019. Due to the considerable time to complete a project, assumedly 5-8 years, a market entry between TG1 and TG3 (see figure 3) is preferred in order to be included in the subsidy system. Also, by acquiring already attained permits, a developer avoids risks of a project being shot down early in the process.
Finland do have a wind power target of 9 TWh produced in 2025, even though the current subsidy system only cover 2500 MW (approximately 6 TWh). It is still unclear what will happen with future subsidy schemes, but as of today developers have no incentives to look past the current system.
The wind speeds in Finland are lower than in the Nordic countries, thus decreasing the electricity generation. Finland’s answer to this is both the higher tariff premium, but also the possibility to build higher wind turbines with larger rotors. While i.e. a general Swedish turbine has a max height of approximately 160 m, some turbines to be built in Finland will be over 200 m.
Despite the thesis pro-answer to entering the Finnish wind power market, it also acknowledges several potential threats needed to be assessed further. The previously mentioned risk of not being included in the subsidy scheme is primary, thus investment in so called brownfield projects is recommended. Finland already has strict noise regulations, which are currently being evaluated and is to be presented in early 2015. The stakeholders on the market seem unanimous that the new regulations may be even stricter, which could eliminate several projects in the pipeline.
Finland recently fell into its third recession in only eight years, and this has been a reason for the government to start cutting welfare spending such as child support. This has led to political tensions and with the upcoming 2015 elections the thesis acknowledge that there are easy political points to be made by reducing the feed-in tariff premium to restore other welfare spending.
In conclusion
The CL2-model applied onto wind power in
Finland showed that it could adequately assess a geographical market for a WDRES. Due to only one completed case study its generalizability is difficult to determine, but it is deemed likely to be applicable onto other WDRES as well as similar geographical markets as Finland, for example countries in Northern and Western Europe. The authors suggest further research in order to establish increased generalizability.