Lead time analysis and reduction at
Alfa Laval DC Lund
Nils Wilhelmsson & Erik Dahlberg
Lund UniversityFaculty of Engineering
Department of Industrial Management & Logistics Autumn 2012
Supervisors: Joakim Svensson, Alfa Laval Bertil I Nilsson, LTH
Preface
This master thesis was conducted at the Faculty of Engineering at Lund University during the fall of 2012. It is the last part of our master studies in Mechanical Engineering and Industrial Engineering and Management. The thesis was initiated to provide Alfa Laval DC Lund with a new view of their business and what areas of improvement that could be identified.
A great deal has been learnt during this master thesis in areas such as project managing, ERP systems, computer tools etc. It has been both a challenging and fun experience.
First of all we would like to thank our project group for their input on solutions and high quality information about the business. We would also like to thank the steering committee and other involved personnel at Alfa Laval DC Lund that have been helpful during the project.
We would also like to thank Bertil I Nilsson, our supervisor at Lund University, for guiding us and ensuring the quality of this thesis. Last but not least we want to give a big thank you to Joakim Svensson, our supervisor at Alfa Laval DC Lund, for the extensive amount of time and effort he has put into us and our project.
Lund 2013-01-30 Nils Wilhelmsson Erik Dahlberg
Abstract
Title Lead time analysis and reduction at Alfa Laval DC Lund
Keywords Lead time, ERP (Enterprise Resource Planning) system, Lean
Authors Nils Wilhelmsson - Master of Science in Industrial Engineering and Management
Erik Dahlberg - Master of Science in Mechanical Engineering
Supervisors Joakim Svensson, Lean Six Sigma Black Belt, Alfa Laval Bertil I Nilsson, Adjunct Assistant Professor, Department of Industrial Management and Logistics, Lund University – Faculty of Engineering
Background Alfa Laval DC Lund is both a spare part manufacturer and distributer. The spare parts that Alfa Laval DC Lund supplies are used for the heat transfer business unit of Alfa Laval. Sometimes orders need to be produced fast as customers may have breakdowns in production and sometime orders arrive months earlier than customers want to receive delivery as scheduled services occur at the customer.
Problem A problem today is that the time it takes Alfa Laval DC Lund to produce and send an order to a customer is perceived as too long. It is not known where in the process the majority of time is spent as well as what can be done to reduce it.
Purpose The purpose is to perform a thorough analysis of the lead time for manufacturing orders from that the customer order arrives at Alfa Laval DC Lund to the customers receive delivery.
Objective A solution that will reduce lead time for manufacturing orders should be created and implemented.
Deliverables The project should deliver savings/profit of 5000 euro per year and/or a process improvement of 25%.
Methodology The research has had a systems approach which was helpful to provide a holistic perspective. A combination of a case study
and action research has been used to build a thorough understanding of the business before trying to improve it. Data has been gathered through interviews, observations, literature studies and from measuring processes and extracting data from the ERP system’s database. During the research, emphasis has been on ensuring that reliable and valid data has been used.
Results The production lead time data in Movex was adjusted to better fit the actual production lead time. The result was a decrease in lead time which could be seen directly after implementation.
Conclusion The benefits of the implemented solution will be a 30% decrease in internal lead time when material is available from start and a 10% decrease in internal lead time when material is not available from start. This will in turn generate a total of approximately 14 000 euro per year in savings from less tied up capital and profits from earlier revenue. The analysis has also yielded information that Alfa Laval DC Lund can use to start new projects with the purpose to reduce lead time and/or improve their business.
It has been concluded that human interference with as well as wrong data in the ERP system drives lead times. The research also demonstrates the importance of working with the ERP system and using its features in a correct way instead of working beside and overriding it.
Table of contents
Page
1 Introduction ... 1
1.1 Company background ... 1
1.1.1 Business unit DC Lund ... 1
1.1.2 Products and articles ... 2
1.1.3 Order handling ... 4
1.1.4 Production ... 5
1.2 Change of scope ... 6
1.2.1 Introduction ... 6
1.2.2 Data collection ... 6
1.2.3 Empirics and analysis... 6
1.2.4 Conclusions ... 8 1.3 Problem description ... 8 1.4 Purpose ... 9 1.5 Objective ... 9 1.6 Deliverables ... 9 1.7 Delimitations ... 9 1.8 Chapter overview ... 10 2 Methodology ... 11 2.1 Approach ... 11 2.1.1 Analytical approach ... 11 2.1.2 Systems approach ... 11 2.1.3 Actors approach ... 12 2.1.4 Summary ... 12 2.2 Research method ... 13 2.2.1 Survey ... 13 2.2.2 Case study ... 13 2.2.3 Experiment ... 14
2.2.4 Action research ... 14
2.3 Gathering data ... 15
2.3.1 Quantitative vs. qualitative data ... 15
2.3.2 Techniques ... 15 2.4 Credibility ... 17 2.4.1 Reliability ... 17 2.4.2 Validity ... 17 2.4.3 Representativeness ... 17 2.5 DMAIC method ... 18 2.6 Chosen methodology ... 18 3 Theory ... 21 3.1 Lean... 21 3.1.1 5S ... 21 3.1.2 JIT ... 22 3.1.3 Kanban ... 22 3.1.4 7 wastes ... 23 3.2 Six Sigma ... 23 3.3 Tools ... 24 3.3.1 Process mapping ... 24
3.3.2 Cause and effect analysis ... 24
3.3.3 Root cause analysis ... 25
3.4 Change management ... 25 4 Data collection ... 27 4.1 Introduction ... 27 4.2 Measurements/Data collected ... 27 4.2.1 Planning efficiency ... 27 4.2.2 Capacity ... 28 4.2.3 Scrapped material ... 28 4.2.4 Lead time ... 29
5.1 General analysis ... 31
5.2 Planning efficiency ... 32
5.2.1 Planners absent from planning ... 32
5.2.2 Time to deliver papers to production ... 32
5.2.3 Amount of papers used in production ... 34
5.2.4 Internal DOT for planners ... 35
5.3 Capacity ... 39 5.3.1 Overtime in production ... 39 5.3.2 Capacity in production ... 40 5.4 Scrapped material ... 41 5.5 Lead time ... 42 5.5.1 Data validation ... 42 5.5.2 Measures ... 45 5.5.3 Graphs ... 47
5.5.4 Lead time analysis ... 47
5.5.5 Summary of lead time measurements ... 47
5.6 Summary and chosen focus points ... 52
5.7 Further analysis of waiting time to start when material is available ... 54
5.7.1 Planned waiting time to start production ... 55
5.7.2 Difference in planned and actual production lead time... 59
6 Improvement proposals ... 69
6.1 Introduction ... 69
6.2 Increase production capacity and flexibility ... 69
6.2.1 Action plan ... 70
6.2.2 Potential risks and problems ... 70
6.2.3 Costs and benefits ... 70
6.3 Adjust production lead time data ... 70
6.3.1 Direct improvements ... 71
6.3.2 Continuous improvements ... 71
6.3.4 Costs and benefits ... 73 7 Implementation ... 75 7.1 What to implement ... 75 7.2 How to implement ... 75 7.3 How to evaluate ... 75 8 Results ... 77
9 Conclusions and discussion ... 81
9.1 Scientific contributions ... 81
9.2 Further research ... 82
References ... 87
Appendix A: Lead time analysis ... i
Waiting time before release to production ... i
Waiting time for material to become available ... ix
Waiting time to start when material is available ... xii
Total time from release to start ... xxv
Production time ... xxvii
Waiting time after production ... xxxi
Internal lead time ... xl Total lead time ...xlviii Days too late from CRD ... lii Difference between earliest and latest MO material available date ... lx
Figures
Figure 1-1: Heat exchanger plate with clip-on gasket (Alfa Laval, 2013b). ... 3Figure 1-2: Functional overview of a heat exchanger (Alfa Laval, 2013b). ... 4
Figure 1-3: Manufacturing order process at Alfa Laval DC Lund. ... 5
Figure 1-4: Average amount of MOs with realistic CRD per week... 7
Figure 1-5: Overview of CRD status for all MOs. ... 8
Figure 3-1: Cause and Effect diagram (Bilsel & Lin, 2012). ... 25
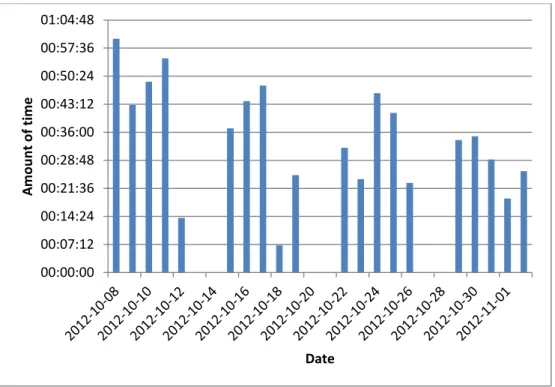
Figure 5-1: The amount of time that planners deliver papers to production each day. ... 33
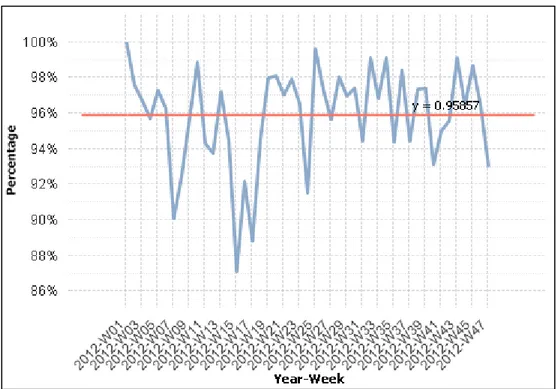
Figure 5-3: Original finish date compared to the actual finish date. ... 36
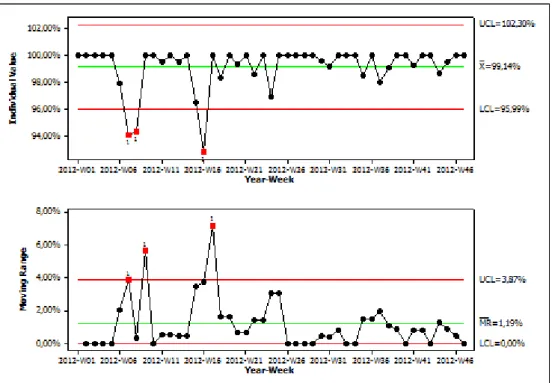
Figure 5-4: Control chart of original finish date compared to the actual finish date. ... 37
Figure 5-5: Planned finish date compared to actual finish date. ... 38
Figure 5-6: Control chart of planned finish date compared to actual finish date. ... 39
Figure 5-7: Overtime worked in production. ... 40
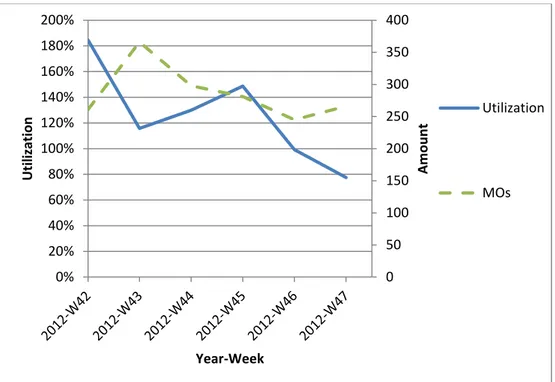
Figure 5-8: Utilization in production in comparison to the amount of MOs manufactured each week. ... 41
Figure 5-9: Amount of scrapping per week. ... 42
Figure 5-10: Histogram of population. ... 43
Figure 5-11: Histogram of selection. ... 44
Figure 5-12: Comparison of population and selection as distribution in a boxplot. There is no dimension on the x-axis, the widths only purpose is to display all values. ... 45
Figure 5-13: Overview of measurements, sizes roughly matching average times with CRD a.s.a.p. Total lead time is 15,1 days. ... 48
Figure 5-14: Overview of measurements, sizes roughly matching average times with CRD a.s.a.p. and material available at CO entry. Total lead time is 8,2 days. 49 Figure 5-15: Overview of measurements, sizes roughly matching average times with CRD a.s.a.p. and material not available at CO entry. Total lead time is 22,8 days. ... 50
Figure 5-16: Overview of the waiting time before and after production, sizes roughly matching average times with CRD a.s.a.p. ... 55
Figure 5-17: Average amount of planned waiting time to start production in days per MO per week. ... 56
Figure 5-18: Distribution of planned waiting time to start production in days rounded to integer. ... 57
Figure 5-19: Boxplot of planned waiting time to start production in days per week. ... 58
Figure 5-20: Average amount of waiting time from planned to actual production start date in days per MO per week. ... 60
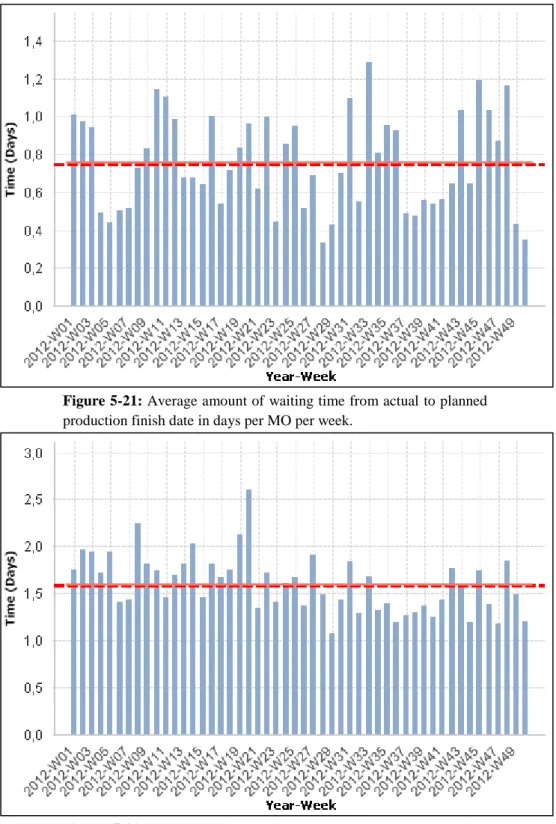
Figure 5-21: Average amount of waiting time from actual to planned production finish date in days per MO per week. ... 61
Figure 5-22: Average difference in planned and actual production lead time in days per MO per week. ... 61
Figure 5-23: Distribution of difference in planned and actual production lead time in days rounded to integer. ... 62
Figure 5-24: Boxplot of difference in planned and actual production lead time in days per week. ... 63
Figure 5-25: Average difference in planned and actual production lead time in days
per MO per week for C10. ... 64
Figure 5-26: Distribution of difference in planned and actual production lead time in days rounded to integer for C10... 65
Figure 5-27: Boxplot of difference in planned and actual production lead time in days per week for C10. ... 66
Figure 6-1: Route departures used for different work centers. ... 72
Figure 8-1: Average difference in planned and actual production lead time in days per MO per week for the general case. ... 77
Figure 8-2: Average difference in planned and actual production lead time in days per MO per week for the X10 work center. ... 78
Figure 8-3: Average difference in planned and actual production lead time in days per MO per week for the R10 work center. ... 79
Figure 8-4: Average difference in planned and actual production lead time in days per MO per week for the C10 work center. ... 80
Figure A-1: Average amount of time in days per MO per week... i
Figure A-2: Distribution of time in days rounded to integer. ... ii
Figure A-3: Boxplot of time in days per week. ... iii
Figure A-4: Average amount of time in days per MO per week... iv
Figure A-5: Distribution of time in days rounded to integer. ... v
Figure A-6: Boxplot of time in days per week. ... vi
Figure A-7: Average amount of time in days per MO per week... vii
Figure A-8: Distribution of time in days rounded to integer. ... viii
Figure A-9: Boxplot of time in days per week. ... ix
Figure A-10: Average amount of time in days per MO per week... x
Figure A-11: Distribution of time in days rounded to integer. ... xi
Figure A-12: Boxplot of time in days per week. ... xii
Figure A-13: Average amount of time in days per MO per week... xiii
Figure A-14: Distribution of time in days rounded to integer. ... xiv
Figure A-15: Boxplot of time in days per week. ... xv
Figure A-16: Average amount of time in days per MO per week... xvi
Figure A-17: Distribution of time in days rounded to integer. ... xvii
Figure A-18: Boxplot of time in days per week. ... xviii
Figure A-19: Average amount of time in days per MO per week... xix
Figure A-20: Distribution of time in days rounded to integer. ... xx
Figure A-21: Boxplot of time in days per week. ... xxi
Figure A-22: Average amount of time in days per MO per week... xxii
Figure A-23: Distribution of time in days rounded to integer. ... xxiii
Figure A-24: Boxplot of time in days per week. ... xxiv
Figure A-26: Distribution of time in days rounded to integer. ... xxvi
Figure A-27: Boxplot of time in days per week. ... xxvii
Figure A-28: Average amount of time in days per MO per week... xxviii
Figure A-29: Distribution of time in days. ... xxix
Figure A-30: Boxplot of time in days per week. ... xxx
Figure A-31: Average amount of time in days per MO per week... xxxi
Figure A-32: Distribution of time in days rounded to integer. ... xxxii
Figure A-33: Boxplot of time in days per week. ... xxxiii
Figure A-34: Average amount of time in days per MO per week... xxxiv
Figure A-35: Distribution of time in days rounded to integer. ... xxxv
Figure A-36: Boxplot of time in days per week. ... xxxvi
Figure A-37: Average amount of time in days per MO per week... xxxvii
Figure A-38: Distribution of time in days rounded to integer. ... xxxviii
Figure A-39: Boxplot of time in days per week. ... xxxix Figure A-40: Average amount of time in days per MO per week... xl Figure A-41: Distribution of time in days rounded to integer. ... xli Figure A-42: Boxplot of time in days per week. ... xlii Figure A-43: Average amount of time in days per MO per week...xliii Figure A-44: Distribution of time in days rounded to integer. ... xliv Figure A-45: Boxplot of time in days per week. ... xlv Figure A-46: Average amount of time in days per MO per week... xlvi Figure A-47: Distribution of time in days rounded to integer. ... xlvii Figure A-48: Boxplot of time in days per week. ...xlviii Figure A-49: Average amount of time in days per MO per week... xlix Figure A-50: Distribution of time in days rounded to integer. ... l Figure A-51: Boxplot of time in days per week. ... li Figure A-52: Average amount of time in days per MO per week... lii Figure A-53: Distribution of time in days rounded to integer. ...liii Figure A-54: Boxplot of time in days per week. ... liv Figure A-55: Average amount of time in days per MO per week... lv Figure A-56: Distribution of time in days rounded to integer. ... lvi Figure A-57: Boxplot of time in days per week. ... lvii Figure A-58: Average amount of time in days per MO per week...lviii Figure A-59: Distribution of time in days rounded to integer. ... lix Figure A-60: Boxplot of time in days per week. ... lx Figure A-61: Average amount of time in days per MO per week... lxi Figure A-62: Distribution of time in days rounded to integer. ... lxii Figure A-63: Boxplot of time in days per week. ...lxiii
Tables
Table 2-1: Gammelgaard’s (2004) summary of Arbnor and Bjerke’s three types of approaches... 13 Table 5-1: Overview of paper usage in production. ... 35 Table 5-2: Statistical comparison of population and selection. ... 43
Acronyms and glossary
A.s.a.p. As soon as possible.
CO A Customer Order contains all articles that customers have ordered as well as other information e.g. request date etc.
CRD Customer Request Date is the date that the customer has
requested delivery of the CO (or part of it).
DC Distribution Center.
ERP system A Enterprise Resource Planning system is a system that keeps track of all information needed in the business such as financial transactions, article database, customer information etc.
Minitab Software for statistical analysis of datasets.
MO A Manufacturing Order is an internal term used for articles that need to be produced or assembled.
Movex ERP system used at all Alfa Laval’s distribution centers. OEE Overall Equipment Effectiveness evaluates and indicates
how effectively a manufacturing operation is utilized.
QlikView Software used to illustrate and analyze data.
SI A Stocked Item is a high runner item which is kept in stock (according to forecasted demand).
WIP Work In Progress is products that are currently in the
1
Introduction
In this chapter an introduction to the report will be made. The company background, problem formulation, purpose and delimitations will be presented which will clarify the outline of the project. A chapter overview will also be included to provide the reader with an overview of the report.
1.1 Company background
Alfa Laval was founded in 1883 by a man named Gustaf de Laval and his partner Oscar Lamm Jr. Since then the company has grown substantially and currently has 16 000 employees worldwide with the majority as well as the headquarters in Lund Sweden. Alfa Laval has customers in nearly 100 countries and they are in a wide range of industries. Alfa Laval is currently the world leader in heat transfer products but the company is also active in two other areas; separation and fluid handling (Alfa Laval, 2013a).
1.1.1 Business unit DC Lund
Alfa Laval DC Lund is both a spare part manufacturer and distributer. The DC was previously located at the headquarters in Lund but it was moved to Staffanstorp where it is currently positioned. The reason it was moved from Lund was that more space was required and the municipality would not give Alfa Laval building permit for the expansion needed. The spare parts that Alfa Laval DC Lund supplies are used for the heat transfer business unit of Alfa Laval.
The operations performed in Staffanstorp are mainly warehousing and a limited amount of production. It works as a distribution center in the traditional sense but products are also manufactured on the same site. The production department is the largest of all production departments at the distribution centers worldwide. In total there are approximately 45 employees at DC Lund.
Movex is used as ERP system in all distribution centers globally although all other facilities use Jeeves. All distribution centers were using Jeeves before as well but it was thought that Movex had better support for warehousing, which is the main function at the DCs, while Jeeves was thought to be better in handling production. As the distribution center supplies spare parts, orders sometimes need to be produced fast as customers may have breakdowns in production. There has been at least one instance where plates have been transported by helicopter to oilrigs in
Norway for this reason. In contrast to this some orders arrive months earlier than customers want to receive delivery as scheduled services are also performed.
1.1.2 Products and articles
As mentioned Alfa Laval DC Lund’s area of business are heat exchangers. To get an understanding of the products and articles they are handling a brief introduction will be made to Alfa Laval’s heat exchanger components. The large majority of the articles handled are plates and gaskets but there are also other articles such as bolts, frames (the blue parts in Figure 1-2), pumps etc. The size of the plates varies from 10x35cm to 120x300cm which demands flexibility in both production and in the warehouse.
In Figure 1-1 a heat exchanger plate can be seen. This particular plate has a glue-less clip-on gasket which means that the gasket is held in place by the black clips that can be seen as black extensions of the gasket at the edges of the plate. The clip-on gaskets are easy and fast to mount. There is also another kind of gasket that is glued in place. The mounting of these gaskets are much more time consuming as glue has to be applied before the gasket can be mounted. After this the plate and gasket needs to go into an oven for several hours for the glue to harden. When the plates have cooled down the gaskets need to be inspected to ensure that the glue has cured and that the gasket is secured. These are the two methods used to mount gaskets on plates.
Figure 1-1: Heat exchanger plate with clip-on gasket (Alfa Laval,
2013b).
The customers are using these plates in their existing heat exchangers when something breaks, at a planned services or when they want to extend the plate package to increase performance of the heat exchanger. The heat exchanger itself can be seen in Figure 1-2. It works by running warm and cool liquid every other plate as seen in the figure. The plates are mounted on hangers and the heat exchanger is held together under a high pressure with large bolts (not shown in the figure).
Figure 1-2: Functional overview of a heat exchanger (Alfa Laval,
2013b).
1.1.3 Order handling
The order handling process starts when Alfa Laval DC Lund receives an order from the end-customer directly or from a sales office. Orders can arrive electronically with EDI (Electronic Data Interchange) or by email, phone, fax etc. When orders arrive by EDI they are automatically entered into Movex but when they arrive in other ways the customer service department has to manually enter then into Movex. If an order that arrives only contains articles that are held in stock, the articles are picked, packed and the order is shipped. If the order contains products (that need to be manufactured) the order process is different as can be seen in Figure 1-3. The parallelograms in the figure represent a registered event in Movex.
Figure 1-3: Manufacturing order process at Alfa Laval DC Lund.
All products and articles are forecasted and the products with high demand are manufactured to stock. This is used so that these products can be picked directly from the warehouse resulting in that customers will not have to wait for the production. For these products MO suggestions are created automatically when the inventory level drops to or below the safety stock.
1.1.4 Production
The production is divided into three work centers; C10, R10 and X10. These work centers are also present in Movex and contains different work operations in production. Different products require different work operations, meaning that all operations in a work center do not have to be performed.
The C10 work center handles punching of article numbers as well as the mounting of the clip-on gaskets to plates. If any other operations are needed the production is carried out in the X10 work center.
In the R10 work center roughening of gaskets is performed. This is performed more and more seldom as development of the products is progressing. Roughening is performed only so that the gaskets attach better to the plate when the gasket should be mounted using glue.
The X10 work center handles all other operations. This includes punching of holes and article numbers, projection welding of hanger reinforcements, spot welding of plate strengtheners (only used on older plates), applying glue, mounting gaskets, putting the plates in the oven as well as inspecting the gaskets after the oven. The hanger reinforcements are projection welded to the end of the plate on each side. In Figure 1-1 it is in the same place as the indentation at each end of the plate, one should however note that this particular plate does not have extra hanger reinforcements welded to it.
MO suggestion automatically
created
MO released
MO entry date & time
CO received
CO entry date & time
MO is printed and delivered to production Picking done Actual start date Production finished and order is put away
Actual finish date
Picked, packed and shipped Production
1.2 Change of scope
1.2.1 Introduction
Initially the project had a scope with the purpose to “Increase the number of orders finished to customer request date by 25%”. However this was not a suitable purpose so it had to be changed. The reasons for this will be presented in this chapter.
1.2.2 Data collection
To be able to make conclusions regarding the fulfillment of CRD, data had to be extracted from Movex. This data was then processed and analyzed in QlikView and Microsoft Excel. In the current system setup it is not possible, in a simple manner, to determine whether a customer request delivery as soon as possible or to a specific date that can be achieved with the current lead time. In order to determine this the production lead time, route departure days as well as transportation time has to be regarded. A function has therefore been created that takes all of these times into consideration and then determines if the CRD is achievable or not. If it is achievable it is regarded as realistic, while if it is not achievable it is regarded as the customer request delivery as soon as possible (a.s.a.p.).
1.2.3 Empirics and analysis
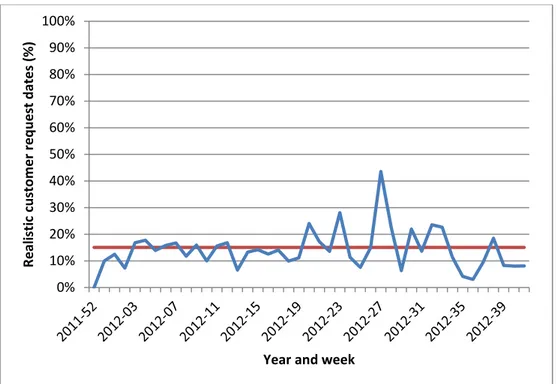
The result of the data collection was conclusive. On average the amount of MOs where the customer has requested delivery a.s.a.p. is 85%. This means that on average only 15% of customers request delivery at a date that is achievable. The variation of realistic CRD over time can be seen in Figure 1-4.
Figure 1-4: Average amount of MOs with realistic CRD per week.
As can be seen in Figure 1-5, CRD is met for 12,4% of all MOs. In comparison to that 15% of all MOs have a realistic CRD this means that only 2,6% of all MOs could be improved. 0% 10% 20% 30% 40% 50% 60% 70% 80% 90% 100% R e al isti c cu sto m e r re q u e st d ate s (% )
Figure 1-5: Overview of CRD status for all MOs.
1.2.4 Conclusions
As mentioned only 2,6% of all MOs on average could be improved within this initial scope of work. It is not economically justifiable to improve such a small amount of the population. A project of this size should have a more ambitious purpose.
Alfa Laval DC Lund’s intentions were to increase customer service and cater to the customers’ needs in a better way. Another scope that would achieve this was therefore desirable. As customers request delivery as soon as possible in 85% of all MOs on average a lead time reduction would therefore be appropriate to increase customer service. The origin of lead time is currently not known. After consulting with management it was decided that an analysis of where the lead time originates from should be made as well as a lead time reduction, if possible within the delimitations of the project.
1.3 Problem description
A problem today is that the time it takes for Alfa Laval DC Lund to produce and send an order to a customer is perceived as too long. It is not known where in the process that the majority of time is spent as well as what can be done to reduce it.
85% 12,4%
2,6%
CRD a.s.a.p.
Realistic and met CRD Realistic and not met CRD
After the initial change of scope it was concluded that on average 2012, 85% of customers request delivery as soon as possible. This is understandable as Alfa Laval DC Lund supplies spare parts. The customer needs could therefore potentially be catered to in a better way if the lead time was decreased. However, to be able to decrease the lead time it is important to obtain an understanding of where in the process the majority of time lies.
1.4 Purpose
The purpose is to perform a thorough analysis of the lead time for manufacturing orders from that the customer order arrives at Alfa Laval DC Lund to the customers theoretically receive delivery (based on predefined transportation/shipment time). The analysis should yield an overview of the lead time and pinpoint areas of improvement potential.
1.5 Objective
A solution that will reduce lead time for manufacturing orders should be created and implemented. After the implementation of this solution further research areas should be identified and presented.
1.6 Deliverables
The project should deliver at least one of the following: Savings/profit of 5000 euro per year
Process improvement of 25%
1.7 Delimitations
To prevent the project from becoming too complex the following delimitations has been made:
The project should focus on manufacturing orders connected with a customer order.
No changes will be made to suppliers or the purchasing department. Customer behavior should not be changed.
No changes should be made to the sales department.
When measuring the lead time the transportation time will not be measured in reality, the time it takes according to Movex data will be used instead. No analysis or modification will be made to physical material handling in
Only internal processes in Alfa Laval DC Lund will be analyzed and changed.
The analysis will be limited to orders placed at Alfa Laval DC Lund.
1.8 Chapter overview
1 Introduction
In this chapter an introduction of the report has been made. The company background, problem formulation, purpose and delimitations have been presented to clarify the outline of the project.
2 Methodology
This chapter will present the research methodology used throughout the project.
3 Theory
The theoretical framework that has been used will be presented in this chapter.
4 Data collection
In this chapter the data that will be collected is going to be described. Why and how the data will be collected will also be described.
5 Empirics and analysis
The data described in chapter 4 Data collection will be presented and analyzed in this chapter. Areas with improvement potential will be distinguished and analyzed further.
6 Improvement proposals
This chapter will include concrete suggestions of improvements that will be made based on the analysis.
7 Implementation
Chosen implementations as well as how to implement and evaluate them will be presented here.
8 Results
In this chapter the results after the implementation will be presented.
9 Conclusions and discussion
Conclusions from the research will be drawn as well as recommendations for further research. Scientific contributions of the research will also be presented.
2
Methodology
This chapter will present the research methodology used throughout the project.
2.1 Approach
Arbnor and Bjerke (2009) defines that there are three types of methodology approaches to research, depending on what the research question is as well as what view the researcher has on reality. They also argue that the view of reality in fact determines how the question is asked and thus how the problem could be solved. The three approaches are the analytical approach, the systems approach and the actors approach. Each one of the approaches will be described in this chapter. Combining the different approaches will not result in a better approach. Arbnor and Bjerke (2009) do however state that it is possible to use one as a base approach and then add complimentary methodical procedures from one of the other approaches. It is although important to be extra careful when this type of complementing is used.
2.1.1 Analytical approach
The perception of reality in the analytical approach is that the “whole” is equal to the sum of its components. This means that when using an analytical approach, it is possible to explain a phenomenon by examining each individual component. The perception is also that any knowledge obtained or created with an analytical approach is independent of the observer (Arbnor & Bjerke, 2009).
As any knowledge obtained is independent of the observer, literate studies are commonly used to a large extent when gathering data in the analytical approach. Gathering data through interviews, surveys, observations and experiments is also common. The data is then analyzed using statistical tools and the objective is to achieve a high level of generalization. A high emphasize on disclosing how and where data were collected, which definitions that were made, etc. is common for this approach (Arbnor & Bjerke, 2009).
2.1.2 Systems approach
In the systems approach, contrary to the analytical approach, the perception of reality is that the “whole” is not equal to the sum of the components. This means that the components themselves cannot be studied individually, as their relations also affect the phenomenon. This means that the whole system needs to be studied to be able to explain or understand a phenomenon (Arbnor & Bjerke, 2009).
Studies performed with a systems approach often gather information from observations and interviews as case studies are a preferred research method. Since real life systems are often quite different from each other, secondary information as gathered using literature studies from another system are handled with care, as the result might not be transferable. Although secondary information within the system being studied is extensively used. Because results are difficult to transfer to other studies, systems approached projects do not strive for a high level of generalization (Arbnor & Bjerke, 2009).
2.1.3 Actors approach
In the actors approach reality is perceived as socially constructed and that humans create reality at the same time as reality creates us. Knowledge is therefore also perceived as socially constructed, meaning that the creation of knowledge depends on the involved individuals as well as the researcher’s own interpretations. To understand a phenomenon, the whole social construction needs to be understood (Arbnor & Bjerke, 2009).
With the actors approach it is most common to gather information through personal interviews or dialogs with the involved individuals. Participative observations are also used to create an understanding. Literature studies are only performed on information that is closely related to the same social construction. And as with the systems approach projects do not strive for a high level of generalization (Arbnor & Bjerke, 2009).
2.1.4 Summary
Gammelgaard’s (2004) summary of Arbnor and Bjerke’s three types of approaches can be seen in Table 2-1.
Table 2-1: Gammelgaard’s (2004) summary of Arbnor and Bjerke’s
three types of approaches.
Analytical approach Systems approach Actors approach Theory type Determining cause-effect
relations. Explanations, predictions. Universal, time and value free laws
Models. Recommendations, normative aspects. Knowledge about concrete systems Interpretations, understanding. Contextual knowledge
Preferred method Quantitative (qualitative research only for validation)
Case studies (qualitative and quantitative)
Qualitative
Unit of analysis Concepts and their relations
Systems: links, feedback mechanisms and boundaries
People – and their interaction
Data analysis Description, hypothesis testing
Mapping, modelling Interpretation
Position of the researcher Outside Preferably outside Inside – as part of the process
2.2 Research method
There are a number of methods on how to perform research. Höst et al. (2006) state that the four most relevant methods, when conducting applied science, are:
Survey Case study Experiment Action research
2.2.1 Survey
Using surveys as a research method is most suitable when the purpose of a project is to describe and or predict how a process or a phenomenon works. Using surveys means that information is gathered from a sample of people from the population, where the result can be applied to the whole population. The information can either be gathered by asking questions directly, by phone or face-to-face, or by sending written questions, by mail or email, to the respondent (Sellstedt, 2002). The advantages of asking questions directly to the respondent are that it is possible to acquire clarifications on answers as well as that the responder is less keen to finish the survey prematurely. The disadvantage however is that it is time consuming. The main advantage with sending written questions is that a larger sample from the population can be targeted. The disadvantage is that it is harder to obtain sufficient precision and depth (Höst, et al., 2006).
2.2.2 Case study
Case studies can also be used when the aim of a project is to reveal areas in need of further research (Gimenez, 2005). Näslund (2002) states that case studies are appropriate when answering “why” and “how” questions.
As case studies are performed at specific cases with specific objectives, the result of the study will most likely not be generalizable. However, for another case with similar conditions the probability of obtaining the same result is large. When performing case studies it is common to use interviews, observations as well as literature studies (Höst, et al., 2006). With these tools a greater knowledge can be obtained then that would be possible from purely using statistical analysis of preformatted questionnaires (Gimenez, 2005).
2.2.3 Experiment
Experiments are a well suited research method when the aim of a project is explanatory, to find causation and explanations of phenomena. Experiment research is as the name implies studies performed by experimenting with parameters and examining their impact on the phenomenon (Höst, et al., 2006). The strength of using experiments is the control the practitioner can have over the different parameters. An issue that can arise when using experiment research is however to what extent the result is applicable to real life situations (Sellstedt, 2002).
2.2.4 Action research
When the purpose of a project is to improve something while studying it, action research is well suited. Performing action research is an iterative process; the situation or phenomenon is observed to enlighten which problems that should be solved, solutions are developed and implemented and the solution is then evaluated. The process should then be iterated until the situation or phenomenon is functioning satisfactory (Höst, et al., 2006). Collaboration between the researcher and members of the studied system is an important characteristic of action research as the research should be interactive (Müller, 2005).
Näslund (2002) states that action research is an appropriate method when handling real world problems encountered in supply chain management.
A potential problem with action research is the high extent that the researcher is involved in the process and thus becoming impartial (Bichou & Gray, 2005). This can however be countered by setting up clear criteria for the evaluation. External controllers can also be used to ensure a valid and reliable result (Höst, et al., 2006).
2.3 Gathering data
Gathered data can be either quantitative or qualitative, which type that should be gathered depends on the specific situation. By which technique the data should be gathered also depends on the situation, as will be presented below.
2.3.1 Quantitative vs. qualitative data
Quantitative data consists of data that can be measured and classified, such as amounts, proportions, times, etc. Quantitative data can be processed using statistical analysis, for example by using boxplots and or histograms. When analyzing quantitative data it is very important to investigate if the data contains incorrect values, so that these do not mislead the result. Qualitative data on the other hand consists of descriptions rich in detail that cannot be simply measured. Analysis of qualitative data should be based on encoding, sorting and categorizing the gathered data (Höst, et al., 2006).
Höst et al. (2006) state that gathering a combination of qualitative and quantitative data is appropriate for problems which involve humans and their actions.
2.3.2 Techniques
In this chapter information on gathering data by using interviews, observations, literature studies and measurements will be presented.
Interviews
Interviews are a way of systematically questioning relevant personnel on a particular subject. Interviews are often divided into three different types; structured, semi-structured and unstructured. The type of interview that should be used depends on the purpose. Structured interviews consist of predefined questions that are asked in a specific order and are used when the purpose of the interview is to describe the phenomenon. Semi-structured interviews consist of some predefined questions as well as some open questions. Semi-structured interviews are useful when the purpose is more explanatory. Unstructured interviews consist of some questions to support and help the interviewer to manage the interview, but are to a large extent open for the interviewee to control. Unstructured interviews are convenient to use when the purpose of the interview is to get an exploratory understanding (Höst, et al., 2006).
Observations
An observation means that an event is studied and the findings are noted. The observer can either be participating in the studied event or not. Participation creates
a greater knowledge and trust for what is being observed, there is however a risk of losing the objectiveness. The opposite applies to observers that do not participate, they have a objectiveness but may not fully understand the observed event. Observers also have the option whether or not to tell the observed personnel that they are being observed. If the observer is exposed there is a risk that this will affect the observed phenomenon. Personnel may work different if they know that they are being observed then they normally do. Having the personnel unaware of that they are being observed may on the other hand raise ethical issues (Höst, et al., 2006).
Literature study
To be able to ensure that the project has a stable scientific base, a literature study should be made. A literature study will also assist the researcher as there is no need to start completely from scratch and thus avoiding mistakes that others have encountered in previous research. It is also important to perform a literature study to understand the subject in question before tackling it head on in real life (Höst, et al., 2006).
The intention of making a literature study is thus to determine how far existing research has come, to avoid repetition and to bring science forward.
Measurements
Performing a measurement means that a number or a term is associated to attributes which describe a phenomenon. A measurement can be either direct or indirect. Direct measurements means that the value that is being measured can be read instantaneous, for example measuring the length of something. Indirect measurement is measurements where more than one attribute is measured and then combined, for example to measure speed both the traveled distance as well as the time it took is required (Höst, et al., 2006).
When measurements are performed by more than one person or at more than one occasion, it is very important that the measurement is thoroughly defined. If the definition is vague there is a risk of incoherent results. The time it takes to perform something can for example be measured in a number of different ways leading to completely different results (Höst, et al., 2006).
When analyzing the result of a measurement it is important to understand the potential errors that may exist in the data. The data can contain large errors (such as typing or reading errors), systematic errors (reoccurring errors that could be caused
by interference to the measurement instruments) as well as temporary errors (random variations in the proximity of the actual value) (Höst, et al., 2006).
2.4 Credibility
It is important that drawn conclusions from research are well substantiated and that the right phenomenon has been studied. It is also preferred that the results are generalizable. This chapter will therefore further describe reliability, validity and representativeness.
2.4.1 Reliability
The reliability of gathered data and analyses are of great significance when performing research. It is important to be thorough when gathering data as well as when performing analyses. One way of ensuring that reliable data is being used is to involve and obtain coworkers opinions. Results or observations from interviews can also be discussed with the interviewed party to ensure that he or she has not been misinterpreted (Höst, et al., 2006).
2.4.2 Validity
It is important that the correct phenomenon is being measured to ensure validity. There need to be a connection between what is supposed to be measured and what actually is being measured. A method called triangulation can be used to get a clearer perception of the phenomenon. Triangulation means that data should by gathering by using different methods and thus seeing the phenomenon from different angles. When performing research during a long time period there is a risk of neglecting daily problem areas which in turn may threaten the validity. In these cases a third-party reviewer can be helpful to reduce this risk (Höst, et al., 2006).
2.4.3 Representativeness
Having generalizable results from research would be ideal. Researchers should thus aim for obtaining results that have a high representativeness. For surveys and experiments it is therefore important not to have a too high loss in data, or that losses are especially high in a specific category of the population. Case studies and action research will most probably not be generalizable, but the result can fit a similar case very well. It is therefore important to provide a thorough and detailed description of the studied case to increase the representativeness (Höst, et al., 2006).
2.5 DMAIC method
The DMAIC method can be described as a structured approach for solving problems (de Mast & Lokkerbol, 2012) (George, et al., 2004). The name DMAIC is taken from the first letter in each step in the methodology; Define, Measure, Analyze, Improve and Control. The methodology originates from Six Sigma and is according to George et al. (2004) widely used in businesses. de Mast & Lokkerbol (2012) states that DMAIC is suitable for extensive and complex projects while it is less suitable for projects with a smaller scope. The five steps in DMAIC will now be briefly described:
Define
The major parts in the define step is to define the projects purpose, objectives, delimitations and deliverables (George, et al., 2004).
Measure
A thorough understanding of how the processes work should be achieved in the measure step so that potential causes can be identified. A measurement plan should then be developed and data should be collected on the current processes (George, et al., 2004).
Analyze
After the data have been collected it should be analyzed to verify that the causes found in the previous step actually affect the process. This step is also known as “Finding the critical X’s” (George, et al., 2004).
Improve
In the improve step potential solutions to the problem should be developed and optimized. The best solution should then be implemented (George, et al., 2004).
Control
The control step has the purpose of verifying that the implemented solution is satisfactory as well as that the improvement is sustained (George, et al., 2004).
2.6 Chosen methodology
Throughout this project the DMAIC method will be used. The methodological approach in this report will be a systems approach, where the “whole” is not equal to the sum of its components, as their relations are of importance as well. The systems approach will help to provide a holistic view during the project. A combination of case study and action research will be used as the research method.
Initially the research will start off with a case study to build a thorough understanding of the business and processes. After this has been achieved the focus will be altered to improving the process while observing it. This means that the research method will be changed into action research.
Qualitative data in form of interviews with involved personnel, observations and a literature study will be gathered in combination with quantitative data in form of measuring processes and extracting data from the ERP system’s (Movex) database. The interviews that will be conducted will be semi-structured to obtain an explanation and understanding of the process. Observations will be non-participating in nature and all observed parties will be informed before the observation. All data that will be collected through measurements will be verified by coworkers as well as by the supervisor at Alfa Laval DC Lund to ensure reliability. Data collected during both interviews and observations will be discussed and confirmed with relevant personnel for the same reason. To ensure validity, different methods of gathering data will be used in order to observe the phenomenon from different angles. The supervisor from Lund University will also review the research for ensuring validity. As the research will be carried out using both the case study as well as the action research method, it will not possible to obtain a generalizable result. The case will therefore be thoroughly described so that it hopefully can be applied to a similar situation.
3
Theory
In this chapter the theoretical framework that has been used will be presented.
3.1 Lean
As Alfa Laval is a company that tries to apply lean thinking to its business it is important to be familiar with the lean terminology and the way of thinking. Lean has its roots in the car manufacturer Toyota and the Toyota Production System (TPS). In the 1980’s it was discovered that Toyota was a high performing company in many ways. Toyota was producing cars of high quality at a competitive cost. The company was more profitable than its competition and removed their weaknesses effectively. The development of the cars was also fast. The success Toyota had and still has have been built on an excellent company culture that has become known as lean. There are several tools that facilitate the implementation of lean, some of which will be presented below, but this is just the tip of the iceberg (Liker, 2004). According to Liker (2004) lean is a company culture more than tools that are applied. Lean manufacturing can be seen as a five step process; defining customer value, defining the value stream, making it “flow”, “pulling” from the customer and back and striving for excellence. This in combination with a culture in which everyone is striving for continuous improvements are considered to be lean (Liker, 2004).
Wang (2011) views lean more as a waste reduction philosophy that should use less human effort, manufacturing space, investment in tools, and engineering time to develop a new product. Some literature are focusing on that lean is the reduction of waste for example Wang (2011). This is a part of lean but this is however not a new concept. Henry Ford was for example an aggressive champion for waste reduction (Hopp & Spearman, 2004). Hopp & Spearman (2004) define lean in terms of factory physics as “Production of goods or services is lean if it is accomplished with minimal buffering costs.”.
It is evident that the view of lean is different from author to author but these definitions provide an understanding of what lean is.
3.1.1 5S
The purpose with 5S is to improve the workplace organization and standardization (Wang, 2011). It is used to maintain an organized, clean, safe and high performing workplace (George, et al., 2004). It can and should be applied both in the office
and in production (Bicheno, 2004). The idea is that if everything is in order abnormal behavior can be spotted faster (George, et al., 2004). An example of this could be car production, if the shop floor is clean a car that is leaking oil will be spotted faster than if the floor was dirty. The 5S are Sort, Set in order, Shine, Standardize and Sustain and are defined as the following (Bicheno, 2004) (George, et al., 2004) (Wang, 2011):
Sort: All items that are not used should be removed.
Set in order: Arrange and organize tools, materials etc. so that it is placed where it is needed and in a specific place.
Shine: Make sure that the work space is clean.
Standardize: Create a consistent way of performing operations. Sustain: Make sure that 5S is sustained.
3.1.2 JIT
JIT stands for Just In Time and is a large part of lean. The thought with JIT is that everything should arrive where it should at the right time, not earlier, not later. It would for example be better if suppliers deliver products directly when they are needed. This would in turn render inventory useless which is desirable. JIT is as lean not a tool itself but a philosophy how the business should be conducted (Hopp & Spearman, 2004).
3.1.3 Kanban
Kanban is a tool that facilitates the implementation of JIT. The idea is when something is demanded a kanban card is sent downstream in the production “pulling” the item precisely when it is needed. Pull ultimately represents the demand from the customer, a product is not produced before a customer demands it. There are several benefits with pull, for instance (Hopp & Spearman, 2004):
Reduced Work In Progress (WIP) and cycle time
o As products cannot enter production before they are needed the WIP will decrease. Kanban effectively creates a WIP cap.
Smoother production flow
o Variability in WIP will decrease and this in turn reduces variability in output.
Improved quality
o The pressure to improve quality increases as the quality of both products and processes become more important because defects will impact the production more.
Reduced cost
3.1.4 7 wastes
The reduction of waste is a central part of lean. Toyota has identified seven major types of non-value adding activities, waste, in business. They are as follows (Liker, 2004):
Overproduction
o Production of items for which there are no orders. Waiting
o Workers waiting for a process, waiting for inventory to become available etc.
Unnecessary transport or conveyance o The moving of inventory or WIP. Overprocessing or incorrect processing
o Could be unneeded process steps or when higher quality then needed is created.
Excess inventory
o Excess of raw material or WIP. Unnecessary movement
o Workers should have to move as little as possible to reach tools, parts, material etc.
Defects
o Production of parts that have defects that in turn needs to be repaired, scrapped etc.
There is also an eighth waste that is unused employee creativity. Many ideas for improvement can come from employees and it is a waste not to engage or listen to them and take advantage of their input (Liker, 2004).
3.2 Six Sigma
Six Sigma has focus on two main areas; quality assurance and benchmarking. It has traditionally had a strong emphasis on statistical methods (Truscott, 2003) (de Mast & Lokkerbol, 2012). It focuses on continuous improvement of processes regarding both efficiency and effectiveness. Six Sigma aims at providing a universal measure of process performance where a higher sigma indicates a better result. Sigma represents the standard deviation of a normally distributed distribution. A one sigma process indicates that the process is successful in 30,85% of all cases (if it is normally distributed). A six (6) sigma process represents a process that succeeds in 99,99966% of all cases which in turn represent 3,4 defects per million opportunities (DPMO). Six sigma is considered to be a world class process
although most companies are thought to operate around 2-4 sigma (69,146-99,379%) (Truscott, 2003).
3.3 Tools
In this chapter the theory behind the tools that will be used is going to be presented. These tools have been chosen to step by step identify and solve problem areas as they are proven to be effective for this (Lambert, 2008) (Oakland, 2004) (George, et al., 2004).
3.3.1 Process mapping
Process mapping and analysis is a powerful tool in helping companies become more competitive (Baker & Maddux, 2005). Process mapping could also help companies to develop their strategies (Gardner & Cooper, 2003). However one critical success factor of process mapping is important to remember. This is that functional process mapping should be performed. The reason that cross-functional process mapping is so important is that processes could be sub optimized otherwise. Cross-functional process mapping will facilitate companies in seeing the broader perspective of its processes (Lambert, 2008).
Lambert (2008) presents one example to demonstrate the importance of cross-functional process mapping is a manufacturer of consumer goods in USA. This manufacturer implemented a system that would reduce their lead time to retailers to between 24 and 48 hours anywhere in the United States. This would in turn mean that the retailers could hold less inventory reducing the tied up capital and therefore increasing the profitability of the products, making them more attractive. However after a few years the manufacturer had not seen the decrease in retailer’s inventory. The reason that this had not been seen was because the sales department had incentives in place that promoted purchasing of large volumes. This example highlights the importance of cross-functional process mapping as this could have been avoided if the business would have its processes aligned (Lambert, 2008).
3.3.2 Cause and effect analysis
When problems occur it is desirable to determine what has caused the problem. A useful tool when determining what has impact on a specific problem is a cause and effect analysis. To perform a cause and effect analysis a so called Ishikawa Cause and Effect (CE) Diagram or Fishbone diagram, as it is also called, can be used (Oakland, 2004) (Bilsel & Lin, 2012). An example of this diagram can be seen in Figure 3-1.
Figure 3-1: Cause and Effect diagram (Bilsel & Lin, 2012).
Potential causes should be found by brainstorming (Oakland, 2004) (Bilsel & Lin, 2012). The primary causes should be connected to the “bone” in the center. Each primary cause then has secondary causes which in turn have more causes connected. The root cause can be found this way (Bilsel & Lin, 2012) or root cause analysis could be performed on for example the secondary causes (George, et al., 2004).
3.3.3 Root cause analysis
Root cause analysis can be used to get to the bottom of a problem, i.e. find the root cause of the problem. There is a simple yet effective method to do this called 5 Why. The method is simply to ask the question why until the root cause is found (George, et al., 2004) (Bicheno, 2004). It could be both more or fewer than five times but in Toyotas experience, who is the inventor of 5 Why, five times is often the amount of times the question has to asked to find the root cause. This is thought to be one of the reasons that Toyota has an edge on quality, reliability and productivity. When they encounter a problem the do not only solve the obvious problem, they find the root cause to why it arose in the first place and change it (Bicheno, 2004).
3.4 Change management
When changes are imminent resistance to change should be expected as it in most cases occurs. Management should be prepared to handle this by having an understanding of the change that is going to happen and be prepared to answer questions and reassure the personnel that the change will work. Change should not be forced, if staff thinks the change is exciting it will be much easier to perform.
The staff could even help the change by making improvement suggestions and sharing their knowledge (Oakland, 2004).
There are six important activities when implementing change and they are (Merrell, 2012): Leading Communicating Learning Measuring Involving Sustaining
It is important that management has a strategy regarding change as well as support from top management. Good communication is also important to ensure that there is an understanding of the imminent change and what is about to happen. A fundamental step is that the employees learn how to perform their new tasks. This could yield feedback on the implementation suggestion pushing it in the right direction. To make sure that the change has worked as intended, clear measurements should be introduced. This is also useful after the change to make sure that the process that has been changed does not fall back to the way it was before. It is important that the measurements start before the change so a base line can be established. To reduce or avoid resistance to change completely, the staff/customers or others affected by the change should be involved. Last but not least it is important to make sure that the change is sustained. This can be done by making sure that the process does not go back to the way it was before. To indicate if this is happening measurements of the changing process could for example be used as mentioned before (Merrell, 2012).
4
Data collection
In this chapter the data that will be collected is going to be described. Why and how the data will be collected will also be described.
4.1 Introduction
To be able to identify what data that need to be collected a cause and effect analysis of why the lead time is long has been performed. The causes that were identified were then analyzed further using the 5 why method to find the root causes. The identified root causes were in turn examined to be able to determine which data that are needed in order to analyze what drives the lead time. A measurement plan was then created to get an overview of all measurements that are going to be performed.
To be able to get an understanding of the business that Alfa Laval DC Lund conducts, a series of interviews and observations have been performed apart from the data collection. In excess of 30 interviews have been carried out with employees, ranging from department managers to production staff, from all departments on site. Observations have mainly been focused on the planning process and the production but also customer service to some extent.
4.2 Measurements/Data collected
The measurements that will be performed as well as why and how they should be performed will be specified further in this chapter. To be able to ensure consistency throughout all measurements clear instructions on how to measure have been created. All data collected from Movex will also be thoroughly examined and validated for this reason.
4.2.1 Planning efficiency
One potential root cause identified to why the lead times are long was that the production planning could be inefficient. To get a better insight into the planning process several measurements will be performed:
Data will be collected on how much time that is spent on production planning. This will be measured by letting the production planners register the time they are absent from the planning for other tasks.
The amount of time that the planners spend on delivering papers to production will also be measured. This will be measured by letting the planners register when they leave to deliver papers to production as well as
when they return. By measuring this, an estimation of the actual time required to perform production planning can be made.
The amount of papers that is printed by the production planners and then delivered and used in production will be estimated by calculating the average amount of papers used per MO for a large number of MOs and then multiplying this with the amount of MOs produced during 2012. This will be measured to get an overview of potential waste connected to production planning.
To be able to evaluate how effective the production planning is the amount of times that production have finish a MO after the planned finish date will be collected. This will be done by extracting data from Movex on planned and actual finish dates and comparing these using QlikView and Minitab.
4.2.2 Capacity
Another potential root cause to long lead times that was found was that the capacity in production was constrained. It is however only possible to calculate the capacity utilization as well as the overall equipment effectiveness (OEE) in production on live data. To get an appreciation of OEE and how the capacity has been utilized in the past, overtime worked in production as well as the amount of temporary staff that has been used will therefore be collected.
The amount of worked overtime will be collected from human resources for the personnel that work in production. The amount of temporary staff used will be collected from the work schedule.
To calculate the OEE and capacity utilization in production data will be collected on how many hours that are put into production as well as how many hours that are performed in production, according to Movex. The data for the amount of hours that are put into production will be collected from the work schedule while the data on how much that is been performed in production will be collected from the database. The result of the calculated utilization is also in a way a measurement of how well the data in Movex correlates to the actual process.
4.2.3 Scrapped material
Scrapping of material in production was identified as a potential root cause to long lead times. If material is damaged in connection to production there is a potential risk of delaying MOs, which increases the time it takes customers to receive delivery. Data will therefore be collected from the database on how often scraping is made in the warehouse.