ECOLOGICAL TECHNOLOGY AND MANAGEMENT KALMAR, SWEDEN, September 22-24, 1999
31
THE IMPORTANCE OF POLLUTIONAL
LOADS DURING WET WEATHER
Oddvar Georg Lindholm
University of Agriculture of Norway, Norway
Lars Aaby
Miljo- ogfluidteknikk, Norway
ABSTRACTWet weather discharges consist mainly of washed out surface pollution in separate sewered areas, but in combined sewered areas; resuspended pipe deposits, surface washoff and sewage, discharging via combined sewer overflows (CSOs). Of the three mentioned sources, resuspended pipe solids is dominating over the other two and may contribute as much as 50 to 90 % of the total amount of the CSO. The CSO in a normal catchment may also on an annual bases be of the same amount, or even twice as much as the effluent from the wastewater treatment plant (WWTP). If the receiving waters are vulnerable to shock loads on a daily base, it is important to be aware that the amount of CSO might, at its most adverse be up to I 00 times more than the effluent from the WWTP during a day. The annual discharge via CSOs in a catchment may easily vary with a factor of up to 8 from the driest to the wettest year, during time series of 20 to 40 years.
KEYWORDS
Combined sewer overflows, wet weather discharges, the relative importance, pollution
INTRODUCTION
The problems of discharge of sanitary wastewater are well acknowledged. However the importance of the wet weather discharges is not very well appreciated everywhere. Not only represents combined sewer overflows, included resuspended pipe deposits, and storm runoff in separate systems considerable amounts on an annual bases. When a recipient is vulnerable to shock loads of pollution on a daily or weekly basis, the importance of wet weather pollutional loads are of paramount interest.
Oddvar Lindholm, Norway 271
ECOLOGICAL TECHNOLOGY AND MANAGEMENT KALMAR, SWEDEN, September 22-24, 1999
SPECIFIC PRODUCTION PER PERSON AND DAY IN DRY WEATHER
Table I shows the recommended productions (g/pers and day) for a person being I 00 % of the time in home, for pupils/students and employees. (SFT 1996).
The data are average for the Norwegian population in 1995. The production from men versus women is on an average significantly different as well as for different age groups. Table I . Kecommended spec1t1c production ,er person m Norway. (SrT 1996)
Parameter From homes if Employee (on job) Pupil/student (in school)
100% of time at (g/pers and day) (g/pers and day) home (g/p day)
Phosphorus 1,6 0,62 0,45
Nitro2en 12 4 3,2
BOD1 46 12 10
COD 94 24 15,5
It is interesting to note that (Neergaard Jacobsen, B.1995) the EU-countries have very different specific productions pr. person, shown in table 2.
Table 2. Specific production pr. person in some EU-countries and Norway (N) (Neergaard Jacobsen, B.1995) :g Pipers and day)
DK F D GR I L UK A N
Tot.P
-
3-4 2,5 2-2,5 2-3 2,5-
2 1,6BODs 60 50-70 60 50-60 54-60 60 60 60 40
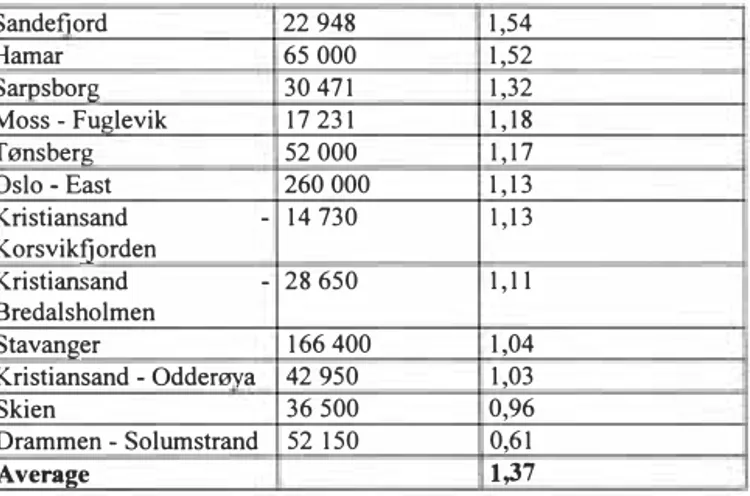
The difference reflects that it might not only be the food pattern and way of living that varies from country to country, but it might also be that the knowledge of the real numbers is not good enough. Table 3 shows average inflow in 1994 pr. person and day of phosphorus for the 18 biggest chemical precipitation treatment plants in Norway (WWTP), (SFT 1996). The standard of living and way of living are nor very different in those 18 cities. So the big difference between them is rather puzzling.
Table 3. Intl f phosoh N treatment plants
City Connected Gram P / day and
persons person Oslo West, Ba:rum, 380 000 2,21 Asker Moss-Kambo 15 450 2,00 Grimstad I I 800 1,71 Arendal 28 000 1,70 F redrikstad 71 090 1,64 Drammen - Mus0Ya 18 040 1,59
ECOLOGICAL TECHNOLOGY AND MANAGEMENT KALMAR, SWEDEN, September 22-24, 1999
Sandefiord 22 948 1,54 Hamar 65 000 1,52 Sarosborg 30 471 1,32 Moss -Fuglevik 17 231 1,18 T0nsberg 52 000 1,17 Oslo -East 260 000 I , 13 Kristiansand - 14 730 I , 13 Korsvikfjorden Kristiansand - 28 650 1,11 Bredalsholmen Stavanger 166 400 1,04 Kristiansand - Oddemva 42 950 1,03 Skien 36 500 0,96 Drammen - Solumstrand 52 150 0,61 Averaee 1,37
From table 3 one may see that the lowest number is only 0,61 and the highest 2,21. The average is 1,37 and the standard deviation is 0,4 g P/person and day. From table I it is seen that the best documented average P-production in Norway is 1,6 g P/p and day. The authorities also recommend this. Those cities having more than 1,8 must have a significant degree of industry. However 50 % of the cities have less than 1,2 which is 25% less than the average production of 1,6 g P/p and day. Four cities, or 22%, have less than 2/3 of the normal production. This fact tells a tale of great losses in the combined sewer overflows CSOs. Other explanations of these big differences could be losses through pump stations, direct illegal discharges to recipients and leakages to the ground water. However these other possibilities are less likely to explain the differences than varying CSOs.
VARIATIONS OF RAINFALL FROM YEAR TO YEAR
Table 4 shows that when one wants to establish numbers on the annual discharge of overflow via the combined sewer overflows, either by measuring during a certain year or by simulating some certain years in a computer, the result will be very influenced what year or years one chooses. The table shows for instance that in the same CSO, 579 m3/ha will discharge in 1976, while 2838 m3/ha might have discharged in 1985. In an average year 1585 m3/ha may discharge through the CSO. This reveals that during the time serie of only 19 years of rainfall, the difference of the amount of CSO varies with a factor of nearly 5 from the driest to the wettest year.
273 Oddvar Lindholm, Norway
579
ECOLOGICAL TECHNOLOGY AND MANAGEMENT KALMAR. SWEDEN. September 22-24, 1999
Tabel 4. Volume of stonn runoff in Oslo (m3/ha) that falls with an intensity greater than the
f the overflow at 10 1/s and ha. (Lindh
196 196197197 197197 197 197 197 197 197 197 198 198 198 198 198 198 198[AVER
8 9 0 I 2 3
14
5ki
7 8�
Kl
I 12 314
5 6 AGE143 102 200106ki82 103 171 162 110 12312001228 1091206 185 126 I Q83 183 1585
6 7 5 7 12
k5
ki
2 8k5
I 814
8k5
8 6Harremoes 1988, has reported even greater variances of CSO from year to year in a combined sewer network. Calculations with the SAMBA-model of Tot. P discharged as CSO for 44 years annually from 1936 to 1979, shows a difference of a factor of ca. 7 from the smallest to the greatest CSO-outlet per year.
DISCHARGES FROM CSO AND PIPE DEPOSITS IN TERMS OF KGa/ HA YEAR In this article the focus is put on showing examples of measured loads of COD and Tot. P from different sources during wet weather. To have a reference for all the numbers, the following table 5 shows annual discharges from wastewater treatment plants. It is assumed that the daily production is 120 g COD/p and 2,0 g Tot. P/p, and a removal efficiency at the WWTP of90% for COD and 95 % removal efficiency at the WWTP for Tot. P. The table show that a WWTP serving an area with I 00 pers/ha discharge 438 kg COD/year.
Table 5 Annual loads (effluent) from WWTPs in kg/ha. Discharge of COD kg/ha year
1 50 pers / ha I I 00 pers / ha
657 438
These amounts of annual discharges from the WWTPs should be kept in mind, when reading the examples of loads due to wet weather in this article. Isolated examples may also be checked with the summary table 9, to get references to a more complete set of examples and averages.
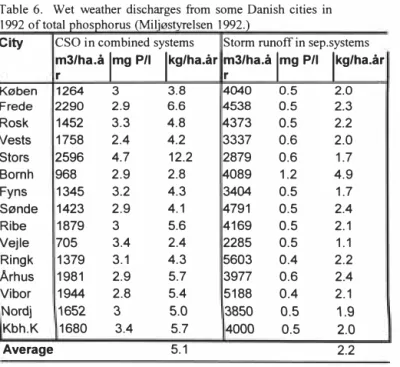
Table 6 shows official data from the Environmental Protection Agency in Denmark on discharge of phosphorus. The discharges are due to rainfall, and the data shows that the average discharge of Tot. P via CSOs was 5, I kg P in 1992. This consists of both stonn runoff from surfaces, diluted sewage and resuspended pipe deposits. If one assumes that I 0 % of this is diluted sewage, as Beichert 1996 and Hogland et al. 1984 found, and that 50 % of the surface pollution and pipe deposits discharge via the CSOs, then the total amount of P in the surface runoff and resuspended pipe deposits was ca. 9,2 kg/ha. If the surfaces in the separate systems are roughly generating the same amount pr. year in both systems, namely 2,2 kg/ha in 1992, then we get the conclusion that 9,2 - 2,2 = 7 kg P/ha and year were generated from pipe deposits in the combined sewered cities shown. That means that
274 Oddvar Lindholm, Norway
ers/ha-95% rem. eff.
� �
4.7
5.4
ECOLOGICAL TECHNOLOGY AND MANAGEMENT KALMAR, SWEDEN, September 22-24, 1999
3,2 times as much P are generated from resuspended pipe deposits that this from surfaces in those Danish cities. This is of course a very uncertain and crude analysis, but the probability of it is supported by other investigations. It could be argued that an assumption of 50% of the wet weather generated pollution during a year discharges via the overflows, is too much. Then one must remember that we are not talking ofm3 of water, but pollution
loads, which may be very high during the biggest rain events in a year. The scouring of pipe deposits is proportional to the velocity of water in square.
Table 6. Wet weather discharges from some Danish cities in
1992 of total phosphorus (Milj0styrelsen 1992.)
City CSO in combined systems Storm runoff in sep.systems
3/ha_a 1mg P/1 lkg/ha.ar 3/ha.a 1mg P/1 lkg/ha.ar K0ben 1264 3 3.8 4040 0.5 2.0 Frede 2290 2.9
6.6
4538 0.5 2.3 Rosk1452
3.3
4.8
4373
0.5
2.2
[Vests1758
2.4
4.2
3337
0.6
2.0
Stars2596
12.2
2879
0.6
1.7
Bomh968
2.9
2.8
4089
1.2
4.9
Fyns1345
3.2
4.3
3404
0.5
1.7
S0nde1423
2.9
4.1
4791
0.5
2.4
Ribe1879
3
5.6
4169
0.5
2.1
Vejle705
3.4
2.4
2285
0.5
1.1
Ringk1379
3.1
4.3
5603
0.4
2.2
Arhus1981
2.9
5.7
3977
0.6
2.4
[Vibor1944
2.8
5188
0.4
2.1
Nordj1652
3
5.0
3850
0.5
1.9 Kbh.K1680
3.4
5.7
4000
0.5
2.0
Average5.1
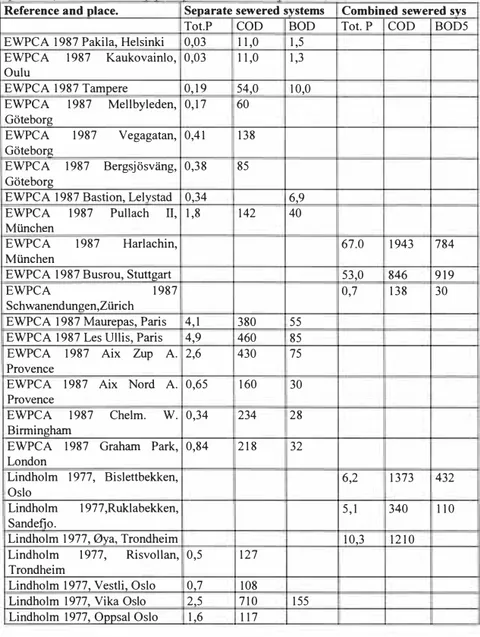
2.2Table 7 shows some annual loadings from separate systems, from combined systems and discharged via CSOs. These data are found in several references.
ECOLOGICAL TECHNOLOGY AND MANAGEMENT KALMAR, SWEDEN, September 22-24, 1999
Table 7. Annual loadings (kg/ ha) caused by wet weather in separate and combined
systems. (Hom nusnea our pipe aeposns ana surtace po11uuonJ
Reference and place. Separate sewered systems Combined sewered svs
Tot.P COD BOD Tot. P COD BOD5
EWPCA 1987 Pakila, Helsinki 0,03 11,0 1,5
EWPCA 1987 Kaukovainlo, 0,03 11,0 1,3 Oulu EWPCA 1987 Tampere 0, 19 54,0 I 0,0 EWPCA 1987 Mellbyleden, 0,17 60 Goteborg EWPCA 1987 Vegagatan, 0,41 138 Goteborg EWPCA 1987 Bergsjosvang, 0,38 85 Goteborg
EWPCA 1987 Bastion, Lelystad 0,34 6,9
EWPCA 1987 Pullach II, 1,8 142 40
Miinchen
EWPCA 1987 Harlachin, 67.0 1943 784
Miinchen
EWPCA 1987 Busrou, Stuttgart 53,0 846 9 I 9
EWPCA 1987 0,7 138 30
Schwanendungen,Zilrich
EWPCA 1987 Maurepas, Paris 4,1 380 55
EWPCA 1987 Les Ullis, Paris 4,9 460 85
EWPCA 1987 Aix Zup A. 2,6 430 75
Provence
EWPCA 1987 Aix Nord A. 0,65 160 30
Provence
EWPCA 1987 Chelm. W. 0,34 234 28
Birmingham
EWPCA 1987 Graham Park, 0,84 218 32
London
Lindholm 1977, Bislettbekken, 6,2 1373 432
Oslo
Lindholm 1977,Ruklabekken, 5,1 340 110
Sandetio.
Lindholm 1977, 0ya, Trondheim 10,3 1210
Lindholm 1977, Risvollan, 0,5 127
Trondheim
Lindholm 1977, Vestli, Oslo 0,7 108
Lindholm 1977, Vika Oslo 2,5 710 155
Lindholm 1977, Oppsal Oslo 1,6 117
Oddvar Lindholm, Norway
773
4,0
ECOLOGICAL TECHNOLOGY AND MANAGEMENT KALMAR, SWEDEN, September 22-24, I 999
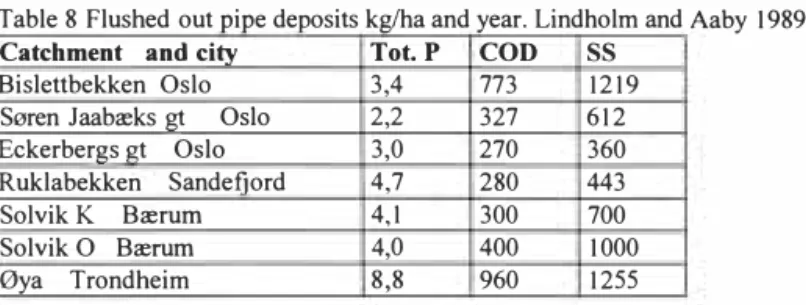
To obtain data for flushed out pipe deposits during a year in the Norwegian projects, the following procedure has been used. For each event the mean dry weather flow has been subtracted. The rest is pipe deposits and surface pollution. During the project, surface runoff pollution has been measured inn 4 separate sewered catchments of near similar character as those of the catchments with combined sewer systems. Hence the measured concentrations in the surface runoff is subtracted. The rest will then be flushed out pipe deposits. The result of this procedure is shown in table 8. The catchment 0ya in Trondheim is relatively flat with an average slope of 1 m per 1 OOm.
Table 8 Flushed out pipe deposits kg/ha and year. Lindholm and Aaby 1989. Catchment and city Tot. P COD
ss
Bislettbekken Oslo 3,4 1219
S0ren Jaaba:ks gt Oslo 2,2 327 612 Eckerbergs gt Oslo 3,0 270 360 Ruklabekken Sandefiord 4,7 280 443
SolvikK Ba:rum 4,1 300 700
Solvik O Ba:rum 400 1000
0ya Trondheim 8,8 960 1255
REVIEW OF THE ESSENCE IN SEVERAL RELEVANT PROJECTS CONCERNING PIPE DEPOSITS AND ITS DISCHARGE INTO CSOs Beichert et al 1996, reports from a certain catchment with 11500 inhabitants in the city of Braunschweig that the annual load of COD (737 kg/ha and year) from resuspended pipe deposits and biofilm on the pipe walls is 3 times higher than the annual load from the wash out of surfaces. The catchment having a pipe length of 12, I km and an average slope of 1,3 ml I OOOm. Beichert also states that in an average discharge of SS via CSOs during rain, 67 % originates from flushed out pipe deposits, 24 % from surfaces and 9 % from diluted sewage.
Brombach et al 1992, found in the city of Bad Mergentheim that the average amount of pipe deposits on 7 locations was 4925 g of dry matter/m of pipe. If one reason that this sludge contain 1,5 % of phosphorus, it means that 74 g TOT.P is found per meter of this type of pipes. This is ca. 8 % of the annual production from one person. Brombach also found that the biofilm attached to the pipe walls represented about 1% of the pollution in the pipe deposits. Aaby 1989 found that the biofilm could represent from 1% to IO % of the amount of Tot. P and COD found in pipe deposits.
Pisano et al 1979, made very extensive measurements of pipe sediments in USA, and found that 20-30 % of all settleable solids in the annual amount of sewage, do settle in the pipe network, and are flushed out during wet weather. He also found that for 3000 pipelines
ECOLOGICAL TECHNOLOGY AND MANAGEMENT KALMAR, SWEDEN, September 22-24, 1999
from manhole to manhole, about 17 % of these sewer lines contained ca. 75 % of the sewer solids.
Berlamont et al 1984, found that 35 % of the organic matter do settle during the year on the pipe bottom, and are flushed out during wet weather.
Broeker 1984, states that in the sewer network in the inner parts of Hamburg, 20- 40 % of the pipe volume are filled up with sludge.
Lavallee et al 1984, found that the share of the normal sewage diluted into the volume discharging in CSO's during wet weather is negligible compared to the share from flushed out pipe deposits and pollution from surfaces.
Hogland et al 1984, did find in the city of Lund that 80-90 % of the organic matter and total phosphorus in the annual amount of CSOs did come from resuspended pipe deposits.
OVERVIEW OF SOME REPORTED WET WEATHER DISCHARGES OF PHOSPHORUS
Table 9 shows a summary of some projects found in the literature. Annual loads from surface pollution in separate systems and pipe deposits in combined systems flushed out annually as well as total discharge into CSOs are shown. The different loads reported from combined sewer systems are not varying as much as the numbers for surface pollution from separate sewer systems. The great variations reveal that each catchment characteristics are of decisive importance. That is factors like population density, degree of impervious surfaces, slopes in the pipe network, activities in the catchment, hydrological and meteorological conditions during the monitoring period, maintenance and condition of the sewer system etc. Figure I illustrates the variation of reported data, as well as the annually effluent of phosphorus from a WWTP. One sees readily that the contribution from wet weather often may exceed the annual load from the WWTP. The annual discharge from a WWTP serving 100 persons/ha with a removal efficiency of95 % is 3,6 kg/ha. The relative shares of the CSO and surface pollution, compared to the annual total discharge are very dependent on the population density in the catchment and the removal efficiency of the WWTP.
ECOLOGICAL TECHNOLOGY AND MANAGEMENT KALMAR, SWEDEN, September 22-24, 1 999
Table 9. Summary of some wet weather discharges of Tot. P. (kg/ha year)
REFERENCE Separate sewer svstems Combined sewer systems Low Hi!lh Aver. Comment Low High Aver. Comment
Ellis,J . B . 1 993 VAV 1 994 0.5 4.9 1 .8 Imp.surf. 1 .2 CSO discharge 2.2 8.8 4.1 Imp. surf. Milj0stvrelsen 1 990 Finland 0.03 0 . 1 9 0.08 Sweden 0 . 1 7 0.38 0.32 Netherlands 0.34 France 0.65 4.9 3 U . K. 0.36 0.84 0.6 UNESCO 1 987 0.2 2.2 4 8
Milj0styrelsen 1 992 1 . 1 4.9 2.2 15 catchm. 2.4 1 2.2 5.1 15 catchm.
Pipe deposits and surface poll.
Germany 53 67 2 catcm.
Lindholm 1 977
Norway 0.5 1 .6 0.9 5 catchm. 5 . 1 1 0. 3 7.2
Lindholm Aaby 1 989 Pipe deposits
Norwav 2.2 8.8 4.3 7 catchm. 9 KG P/HA YEAR 8 7 Its 6 ... WWTP-1 50 plha 5 4 �-1 00 plha Snow dumps Fig. I. Summary from some projects on fluxes of phosphorus during wet weather,
compared to the eflluent from WWTP (Annual discharge of Tot.aPakg/ha.)
DISCARG E FROM CSO
ECOLOGICAL TECHNOLOGY AND MANAGEMENT KALMAR, SWEDEN, September 22-24, 1999
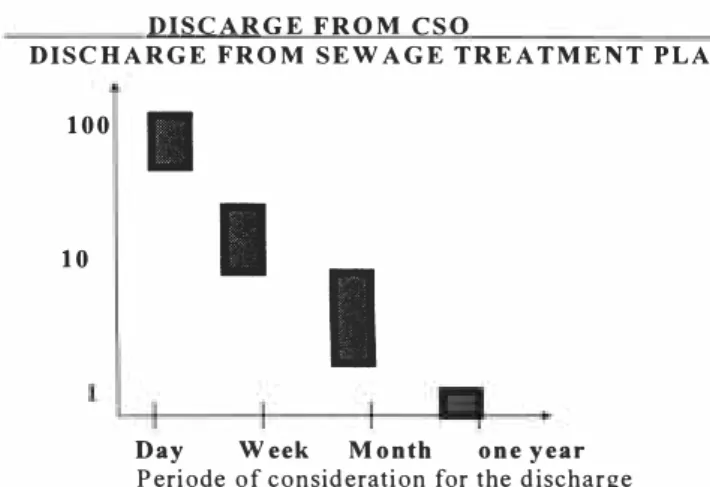
Figure 2 shows roughly the contribution from a CSO in a catchment during a certain time period compared to the contribution from the WWTP during the same period. One may see that even compared on an annual basis, the CSO contribution is of the same order as that coming from the WWTP. However if the recipient is vulnerable for daily shock loads the CSO discharge may be as high as 1 00 times the daily load from the WWTP.
DISCHARGE FROM SEW A G E TREATMENT PLANT 100
I
10
I
I
Day W eek M onth one year
Periode of consideration for the discharge
Fig. 2. Discharge of pollution from a combined storm overflow, compared to discharge from a waste water treatment plant with 90 % removal efficiency.
CONCLUSION
The annual amount of wet weather discharges varies considerably from catchment to cathchment, from year to year and from project to project. This fact is well established when looking at the results shown in this paper. When looking at parameters like organic matter or phosphorus in the storm runoff from surfaces, it is however recognised that the annual amount of this usually is of less importance than the effluent from a WWTP. If one, on the other hand looks at the CSO, the contribution even on an annual bases may be very considerable, and if looking at time spans of a day or week, the CSO may be several times that from the WWTP in the same period.
Oddvar Lindholm, Norway 280
ECOLOGICAL TECHNOLOGY AND MANAGEMENT KALMAR, SWEDEN, September 22-24, 1999
LITTERA TURE.
Beichert,J. et al. ( 1996) Suitability and limits of pollutant transport simulations at the example of a flat combined sewer system. 7.th ICUSD Hannover 1996.
Berlamont,J., Smits,M. (1984) The overflow frequency as a criterion for the design of Combined Sewer Systems. Proc. Third int. conf. On Urban Storm Drainage. Gothenburg Broeker,H. W. ( 1984) Impact of deposition on sewer operation. Proc. Third int. conf. On Urban Storm Drainage. Gothenburg 1984.
Brombach,H., Michelbach,St. og W0hrle,Chr. (1992) Sedimentations- und Remobilisierungsvorgange im Abwasserkanal. Bad Mergentheim feb. 1992.
Ellis,J .B. ( 1993) Pollution of Stormwater and Combined Waste water. ATV-workshop i Munchen mai 1993.
European Waste Water Group. (1995) Storrnwater pollution control systems in EU member states. Study contract B4-3040/93/293/JS/B I May 1995.
EWPCA (1987) Status report I 987. The Technical Subcommitee on Urban Runoff Quality Data. The European Water Pollution Control Association.
Gent,R., Crabtree, B. And Ashley, R. ( 1995) Implementation of sewer sediments research for sewer flow quality models in the U.K. Int. conf. On Sewer Solids. 5-8 Sept. 1995. Univ. of Dundee.
Harremoes, P. ( I 988) Stochastic models for estimation of extreme pollution from urban runoff. Water Research vol. 22,1017-1026.
DOI: https://doi.org/10.1016/0043-1354(88)90149-2
Hogland,W., Bemdtsson,R., Larson,M. (1984) Estimation of quality and pollution load of combined sewer overflow discharge. Proc. Third int. conf. On Urban Storm Drainage. Gothenburg 1984.
Lavelle,P., Lessard,P, Villeneuve,J.P. (1984) Water qualtity variations due to combined sewer overflows. Proc. Third int. conf. On Urban Storm Drainage. Gothenburg 1984. Lindholm, 0. (1977) Forurensninger i overvann" PRA nr.7 NIVA
Lindholm, 0. (1988) Nedb0rdata for avl0psberegninger VAR-utvalget. 78/88 Oslo . Lindholm, 0., Aaby,L. (1 989) In-pipe flushing and its implication for overflow quality. Pergamon Press Oxford 1989.
ECOLOGICAL TECHNOLOGY AND MANAGEMENT KALMAR, SWEDEN, September 22-24, 1 999
Malmquist,P.A., Svensson,G. og Fjellstrnm,C. (1994) Dagvattnets sammansetning. VA V. Milj0styrelsen. ( 1990) Regulering af forurening fra af10bssystemer under regn Kbn.hvn Milj0styrelsen. ( 1992) Renseanlegg, regnvannsbetingede udl0p og spredt bebyggelse". Milj0styrelsen. ( 1995) Punktkilder 1994. Kbn.hvn
Ministry of Housing, Physical planning and Environment. ( 1991) Final report of the 1982- 1 989 N WR W research programme. Netherlands June 1991.
Neergaard Jacobsen.B. ( I 995) The Comparability of Quantitative Data on Waste Water Collection. EWPCA Report to EU April 1995.
Pisano,W.C.. Aronson,G.1.,Querios,C.S. (1979) Dry weather deposition and flushing for combined sewer overflow. EPA 600/2-79 133 Ohio, USA 1979.
SFT ( 1996) Forurensningsregnskap for avl0pssektoren. Rapport nr. 96: 1 9. VA V. ( I 994) Dagvattnets samansetning. Stockholm. Rapport nr. 11 1994.
Aaby,L. ( 1 989) Forurensninger i overl0p. NTNF's VAR-utvalg. Rapport 90/88 Oslo Aaby;L. ( 1989) Forurensningstransporter i avl0pssystemet under nedb0r. VANN 4/89
Oddvar Lindholm, Norway