Detection and identification of
information presented
peripherally inside the car
Effects of driving task demands, stimulus position
and direction of motion of the stimulus
Torbjörn Falkmer, Lena Nilsson and Jan Törnros
VTI r
appor
VTI rapport 461A · 2000
Detection and identification of information
presen-ted peripherally inside the car – effects of driving
task demands, stimulus position, and direction of
motion of the stimulus
Publisher: Publication:
VTI rapport 461A
Published:
2000
Project code:
40315
S-581 95 Linköping Sweden Project: Detection and identification of information
presented peripherally inside the car – effects of dri-ving task demands, stimulus position, and direction of motion of the stimulus
Author: Sponsor:
Torbjörn Falkmer, Lena Nilsson and Jan Törnros The Swedish Transport and Communications Research Board (KFB)
Title:
Detection and identification of information presented peripherally inside the car – effects of driving task demands, stimulus position, and direction of motion of the stimulus
Abstract
The aim was to study the performance of an in-car information system relying exclusively on information presented peripherally by “running light” stimuli. The information was presented on displays placed in four different positions; upper, lower, to the right, and to the left. Four different directions of the “running light” were used; upwards, downwards, to the right, and to the left. Two levels regarding driving task demands were used.
Thirty-two subjects participated in the study. A repeated-measures design was used. The study was performed in an advanced driving simulator. The subjects’ task was to report the direction of motion of the peripheral stimuli as quickly as possible.
A traffic situation with high demands on the driver caused the subjects to fixate the peripheral stimulus to a lesser extent than when the driving task was less demanding. The upper display was fixated to a smaller extent than the left or the right one. However, differences in number of fixations between the displays appeared only when the demands of the driving task were high, not when they were low. No effects of the direction of motion of the stimulus on the number of fixations appeared.
There were very few errors regarding the identification of the direction of the stimulus, regard-less of whether the stimulus was fixated or not.
The response times were short. There were differences between display positions. The response time was shortest for the right display and for the lower display, but somewhat longer for the other two displays. It was somewhat shorter when the stimulus was fixated than when it was not. Driving task demands had no effect on response time. Regarding effects of the direction of motion of the stimulus, there was only a very weak interaction with driving task demands and display position.
Conclusions: Information presented peripherally in the field of vision by moving stimuli can be acquired quickly and correctly without fixation of the stimuli. An information system using this method of presenting information appears promising. Of the four display positions, the lower one seems to be preferable. It can be expected, however, that it will be more difficult to acquire the presented information under certain ambient light conditions, such as bright sunshine.
ISSN: Language: No. of pages:
Utgivare: Publikation:
VTI rapport 461A
Utgivningsår:
2000
Projektnummer:
40315
581 95 Linköping Projektnamn:
Inhämtande av rörlig visuell information presenterad perifert i bilen. Effekter på uppmärksamhetsfördelning och körprestation i varierad trafikmiljö
Författare: Uppdragsgivare:
Torbjörn Falkmer, Lena Nilsson och Jan Törnros KFB
Titel:
Detection and identification of information presented peripherally inside the car – effects of driving task demands, stimulus position, and direction of motion of the stimulus
Referat
Syftet var att studera funktionen hos ett informationssystem som enbart använder sig av visuell information, presenterad perifert i synfältet med hjälp av ”rinnande ljus” i bilen. Informationen pre-senterades på displayer i fyra olika positioner; upptill, nedtill, till höger och till vänster. Fyra olika riktningar hos det “rinnande ljuset” användes; uppåt, nedåt, åt höger, och åt vänster. Två nivåer be-träffande kravet hos köruppgiften användes.
Trettiotvå försökspersoner deltog i studien. Designen var upprepad mätning. Studien genom-fördes med hjälp av en avancerad körsimulator. Försökspersonernas uppgift var att så snabbt som möjligt rapportera rörelseriktningen hos de perifera stimuli som presenterades.
En krävande köruppgift fick försökspersonerna att fixera perifert stimulus i mindre utsträckning än då köruppgiften var mindre krävande. Den övre displayen fixerades i mindre utsträckning än den vänstra och högra. Skillnader mellan displayer beträffande antal fixationer förelåg dock endast för den krävande köruppgiften, ej vid den mindre krävande. Däremot erhölls ingen effekt av stimu-lus’ rörelseriktning på antalet fixationer.
Mycket få fel registrerades beträffande identifieringen av stimulus’ rörelseriktning oavsett om stimulus fixerades eller ej.
Svarstiderna var genomgående korta. Det förelåg en skillnad mellan displaypositioner. Svars-tiden var kortast för den högra och för den nedre displayen, men något längre för den övre och den vänstra displayen. Den var något längre då stimulus fixerades än när detta ej var fallet. Ingen effekt av de skilda kraven hos köruppgiften förelåg beträffande svarstider. Vad gäller effekter av stimu-lus’ rörelseriktning förelåg endast en mycket svag interaktion med köruppgiftens krav och display-position.
Slutsatser: Information presenterad perifert i synfältet med hjälp av av rörliga stimuli går att in-hämta snabbt och med stor säkerhet utan att stimuli behöver fixeras. Ett informationssystem som använder denna metod för att presentera information tycks ha förutsättningar att fungera utmärkt. Av de fyra använda displaypositionerna ter sig den nedre vara att föredra. Emellertid kan man för-vänta sig att det blir svårare att inhämta den presenterade informationen vid besvärliga ljusför-hållanden såsom i starkt solsken.
ISSN: Språk: Antal sidor:
Preface
The authors are most grateful to the test subjects, without whom the study would have been impossible. We are also indebted to our colleagues Maria Berlin, Leif Lantto, Håkan Jansson, Beatrice Söderström, Helén Djurberg, Harry Sörensen, and Roland Östergren, who assisted in planning and realising the study, and to Mats Lidström, who took and edited the photos. Torbjörn Falkmer and Benny Nilsen (Körkort Handikapp, Lernia) ran the experimental trials. Jan Törnros and Torbjörn Falkmer analysed the data. Jan Törnros wrote the report and Gunilla Sjöberg edited it.
The study was financed by KFB (the Swedish Transport and Communications Research Board).
Contents Page
Definitions 1 Sammanfattning 3 Summary 5 1 Introduction 7 2 Method 9 2.1 Subjects 9 2.2 Driving simulator 9 2.3 Scenario 92.4 Displays and presented information 10
2.5 Driving task 12
2.6 Experimental design 13
2.7 Eye movement recording 14
2.8 Dependent variables 15
2.9 Data analysis 16
2.10 Procedure 16
3 Results 17
3.1 Fixations of peripheral moving stimulus 17
3.2 Correct identifications of direction of motion of
peripheral stimulus 18
3.3 Correct identifications of direction of motion of
peripheral stimulus with respect to fixation of the stimulus 20 3.4 Response time for correct identification of direction
of motion of peripheral stimulus 20
3.5 Response time for correct identification of direction of motion of peripheral stimulus with respect to
fixation of the stimulus 23
3.6 Self-reported workload 23
4 Discussion 24
5 References 26
Appendix 1 Random orders
Appendix 2 Random orders for combinations of display position and direction of motion of a stimulus
Appendix 3 Average numbers and proportions of fixation of a stimulus
Appendix 4 Average numbers and proportions of correct identification of direction of motion of a stimulus
Appendix 5 Incorrect identification of direction of motion of a stimulus
Appendix 6 Average response time(s) for correct identification of direction of motion of a stimulus
Definitions
Foveal and peripheral vision
The visual system consists of two subsystems, foveal and peripheral vision. The foveal vision is restricted to a visual angle of approximately 1º around the fixation point. It provides the driver with high-resolution information, which supports capabilities such as recognition (Samuelsson & Nilsson, 1996). The peripheral vision enables the driver to detect changes in contrast and movements, but with decreased visual acuity. The peripheral vision supports capabilities such as the driver’s spatial orientation, but without the driver being fully conscious of this process (Leibowitz, 1986). These two systems operate simultaneously and are dependent on each other.
Inhämtande av rörlig visuell information presenterad perifert i bilen. Effek-ter på uppmärksamhetsfördelning och körprestation i varierad trafikmiljö
av Torbjörn Falkmer, Lena Nilsson och Jan Törnros Statens väg- och transportforskningsinstitut (VTI) 581 95 Linköping
Sammanfattning
Studien behandlar möjligheten att använda informationssystem som enbart an-vänder sig av visuell information som presenteras perifert med hjälp av rörliga (”rinnande ljus”) stimuli i bilen. Ett syfte var att studera i vilken utsträckning så-dan information påverkar foveal uppmärksamhet under olika betingelser. Ett annat syfte var att studera om informationsinhämtningen påverkas av de krav som kör-uppgiften ställer. Ett tredje syfte var att studera om positionen och riktningen hos perifert stimulus har betydelse i detta avseende.
Informationen presenterades på displayer i fyra olika positioner; upptill, nedtill, till vänster, och till höger. Vinkeln mellan siktlinjen och var och en av de fyra displayerna hölls konstant. Fyra olika rörelseriktningar hos det ”rinnande ljuset” förekom. Två betingelser beträffande kravet hos köruppgiften användes, en med högt och en med lågt krav.
Trettiotvå försökspersoner – 16 män och 16 kvinnor, samtliga erfarna bilförare – deltog i studien. Designen var upprepad mätning. Studien genomfördes med hjälp av en avancerad körsimulator. Försökspersonernas uppgift var att så snabbt som möjligt rapportera rörelseriktningen hos de perifera stimuli.
Det visade sig att högt krav från köruppgiften fick försökspersonerna att fixera perifert stimulus i mindre utsträckning än då kravet från köruppgiften var lågt (47,2% jämfört med 61,1%).
Det förelåg även skillnader mellan displaypositioner. Den övre displayen fixe-rades i mindre utsträckning än den vänstra och högra (48,8% jämfört med 59,2% och 57,6%), medan antalet fixationer av den nedre displayen ej var signifikant skilt från övriga (51,0%). Vid jämförelse mellan stimuluspositioner för de två be-tingelserna beträffande köruppgiftens krav på föraren förelåg en skillnad endast vid höga krav; en parvis jämförelse var signifikant, den mellan den övre och den högra displayen (40,2% respektive 53,9%). Däremot erhölls ingen effekt av sti-mulus’ rörelseriktning på antalet fixationer.
Mycket få fel registrerades beträffande identifieringen av stimulus rörelse-riktning. Andelen korrekta svar varierade mellan 97,7% och 99,6% för de fyra displayerna. Andelen korrekta svar var lika stor oavsett om man fixerat stimulus eller ej.
För svarstiden hos korrekta reaktioner förelåg en skillnad mellan display-positioner. Den var kortast för den högra (1,07 s.) och för den nedre displayen (1,08 s.), men något längre för den övre (1,19 s.) och den vänstra displayen (1,20 s.). Den var något längre då stimulus fixerades än när detta ej var fallet. Ingen effekt av de skilda kraven hos köruppgiften förelåg beträffande svarstider. Vad gäller effekter av stimulus’ rörelseriktning på svarstider förelåg endast en mycket svag interaktion med köruppgiftens krav och displayposition.
Slutsatser: Information presenterad perifert i synfältet med hjälp av av rörliga stimuli går att inhämta snabbt och med stor säkerhet utan att stimuli behöver
fixe-4 VTI rapport 461A
ras. Ett informationssystem som använder denna metod för att presentera infor-mation tycks ha förutsättningar att fungera utmärkt. Av de fyra använda display-positionerna ter sig den nedre vara att föredra. Emellertid kan man förvänta sig att det blir svårare att inhämta den presenterade informationen vid besvärliga ljusförhållanden såsom i starkt solsken.
Detection and identification of information presented peripherally inside the car – effects of driving task demands, stimulus position, and direction of motion of the stimulus
by Torbjörn Falkmer, Lena Nilsson and Jan Törnros
Swedish National Road and Transport Research Institute (VTI) SE-581 95 Linköping Sweden
Summary
The issue concerned the possibility of using in-car information systems relying exclusively on visual information presented peripherally by moving (“running light”) stimuli. One of the aims was to analyse the extent to which such informa-tion affects foveal atteninforma-tion under different condiinforma-tions.
Another aim was to study whether the demands imposed by the driving task affect information acquisition. A third aim was to study whether the position and motion of the peripheral stimulus would be of importance in this respect.
The information was presented on displays placed in four different peripheral positions; upper, lower, to the left, and to the right. The angle between the line of sight and each of the four displays was held constant. There were four different directions of motion of the “running light” stimulus. Two conditions regarding driving task demands were used, one high and one low.
Thirty-two subjects – 16 men and 16 women, all experienced drivers – partici-pated in the study. A repeated-measures design was used. The study was per-formed in an advanced driving simulator. The subjects’ task was to report the direction of motion of the peripheral stimuli as quickly as possible.
It was found that a traffic situation imposing high demands on the driver caused the subjects to fixate the peripheral stimulus to a smaller extent than when the driving task was less demanding (47.2% compared to 61.1%).
There were also differences between display positions. The upper one was fixated to a lesser extent than the left or the right one (48.8% compared to 59.2% and 57.6% respectively), with the lower display not significantly different from any of the other positions (51.0%). When comparing stimulus positions under the two different demand conditions, a difference appeared only in the high demand condition; one pairwise comparison was significant, between the upper and the right display (40.2% and 53.9% respectively). No effects of the direction of motion of the stimulus on the number of fixations appeared.
There were very few errors regarding the identification of the direction of the stimulus. The correct response rate varied from 97.7% to 99.6% for the four displays. The correct response rate was the same regardless of whether the stimu-lus had been fixated or not.
In regard to response time for correct identification, there were differences be-tween display positions. Response time was shortest for the right display (1.07 s.) and for the lower display (1.08 s.), but longer for the upper (1.19 s.) and the left display (1.20 s.). The response time was somewhat shorter when the stimulus was fixated than when it was not. Driving task demands had no effect on response time. Regarding effects of the direction of motion of the stimulus on response times, there was only a very weak interaction with driving task demands and display position.
6 VTI rapport 461A
Conclusions: Information presented peripherally in the field of vision by moving stimuli can be acquired quickly and correctly without fixation of the sti-muli. An information system using this method of presenting information appears promising. Of the four display positions, the lower one seems to be preferable. It can be expected, however, that it will be more difficult to acquire the presented information under certain ambient light conditions such as bright sunshine.
1 Introduction
New in-car information systems are being developed and introduced, highlighting the issue of information acquisition by the driver. Knowledge of how to design these systems for quick and reliable detection and interpretation of the presented information is required in order to avoid negative effects on safety and comfort.
Most support systems present visual information, relying on foveal vision. Peripheral vision is used to a very small extent for acquisition of in-car infor-mation, and it is of interest to investigate whether peripheral vision might be a resource that could be put to greater use.
The present study is based on the results from a previous driving simulator study by Nilsson, Falkmer & Samuelsson (1998, 2000), which aimed at deter-mining whether car drivers have the capacity to acquire information presented peripherally in the car without fixating it.
The subjects were instructed not to move their foveal vision to the peripheral stimulus, i.e. to avoid fixating the stimulus. The study showed that the subjects did in fact comply with the instruction, i.e. they were capable of inhibiting their natural tendency to move foveal vision to the peripheral stimulus when instructed to do so. However, the accuracy of the acquisition of information via peripheral vision was influenced by the type of stimulus (stationary or moving), position of the display presenting the information (the displays were placed 3 cm apart from each other in a central position at the uppermost part of the windshield), and by driving speed (110 km/h and 90 km/h). A substantially larger percentage of the in-formation was incorrectly identified with a stationary stimulus (the letter T pre-sented correctly or upside down) than with a moving stimulus (a “running light”, either to the left or the right). Information provided by a stationary stimulus was generally correctly identified more often when presented more centrally than somewhat further out in the vertical peripheral field of view. Contrary to this, the information provided by a moving stimulus was almost always correctly identi-fied, irrespective of display position. Higher driving speed was associated with a reduced percentage of correct identifications. Varying demands of the driving task (speed and distance control) did not, however, have any effect on the accuracy of information acquisition.
The speed of information acquisition via peripheral vision was influenced only by the type of stimulus; response times were longer with a stationary stimulus than with a moving stimulus. Display position, driving speed or varying demands of the driving task did not influence the speed of information acquisition.
In view of the promising results obtained with peripheral presentation of infor-mation with the aid of moving stimuli, it was decided to use only this method of providing information to the driver in the present study.
The previous study did not indicate the extent to which peripherally presented information would trigger the natural response to fixate the stimulus. The subjects in the present study, on the contrary, were allowed to acquire the presented in-formation in a freely chosen manner, i.e. via foveal or peripheral vision. It was hypothesised that by increasing the demands of the driving task, the subjects would pay more attention to the traffic environment ahead and would conse-quently have to rely more on peripheral vision for acquiring the information presented by the peripheral stimulus (Ikeda & Takeuchi, 1975; Williams, 1982, 1985; Miura, 1985). This experimental variation might also have effects on the accuracy and/or the speed of information acquisition.
8 VTI rapport 461A
A second issue consisted of determining whether the position of the peripheral display presenting the information would have an impact on information acqui-sition. Four different positions were selected (within practical limits for in-car applications); an upper position, a lower position, to the right, and to the left. A literature survey by Samuelsson & Nilsson (1996) indicated that the angle be-tween the line of sight and the position of the stimulus has an effect – the smaller the angle, the better the information acquisition. However, it was decided that this angle would be held constant for the different display positions. It was thus hypo-thesised that no differences between positions with respect to information acqui-sition would appear.
The effects of the direction of motion of the peripheral stimulus were also investigated. Four different directions were compared; upwards, downwards, to the left, and to the right. It was not hypothesised that any effects of this experi-mental variation would appear.
The visual task was basically the task used by Nilsson, Falkmer & Samuelsson (1998, 2000), i.e. a discrimination task, where the direction of motion of the peripheral stimulus was to be identified. A practical in-car application might con-cern designing a route guidance system (Alm & Berlin, 1997), which uses peripherally presented information to tell the driver which direction to take. The most relevant effect measure of this discrimination task as a measure of the quality of information acquisition is the correctness of the identifications, although the response times for the identifications are also relevant.
To sum up, the main objective of the present study was to study the extent to which drivers fixate the peripherally presented stimulus when they have a free choice to do so, and the quality of information acquisition under these circum-stances. Effects of three independent variables – driving task demands, position of the peripheral stimulus, and the direction of motion of the peripheral stimulus – on fixations of the peripheral stimulus and on information acquisition, were further objectives of the study.
It was also of interest to determine whether the correctness of identifications and/or response times for identifications were related to whether the subjects fixated the peripheral stimulus or not. Finally, subjective effects of the driving task demands were investigated. It was hypothesised that the rated workload would be greater under high driving task demands.
2 Method
2.1 Subjects
Thirty-two subjects, sixteen men and sixteen women, aged 22 to 60 years, parti-cipated in the study. Their average age was 36.3 years (standard deviation = 11 years). They had held their driving licences for at least five years and their annual driving distances exceeded 10,000 km.
None of the subjects wore eyeglasses. The reason behind this requirement was the use of an eye movement recorder (see below), which only performs correctly when the subject does not wear glasses.
2.2 Driving
simulator
The VTI car driving simulator was used (Nordmark, 1990; Nordmark et al, 1986; Nilsson, 1993). The simulator has a moving base system, a wide-angle visual system, a vibration-generating system, and a sound system, all of which are controlled to interact in a way that gives the driver an impression very similar to real driving (Törnros, Harms & Alm, 1997). A temperature-regulating system is also fitted.
The noise, infrasound and vibration levels inside the car corresponded to those of a modern passenger car. The temperature inside the car cabin was +20°C. The car mock-up used in the present experiment was a front wheel drive Volvo 850 with automatic gearbox. The ambient light conditions could be characterised as those of dusk or dawn.
2.3 Scenario
Road
The same rural road as in a previous study (Nilsson, Falkmer & Samuelsson, 1998) was used. This had one driving lane in each direction. The road width was 7 m with a 1 m shoulder on each side. The total distance driven was 80 km and was divided into four identical 20 km routes.
The road had smooth vertical and horizontal curves. The pavement had a high friction and corresponded to dry summer conditions.
The posted speed limit was 90 km/h.
Traffic conditions – driving task demands
On two of the four 20 km test routes, the subject was instructed to perform a car following task. The leading car varied its speed in a sine wave manner between 60 km/h and 90 km/h. This situation also featured oncoming traffic, forcing the subject to stay in the right-hand driving lane. The speed of the oncoming cars was 90 km/h, but they appeared randomly at irregular time intervals. Their lateral posi-tion also varied, but they all stayed in the opposing driving lane at all times – the distance between the left wheel and the centre of the road varied between 0.5 m and 2.0 m. The visibility distance in this situation was reduced to 50 m by fog.
On the other two test routes, there was no other traffic and no reduction in visibility distance.
10 VTI rapport 461A
2.4
Displays and presented information
The peripheral visual information was presented on four identical displays. Each had a total of nine yellow light emitting diodes, which were mounted in the shape of a cross consisting of five horizontal and five vertical diodes. Each display covered an area of 3.5° x 3.5° of the peripheral visual field.
The four displays were mounted in four different positions, to the left, to the right, upper, and lower (Figures 1, 2). The angle between the line of sight and each of the four displays was approximately constant for each subject, but varied across subjects from 11° to 22°, with 18° as an average. The inconsistency of the angle was due to differences in the subjects’ length and position in the driving sea. The average distance from the eye of the driver to the upper and lower displays was approximately 58 cm.
The information on each of the four displays was presented by a “running light” moving in four different directions (upwards, downwards, to the left, or to the right) (Figures 1, 2). The running light was created by the sequential lighting up of the vertical or horizontal diodes. The lighting duration of each diode was 150 ms. After the last diode in the sequence had been switched off, a period of 400 ms elapsed before the next “light wave” started. The running light stimulus was presented 64 times during the test session, distributed evenly between the four directions of motion, the four display positions, and the two demand condi-tions (see Chapter 2.6 Experimental design).
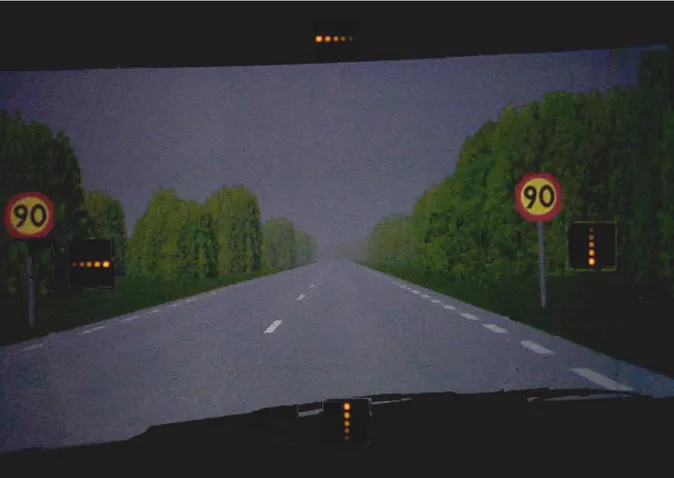
Figure 1 Locations of the four displays for peripheral presentation of
informa-tion to the driver, showing the four direcinforma-tions of moinforma-tion in the low demand con-dition. During the experiment, the information was presented on only one display at a time.
12 VTI rapport 461A
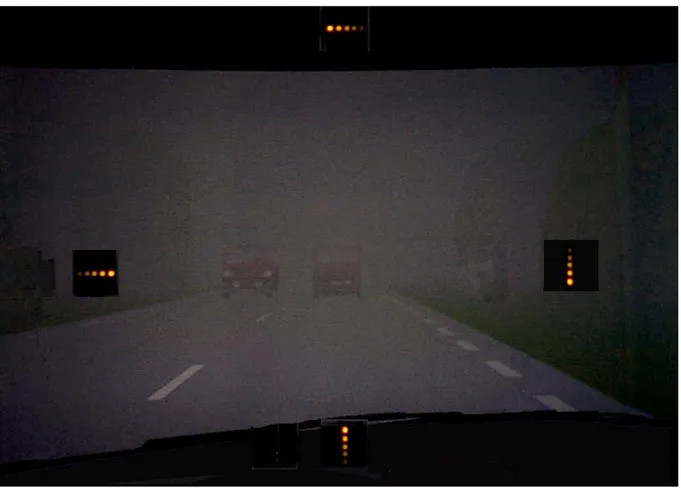
Figure 2 Locations of the four displays for peripheral presentation of
informa-tion to the driver, showing the four direcinforma-tions of moinforma-tion in the high demand con-dition. During the experiment, the information was presented on only one display at a time.
2.5 Driving
task
The subject was instructed to perform the following: • Drive as in real traffic.
• Comply with the posted speed limit (90 km/h).
• When there was another car ahead, follow it without losing sight of it. Do not collide with the leading car, and do not overtake it.
• Report the direction of the moving stimulus presented on the displays (up-wards, down(up-wards, to the right, or to the left) by pressing the correct response button on the steering wheel as quickly as possible
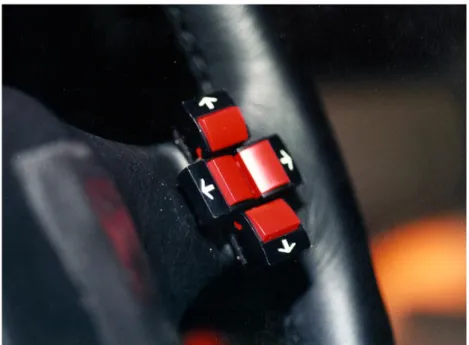
Four response buttons were mounted in the form of a cradle on the right side of the steering wheel (Figure 3). The subject placed his/her right thumb in the cradle and could easily respond to the presented information without having to change grip on the wheel or look at the response buttons. Unless the driver responded within five seconds, the stimulus was turned off and a missed response was registered.
Figure 3 The four response buttons mounted on the steering wheel
When the stimulus moved to the right, the correct response was to press the right-hand button, and, analogously, when it moved to the left, upwards or downwards, the correct response was to press the left-hand, upper, or lower button, respec-tively.
2.6 Experimental
design
There were three independent variables in the study: two levels of demand from the driving task, four display positions, and four directions of motion of the stimu-lus. All subjects were exposed to all combinations of the three independent vari-ables during the 80 km test drive. The design was consequently a 2 x 4 x 4 fac-torial within-groups design. Each combination of demand x display position was presented eight times for each subject, twice for each direction of motion of the stimulus (Table 1). Consequently, each subject received 64 stimulus presentations.
14 VTI rapport 461A
Table 1 Experimental design. Figures in parenthesis refer to number of
presen-tations
High demand (32) Low demand (32)
Display position Upper (8) Display position Lower (8) Display position Right (8) Display position Left (8) Display position Upper (8) Display position Lower (8) Display position Right (8) Display position Left (8) Upwards (2) Downwards (2) To the left (2) To the right (2) Upwards (2) Downwards (2) To the left (2) To the right (2) Upwards (2) Downwards (2) To the left (2) To the right (2) Upwards (2) Downwards (2) To the left (2) To the right (2) Upwards (2) Downwards (2) To the left (2) To the right (2) Upwards (2) Downwards (2) To the left (2) To the right (2) Upwards (2) Downwards (2) To the left (2) To the right (2) Upwards (2) Downwards (2) To the left (2) To the right (2)
Effects of presentation order were controlled through incomplete counter-balancing (McGuigan, 1968). Sixteen different randomised orders of stimulus pre-sentation were used; one male and one female subject were exposed to each order (Appendix 1).
Four different randomised combinations of display position and direction of motion were combined with the two demand conditions in such a way that every combination appeared once and only once on each of the four 20 km test routes (two Latin square designs combined; see Appendix 1 and 2).
2.7
Eye movement recording
In order to determine whether the subjects fixated the stimulus or not, eye move-ments were recorded with an NAC 600 eye movement recorder (Kielgast, 1994). The equipment uses a cornea reflex system to measure the movement of the eye-ball in the horizontal and vertical directions.
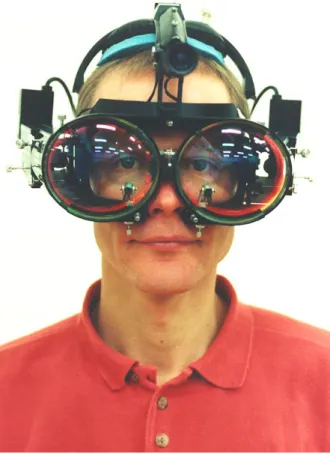
By using infra red light reflected on the cornea, movements of the eyeball are registered with an accuracy of ±0.17° and a frequency of 30 Hz. Synchronous with the registration of eye movements, the surroundings ahead are recorded with a video camera mounted on the headset. The apparatus is shown in Figure 4.
The coordinates representing the direction of gaze are linked to the video recor-dings. The resulting video film tape shows the surroundings from the perspective of the subject. The recordings were analysed manually frame by frame to judge whether the subject had acquired the information via foveal or peripheral vision – i.e. to determine whether they had fixated the stimulus or not.
Figure 4 The NAC 600 eye movement recorder mounted on the subject’s head.
2.8 Dependent
variables
Fixations
The number of fixations of the moving stimulus was calculated.
Correct identifications
The number of correct identifications of the direction of motion of the stimulus, indicated by the subject pressing the correct response button, was calculated.
Response time
The response time from the onset of the moving stimulus until the subject respon-ded by pressing one of the response buttons was measured in ms. The error of measurement was ±10 ms.
Self-reported workload
After completing each of the four test routes, the subject filled in two rating scales of mental workload, NASA-RTLX, and RSMI.
NASA-RTLX (Byers, Bittner & Hill, 1989) - a method of measuring six factors
of subjectively estimated workload; mental demand, physical demand, time pres-sure, performance, effort and frustration level. For each factor, the subject rated (on a scale from 0 to 100) the workload during the preceding 20 km simulator run.
RSMI (Rating Scale Mental Effort) (Zijlstra & Van Doorn, 1985) – a
16 VTI rapport 461A
mental effort. The subject was asked to rate the mental effort during the preceding 20 km simulator run.
2.9 Data
analysis
The effects of driving task demand, display position, and direction of motion of the stimulus on fixation of the moving stimulus, correct identification of the direc-tion of modirec-tion of the stimulus, and response times were analysed. For self-repor-ted workload, only effects of driving task demand were analysed.
Fixations and correct identifications were analysed with the non-parametric Friedman two-way analysis of variance by ranks or – when comparing only two conditions – the Wilcoxon signed ranks test (Siegel & Castellan, Jr, 1988). Sepa-rate analyses were also performed for the two demand conditions. Post-hoc tests (Wilcoxon signed ranks test) were performed when significant effects of display position appeared. In these follow-up tests, the critical significance level was ad-justed as recommended by Kirk (1968); α was divided evenly among the different comparisons.
Self-reported workload was analysed by the Wilcoxon signed ranks test. Response times for correct identifications were analysed by variance analysis. Post-hoc tests (Tukey) were performed when significant main effects appeared.
Paired t-tests were used for comparing the proportion of – and response times to – correct identification of the direction of motion of the peripheral stimuli when the stimuli were fixated and when they were not.
The basic level of significance was 5% in all cases.
2.10 Procedure
After arriving at VTI, the subject first read the written instructions, after which the test leader gave the instructions orally. Specifically, the subject was instructed to respond to the peripheral moving stimuli correctly and as quickly as possible, to follow the leading car and not collide with it or lose sight of it, to keep the posted speed limit, and to drive as in real traffic.
After this, the headset of the eye movement recorder was mounted on the head of the subject. The equipment was calibrated with the subject sitting in the driving simulator. The system for stimulus presentation was demonstrated and the test leader instructed the subject on how to respond to the presented information.
The subject drove a 10 km pre-test route to get used to the driving simulator and the different tasks of the study before starting the test.
The test session then followed. The subject had a break and left the driving simulator after driving the first 20 km. The headset was removed for reasons of comfort. Before driving the next 20 km of the test road, the headset was mounted and calibrated again. The subject had another two such breaks after driving 40 and 60 km respectively.
After each of the four 20 km test routes, the subject also filled in the NASA-RTLX and RSMI forms. At the end of the test session, the subject was remunera-ted for his/her participation.
3 Results
3.1
Fixations of peripheral moving stimulus
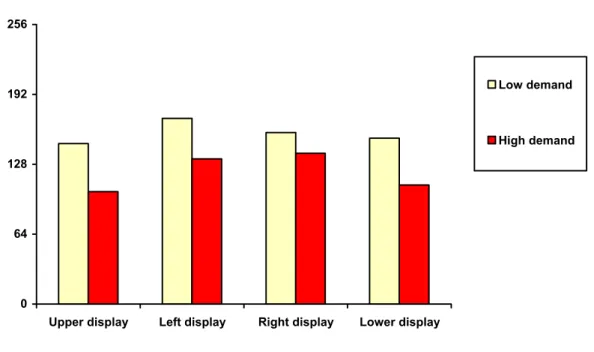
Figure 5 shows the average number of fixations of the peripheral moving stimuli for the four display positions in the low and high demand conditions. The maxi-mal average number of fixations possible in each of the eight situations was 256. As the figure shows, there were many fixations in all conditions – the average number varied between 103 (40.2%) for presentations on the upper display under high driving task demands and 170 (66.4%) for presentations on the left display under low driving task demands. When including directions of motion, the average number of fixations and proportions in the 32 different combinations of experimental variations is presented in Appendix 3.
0 64 128 192 256
Upper display Left display Right display Lower display Number of fixations
Low demand High demand
Figure 5 Average number of fixations of peripheral moving stimulus.
The average number of fixations was greater with low driving task demands than with high demands; 626 (61.1%) compared to 483 (47.2%), a significant diffe-rence (Wilcoxon signed ranks test: z=4.26; p<0.001).
There were also differences between display positions. Presentation of information on the left display resulted in the highest average number of fixations, 303 (59.2%), followed by the right one, 295 (57.6%), the lower one, 261 (51.0%) and the upper one, 250 (48.8%). The difference was significant (Friedman two-way analysis of variance by ranks: (χ2(3)=19.69; p<0.001). Pairwise comparisons
(Wilcoxon signed ranks test) show that only two comparisons were significant at the required level of significance (p<0.05/6 = 0.0088); the average number of fixations on the upper display differed from the number of fixations on both the left (z=3.27; p<0.001) and the right display (z=2.73; p<0.01).
Effects of display position were also analysed in the two demand conditions separately. There was no significant difference under low driving task demands at
18 VTI rapport 461A
the required level of significance (p<0.025) [Friedman two-way analysis of vari-ance by ranks: χ2(3)=7.89; p>0.025]. Under high driving task demands, there was,
however, an effect of display position [χ2(3)=17.20; p<0.001]. Pairwise
compa-risons (Wilcoxon signed ranks test) gave the result that only one comparison turned out to be significant at the required level of significance (p<0.025/6=0.004), the average number of fixations on the upper display differed from the number of fixations on the right display (40.2% and 53.9% respectively).
Regarding effects of the direction of motion of the stimulus (Appendix 3), the highest average number of fixations was found when the stimulus moved to the right, 287 (56.1%), followed by the stimulus moving to the left, 286 (55.9%), moving downwards, 270 (52.7%), and moving upwards, 266 (52.0%). The diffe-rence was, however, not significant [Friedman two-way analysis of variance by ranks: χ2(3)=3.98; p>0.05].
Effects of the direction of motion of the stimulus were also analysed in the two demand conditions separately. There was no significant difference under either low driving task demands [Friedman two-way analysis of variance by ranks: χ2(3)=2.72; p>0.025], or high driving task demands [Friedman two-way analysis
of variance by ranks: χ2(3)=6.61; p>0.025].
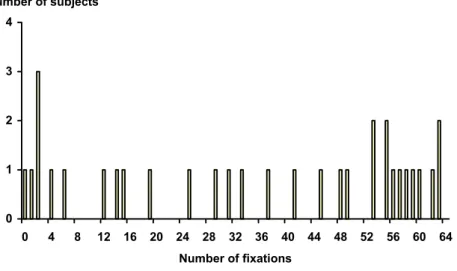
The distribution of fixations across subjects is shown in Figure 6. One subject never fixated the moving stimulus, whereas another subject fixated 63 out of the 64 stimuli presented. The variation between subjects was very large.
0 1 2 3 4 0 4 8 12 16 20 24 28 32 36 40 44 48 52 56 60 64 Number of fixations Number of subjects
Figure 6 Number of subjects with different number of fixations of peripheral
moving stimulus
3.2
Correct identifications of direction of motion of
peri-pheral stimulus
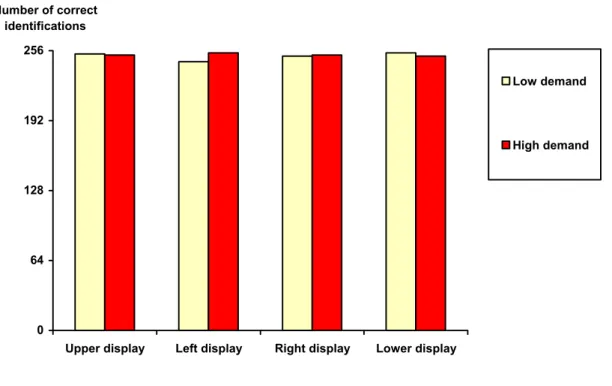
Figure 6 shows the average number of correct identifications of the direction of motion of the peripheral stimuli for the four display positions in the low and high demand conditions. The maximal average number of correct identifications possible in each of the eight conditions was 256. As the figure shows, the average number of correct identifications was very large in all conditions – varying
between 246 (96.1%) for presentations on the left display under low driving task demands and 254 (99.2%) for presentations on the left display under high driving task demands and for presentations on the lower display under low driving task demands. When including direction of motion, the average number and propor-tions of correct identificapropor-tions in the 32 different combinapropor-tions of experimental variations are as shown in Appendix 4.
0 64 128 192 256
Upper display Left display Right display Lower display Number of correct
identifications
Low demand High demand
Figure 6 Average number of correct identifications of direction of motion of
peri-pheral stimulus
The average number of correct identifications was 1009 (98.5%) under high driving task demands and 1004 (97.3%) under low driving task demands, a non-significant difference (Wilcoxon signed ranks test: z=1.39; p>0.05).
With respect to display position, the average number of correct identifications was 505 (98.6%) for the upper display, 500 (97.7%) for the left display, 503 (98.2%) for the right display, and 505 (98.6%) for the lower display, a non-signi-ficant difference [Friedman two-way analysis of variance by ranks: χ2(3)=2.58;
p>0.05].
Effects of display position were also analysed in the two demand conditions separately. There was no significant difference under low driving task demands at the required level of significance [Friedman two-way analysis of variance by ranks: χ2(3)=6.77; p>0.025]. Similarly, there was no difference between display
positions under high driving task demands [Friedman two-way analysis of vari-ance by ranks: χ2(3)=0.95; p>0.025].
Regarding effects of the direction of motion of the stimulus (Appendix 4), the highest average number of correct identifications was found when the stimulus moved to the right, 507 (99.0%), followed by the stimulus moving to the left, 504 (98.4%), moving downwards, 504 (98.4%), and moving upwards, 498 (97.3%).
20 VTI rapport 461A
The difference was, however, not significant [Friedman two-way analysis of vari-ance by ranks: χ2(3)=1.62; p>0.05].
Effects of the direction of motion of the stimulus were also analysed in the two demand conditions separately. There was no significant difference under either low or high driving task demands, [Friedman two-way analysis of variance by ranks: χ2(3)=2.14; p>0.025], and [Friedman two-way analysis of variance by
ranks: χ2(3)=1.58; p>0.025], respectively.
Identification errors
In all, 35 of the 2048 stimuli were identified incorrectly. Four of these errors were caused by malfunction of the apparatus. The remaining 31 human errors are pre-sented in detail in Appendix 5.
Eighteen identification errors appeared under low driving task demands and thirteen under high driving task demands. The left display had twelve identifica-tion errors, the lower one had five, and the other two displays had seven identi-fication errors each.
3.3
Correct identifications of direction of motion of
peri-pheral stimulus with respect to fixation of the
sti-mulus
Table 2 shows the number and proportion of correct and incorrect identifications of the direction of motion of the peripheral stimulus when the stimulus was fixated and when it was not fixated.
Table 2 Number and proportion of correct identifications of direction of motion
of the peripheral stimulus with respect to fixation of the stimulus
Correct identification Incorrect identification
Stimulus fixated 1092 (98.5 %) 17 (1.5 %)
Stimulus not fixated 918 (98.5 %) 14 (1.5 %)
The proportion of correct identifications was very high, and identical, regardless of whether or not the subject fixated the stimulus.
3.4
Response time for correct identification of direction
of motion of peripheral stimulus
Only response times for correct identification were analysed.
There were a total of seven missed responses (no response within 5 s.) in the whole experiment, four of which resulted from malfunction of the apparatus. In these cases, the missed response time was replaced by the response time obtained in the other measurement for the same combination of experimental variations (demand x display position x direction of motion). The same procedure was app-lied in the case of response times to incorrect responses.
For one subject, both responses for one combination of demand x display posi-tion x direcposi-tion of moposi-tion were incorrect. In this case, the missing value was esti-mated by using the average value of the individual’s other correct responses for the demand x display position combination where the missing values appeared.
The results for the four displays in the low and the high demand conditions are shown in Figure 6. When including direction of motion, the average response time in the 32 different combinations of experimental variations is as shown in Appen-dix 6. 0 0,25 0,5 0,75 1 1,25 1,5 1,75 2
Upper display Left display Right display Lower display RT (s)
Low demand High demand
Figure 6 Average response time for correct identification of direction of motion
of peripheral stimulus
22 VTI rapport 461A
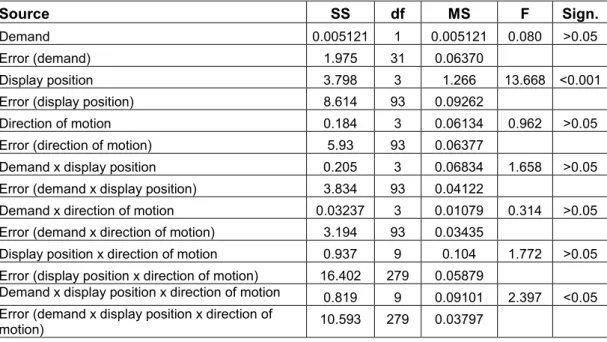
Table 3 Variance analysis of response time for correct identification of direction
of motion of peripheral stimulus
Source SS df MS F Sign.
Demand 0.005121 1 0.005121 0.080 >0.05
Error (demand) 1.975 31 0.06370
Display position 3.798 3 1.266 13.668 <0.001 Error (display position) 8.614 93 0.09262
Direction of motion 0.184 3 0.06134 0.962 >0.05 Error (direction of motion) 5.93 93 0.06377
Demand x display position 0.205 3 0.06834 1.658 >0.05 Error (demand x display position) 3.834 93 0.04122
Demand x direction of motion 0.03237 3 0.01079 0.314 >0.05 Error (demand x direction of motion) 3.194 93 0.03435
Display position x direction of motion 0.937 9 0.104 1.772 >0.05 Error (display position x direction of motion) 16.402 279 0.05879
Demand x display position x direction of motion 0.819 9 0.09101 2.397 <0.05 Error (demand x display position x direction of
motion) 10.593 279 0.03797
As the table shows, there were differences in response time between display posi-tions and a triple interaction (demand x display position x direction of motion).
Regarding the effect of display position, the response time was shortest for the right (1.07 s.) and the lower display (1.08 s.), but longer for the upper (1.19 s.) and the left display (1.20 s.). Pairwise comparisons confirm these differences (Table 4).
Where effects on response time were found, the magnitude of the effect was calculated using omega2 (ω2). For the display factor, the result was ω2 = 0.0625,
which, according to Keppel (1982), represents a “medium” effect. As to the triple interaction, a much smaller value was obtained; ω2 = 0 .0085, which means that
less than 1% of the total variance in response times was explained by this inter-action. This was regarded as an effect with little importance and was not investi-gated further.
Table 4 Response times: Pairwise comparisons for display position (Tukey)
Comparison between displays q value Sign.
Upper vs left q = 0.47 n.s.
Upper vs right q = 6.35 sign.
Upper vs lower q = 5.89 sign.
Left vs right q = 6.82 sign.
Left vs lower q = 6.36 sign.
3.5
Response time for correct identification of direction
of motion of peripheral stimulus with respect to
fixa-tion of the stimulus
Table 5 shows the response times for correct identification of the direction of mo-tion of the peripheral stimulus when the stimulus was fixated compared to when the stimulus was not fixated.
Table 5 Response time for correct identification of direction of motion of
peri-pheral stimulus with respect to fixation of the stimulus
Response time for correct identification
Stimulus fixated 1.17 s
Stimulus not fixated 1.08 s
As the table shows, the response times were somewhat longer when the drivers fixated the stimulus than when they did not. A paired t-test performed on the response times for fixations and non-fixations gives a significant difference [t63=4.86; p<0.001].
3.6 Self-reported
workload
Table 6 shows the average subjective ratings of mental workload. There was a sig-nificant difference between the high and the low demand conditions for all six factors involved in the NASA-RTLX questionnaire. Also, mental effort was rated higher in the high demand condition than in the low demand condition in the RSMI questionnaire.
It can be concluded that subjective mental workload was higher under high dri-ving task demands than under low dridri-ving task demands.
Table 6 Self-reported mental workload
Instrument Scale Low demand High demand Wilcoxon signed ranks test: z value Sign. Mental demand 25 44 4.23 <0.001 Physical demand 23 36 3.69 <0.001 Time pressure 12 22 3.39 <0.001 Performance 73 65 2.24 <0.05 Effort 29 49 4.01 <0.001 NASA-RTLX Frustration level 20 44 4.40 <0.001
24 VTI rapport 461A
4 Discussion
Regarding fixation of the peripherally presented moving stimulus, more than 50% of the stimulus presentations were fixated by the subjects. The traffic situation with greater demands on the driver – imposing increased mental workload accor-ding to subjective ratings - caused the subjects to fixate the peripherally presented stimulus to a lesser extent than when the driving task was less demanding. This finding was expected and is completely in line with previous studies (Ikeda & Takeuchi, 1975; Williams, 1982, 1985; Miura, 1985).
There were also differences between display positions. The number of fixations was smaller for the upper display than for the left and the right ones. When com-paring display positions in the two different demand conditions, a difference appeared only under high driving task demands; the number of fixations was smaller for the upper display than for the right display. However, no effects of the direction of motion of the stimulus were found.
There were very few errors regarding identification of the direction of motion of the stimulus with no effects of the different independent variables, a result that is in close accordance with the results obtained by Nilsson, Falkmer & Samuelsson (1998), who also found very high response accuracy, with no differences between driving conditions or display positions, for moving peripheral stimuli. It did not appear significant whether the stimulus had been fixated or not; the correct response rate was the same in both situations.
For response time, there was an effect of display position – a result that was not expected. The effect was of moderate size. The response time was shortest for the right display (1.07 s.) and for the lower display (1.08 s.), but longer for the upper (1.19 s.) and the left display (1.20 s.).
The differences in response time between display positions may be explained by differences in angle between the actual line of sight and the display positions. Even though the angle between the line of sight and the four displays was app-roximately the same when measured before the test drive in the stationary simulator car, the actual line of sight may very well have varied in a way that resulted in differences in angle between the actual line of sight and the four displays. It is well documented that drivers’ visual search pattern are more con-centrated on the right side of the road and its immediate road surroundings than the left side of the road and its surroundings (Evans, 1991), which may have caused angular differences of sufficient magnitude for the effects to appear. Regarding the other two independent variables, i.e. driving task demands and direction of motion of the stimulus, there was only a triple interaction – driving task demand x display position x direction of motion – of very small size. Finally, the response times were somewhat longer when the stimuli were fixated than when they were not.
What conclusions can be drawn from the present findings?
Firstly, the information system tested – which requires the driver to determine the motion of the peripheral stimulus moving in one of four different directions – appears to have worked satisfactorily. There were very few erroneous responses, irrespective of the driving task demands, display position, or direction of motion of the stimulus. The response times were also, generally, quite short. Hence, it appears that in-car information presented by peripheral moving stimuli can be acquired in a satisfactory way.
Secondly, satisfactory information acquisition does not appear to require the driver to fixate the peripheral stimulus – information acquisition seems to work just as well when the driver relies only on peripheral vision for acquiring the presented information.
Thirdly, the direction of motion of the peripheral stimulus seems to have no relevance with respect to information acquisition. Each direction works just as well as any other.
Fourthly, the differences in response times between display positions may be of some importance for recommendations on where in the car the information should be presented. In the absence of data on driving behaviour or performance, it seems wise to recommend positions where short response times in combination with a small number of fixations are found. It would appear positive from a safety point of view that the driver pays as much foveal attention as possible to the traffic situation ahead rather than to the in-car information system. The lower display position, i.e. at the top of the dashboard, may therefore appear to be a good re-commendation for positioning the display presenting the peripheral moving stimulus. Another fact also speaks in favour of the lower position as being the most favourable one; in comparison with the right position (which also gave short response times) it does not interfere in any way with the requirement on unrest-ricted vision through the windshield.
It may be concluded that information presented peripherally in the field of vi-sion by moving stimuli can be acquired in a satisfactory way without fixation of the stimuli. An information system using this method of presenting information appears promising. The method of presenting information used in the present study – peripherally with a moving stimulus – could thus be seen as an alternative way of providing in-car information to the driver when designing a route guidance system, for example.
It may be discussed whether the results of the present study can be generalised to real car driving. The few validation studies that have been performed with the VTI driving simulator, summarised by Törnros, Harms & Alm (1997), show good correspondence between driving in the driving simulator and driving in a real car on a real road regarding effects of different independent variables on basic driving behaviour, such as driving speed and lateral position. Even so, it should be men-tioned that one factor of importance, the ambient light conditions, were quite different from those often appearing in real car driving. The ambient light condi-tions were constant during the driving session, and could be characterised as those of dusk or dawn. In real driving, on the other hand, the ambient light conditions naturally vary from darkness to bright sunshine. In the latter situation, the driver will most probably experience problems of detecting and discriminating the pre-sented information. These problems need to be addressed if systems of the type studied, relying exclusively on visual information, are expected to function well under widely different ambient light conditions.
26 VTI rapport 461A
5 References
Alm H & Berlin M: Fältstudie av användaracceptans: Personbil utrustad med
VISOR. Swedish Road Administration, Borlänge, 1997.
Byers, JC & Bittner, Jr. AC & Hill, SG: Traditional and raw task load index
(TLX) correlations: are paired comparisons necessary? Advances in
Indu-strial Ergonomics and Safety I. Taylor & Francis, London, 1989.
Evans, L: Traffic safety and the driver. Van Nostrand Reinhold, New York, 1991.
Ikeda, M & Takeuchi, T: Influence of foveal load on the functional visual field. Perception & Psychophysics, 18, pp. 255-260, 1975.
Keppel, G: Design & Analysis. A researcher’s handbook. Second edition. Prentice-Hall International, Inc., London, 1982.
Kielgast, K: Report on the validity of the NAC-600. An analysis of data and
fixation generation during car-driving. University of Copenhagen,
Copenhagen, 1994.
Kirk, RE: Experimental design: procedures for the behavioral sciences. Brooks/Cole publishing Company, Belmont, California, 1968.
Leibowitz, HW: Recent advances in our understanding of peripheral vision
and some implications. Proceedings of the 30th Annual Meeting of the Human Factors and Ergonomics Society, October 11-15, Seattle, Washington, USA, pp. 612-616, 1986.
McGuigan, FJ: Experimental psychology. A methodological approach. Second edition. Prentice-Hall International , Inc., London, 1968.
Miura, T: Behaviour oriented vision: Functional field of view and processing
resources. In Eye movements from physiology to cognition. Elsevier Science
Publisher B.V., Dourdan, France, 1985.
Nilsson, L: Behavioural Research in an Advanced Driving Simulator –
Expe-riences of the VTI System. In Proceedings of 37th Annual Meeting of the
Human Factors and Ergonomics Society. Seattle, Washington, USA, VTI sär-tryck 197, Swedish Road and Transport Research Institute, Linköping, 1993. Nilsson, L & Falkmer, T & Samuelsson, S: Möjligheterna att under bilkörning
inhämta information med det perifera seendet. En simulatorstudie. VTI
rapport 428. Swedish Road and Transport Research Institute, Linköping, 1998 Nilsson, L & Falkmer, T & Samuelsson, S: Drivers’ ability to acquire car
in-formation presented in the peripheral field of view without fixating – a si-mulator study. Reprint from Proceedings of Vision in Vehicles – VII, 2000,
Marseille, France, September, 1997, pp. 83-91. VTI särtryck 337. Swedish National Road and Transport Research Institute, Linköping, 2000.
Nordmark, S: The VTI driving simulator - Trends and experiences. Paper pre-sented at the Conference on Road Safety and Traffic Environment in Europe, Gothenburg, 1990.
Nordmark, S & Jansson, H & Lidström, M & Palmqvist, G: A moving base
dri-ving simulator with wide angle visual system. VTI särtryck 106A, Swedish
Road and Traffic Research Institute, Linköping, 1986.
Samuelsson, S & Nilsson, L: Om möjligheterna att upptäcka och identifiera
perifert presenterad information i bilen. VTI rapport 412, Swedish Road and
Siegel, S & Castellan, Jr NJ: Nonparametric statistics for the behavioral
sciences. Second edition. McGraw-Hill, Inc., New York, 1988.
Törnros, J & Harms, L & Alm, H: The VTI Driving Simulator - Validation
stu-dies. DSC 97 – Driving Simulation Conference, Lyon, France, September 8-9,
1997. VTI särtryck 279, 1997.
Williams. LJ: Tunnel vision induced by foveal load manipulation. Human Fac-tors, 27, pp. 221-227, 1985.
Williams, LJ: Cognitive load and the functional fields of view. Human Factors, 24, pp. 683-692, 1982.
Zijlstra, FRH & Van Doorn, L: The construction of a scale to measure
percei-ved effort. Department of Philosophy and Social Sciences, Delft University of
Appendix 1 Page 1 (1)
Random orders
Subject 0 – 2,000 m 2,000 – 4,000 m 4,000 – 6,000 m 6,000 - 8,000 m 1, 17 A 1 B 2 C 3 D 4 2, 18 B 2 C 3 D 4 A 1 3, 19 C 3 D 4 A 1 B 2 4, 20 D 4 A 1 B 2 C 3 5, 21 A 2 B 3 C 4 D 1 6, 22 B 3 C 4 D 1 A 2 7, 23 C 4 D 1 A 2 B 3 8, 24 D 1 A 2 B 3 C 4 9, 25 A 3 B 4 C 1 D 2 10, 26 B 4 C 1 D 2 A 3 11, 27 C 1 D 2 A 3 B 4 12, 28 D 2 A 3 B 4 C 1 13, 29 A 4 B 1 C 2 D 3 14, 30 B 1 C 2 D 3 A 4 15, 31 C 2 D 3 A 4 B 1 16, 32 D 3 A 4 B 1 C 2Subjects 1 – 16: men Subjects 17 – 32: women
A – D: Road stretches of 20 km each A, B: No other traffic, good visibility C, D: Other traffic, reduced visibility
1 – 4: Random orders for combinations of display position and direction of motion of the stimulus according to Appendix 2
Appendix 2
Page 1 (1)
Random orders for combinations of display
posi-tion and direcposi-tion of moposi-tion of stimulus
1*: D1L D3U D2R D1R D4D D3L D4R D2L D1U D2D D3D D4U D3R D1D D2U D4L 2*: D3U D1D D4R D3L D4U D2L D1L D2R D2U D4D D3R D1U D2D D4L D1R D3D 3*: D4U D3R D1L D2D D1R D2L D3U D4D D3L D1U D2R D4R D1D D3D D2U D4L 4*: D4R D2U D1U D2L D3R D4L D3D D1R D2D D4D D1D D3U D2R D1L D4U D3L D1 = upper display D2 = left display D3 = right display D4 = lower display
L = running light to the left R = running light to the right U = running light upwards D = running light downwards
The way in which D1 – D4 (display positions) and L – D (direction of motion of stimulus) are included in the major random orders is shown in Appendix 1
Appendix 3
Page 1 (1)
Average numbers and proportions of fixations
of stimulus
Condition Upper display Left display Right display Lower display
Low demand, Stimulus motion upwards
34 (53.1%) 41 (64.1%) 37 (57.8%) 35 (54.7%) Low demand, Stimulus
motion downwards
34 (53.1%) 40 (62.5%) 42 (65.6%) 41 (64.1%) Low demand, Stimulus
motion to the left
41 (64.1%) 46 (71.9%) 36 (56.3%) 38 (59.4%) Low demand, Stimulus
motion to the right
38 (59.4%) 43 (67.2%) 42 (65.6%) 38 (59.4%) High demand, Stimulus
motion upwards
26 (40.6%) 32 (50.0%) 33 (51.6%) 28 (43.8%) High demands, Stimulus
motion downwards
20 (31.3%) 33 (51.6%) 35 (54.7%) 25 (39.1%) High demand, Stimulus
motion to the left
28 (43.8%) 36 (56.3%) 34 (53.1%) 27 (42.2%) High demand, Stimulus
motion to the right
Appendix 4
Page 1 (1)
Average numbers and proportions of correct
iden-tifications of direction of motion of stimulus
Condition Upper display Left display Right display Lower display
Low demand, Stimulus motion upwards
61 (95.3%) 60 (93.8%) 63 (98.4%) 64 (100.0%) Low demand, Stimulus
motion downwards
64 (100.0%) 61 (95.3%) 63 (98.4%) 64 (100.0%) Low demand, Stimulus
motion to the left
64 (100.0%) 61 (95.3%) 62 (96.9%) 63 (98.4%) Low demand, Stimulus
motion to the right
64 (100.0%) 64 (100.0%) 63 (98.4%) 63 (98.4%) High demand, Stimulus
motion upwards
63 (98.4%) 64 (100.0%) 62 (96.9%) 61 (95.3%) High demand, Stimulus
motion downwards
63 (98.4%) 63 (98.4%) 64 (100.0%) 62 (96.9%) High demand, Stimulus
motion to the left
62 (96.9%) 64 (100.0%) 64 (100.0%) 64 (100.0%) High demand, Stimulus
motion to the right
Appendix 5
Page 1 (1)
Incorrect identifications of direction of motion of
stimulus
Response Condition
Upper display Left display Right display Lower display
Low demand, Stimulus motion upwards To the left To the left Downwards To the right To the right To the left No response Downwards -
Low demand, Stimulus motion downwards
- Upwards To the left
To the right
To the right -
Low demand, Stimulus motion to the left
- Downwards Downwards To the right Upwards Downwards Downwards
Low demand, Stimulus motion to the right
- - - -
High demand, Stimulus motion upwards
No response - To the right
To the right
To the left To the left To the right High demand, Stimulus
motion downwards
Upwards Upwards - To the right
High demand, Stimulus motion to the left
Upwards No response
- - - High demand, Stimulus
motion to the right
Appendix 6
Page 1 (1)
Average response time (in seconds) for correct
identification of direction of motion of stimulus
Condition Upper display Left display Right display Lower display
Low demand, Stimulus
motion upwards 1.19 1.23 1.08 1.10
Low demand, Stimulus motion downwards
1.17 1.18 1.10 1.10 Low demand, Stimulus
motion to the left
1.21 1.18 1.01 1.08 Low demand, Stimulus
motion to the right
1.28 1.15 1.11 1.00 High demand, Stimulus
motion upwards
1.13 1.23 1.10 1.09 High demand, Stimulus
motion downwards
1.11 1.30 1.07 1.09 High demand, Stimulus
motion to the left
1.23 1.15 1.04 1.00 High demand, Stimulus
motion to the right