, VTInotat
No: TF SS IOA Date: 1988 10-31
Title: CONTROL OF VALIDITY AND RELIABILITY OF STRAY LIGHT LUMINANCE MEASUREMENTS IN WINDSCREENS
Authors: Sven Olaf Lundkvist, Uno Ytterbom & Gabriel Helmers
Division: Road User and Vehicle Project no: 553 19-8
Project title: Windscreens, stage I and II Sponsor: Pilkington
Distribution: free/restréeteé/
Swedish Road and Traffic Research Institute
(db
'
Statens vé'g- och trafikinstitut
t7. Pa: 58707 Linké'ping. 729/. 073- 77 52 00. Telex 50725 VT/SG/ S I Beso'k: Olaus Magnus V59 37, Llhkdping
Road User and Vehicle Division 1988-10-25
S-O Lundkvist U Ytterbom
G Helmers
CONTROL OF VALIDITY AND RELIABILITY OF STRAY LIGHT LUHINANCE MEASUREMENTS IN VINDSCREENS
Background
Reliability and validity are two main concepts related to each method of measurement. These concepts can be defined as follows: Reliability: The reliability of a measurement method is the
pro-duct moment correlation (rxy) between pairs of independent mea
surements of the same stable objects carried out by the same method. The reliability is high when the correlation between pairs of independent measurement values is high. Reliability is therefore a measure of precision or freedom of random errors. The reliability is designed p below.
Validity: The validity of a measurement method is high if it
measures that which is intended to be measured.
For example, there is a method for the measurement of stray-light in windscreens. If repeated measurements of the same wind screen give identical measurement values, the reliability is at
a maximum (rxy=1.00). However, we are not primarily interested
in stray light but in reductions of driver visibility caused by worn windscreens. The validity of the method is in this situa-tion expressed by the correlasitua-tion between the stray-light values of a windscreens and the reduction of visibility for drivers looking through these windscreens.
If the method of measuring stray-light of windscreens produces values, which well predict the reduction of driver visibility
2
(within small limits of confidence) the method has high validity in this respect. The immediate consequence in this case would be that the physical methodof measuring stray light in windscreens should replace direct and considerably more expensive methods of measuring driver visibility in relevant traffic situations. Measurements of stray-light luminance in windscreens
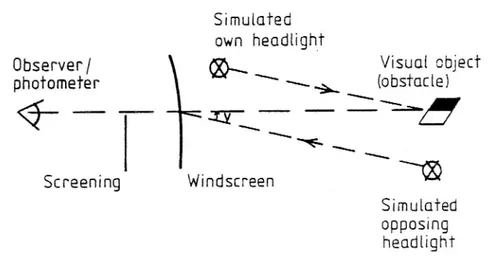
Reductions of target contrasts caused by stray-light in worn windscreens have been measured according to the method described in VTI-notat TF 55 O6A. The angle of incidence of the beam to-wards the windscreen and the size of the measurement area at the windscreen have been adjusted to be in accordance with those of
the Timmermann instrument in Figure 1.
Simulated own headhght
Observer/
Q
Visual object
photometer \ -\$k (obstacle) \
\_)-<5
4! \
\ $ \ \ Screening Windscreen \® SimLMated opposing headhghtFigure 1. The laboratory set up for measurements of contrast
reductions in windscreens. The measurement area at
the windscreen was a circle with a diameter of 35 mm. The angle of incidence (v) was 1.75°.
Measurements by the laboratory method above have been compared with measurements (through the same spots of a number of wind screens) with the Timmermann instrument. If there is a very high correlation (rxy) between the measurement values of these two methods they are measuring the same property.
The relation between these two physical measures on the one hand and the sight distance measurements on the other will show how well these physical measurements can predict driver detectabili-ty of targets in vehicle lighting. These correlations (rxy) will show the validity of the two physical measurement methods under
consideration.
The reliability of the Timmermann instrument as well as of the laboratory contrast measurement method in Figure 1 has been studied. Measurements have been carried out by both methods in five spots (5) on each of six windscreens (x6) in different sta tes of wear. These measurements have been repeated once (x2
rounds) which makes a total of 60 measurement values for each method.
Measurement results - reliability
The results of these 60 measurements from the two methods are
shown in Table 1. For the laboratory method the contrast of the visual target was calculated according to the formula:
C = (Lo - Lb)/Lb
The comparative values used for the Timmermann instrument were
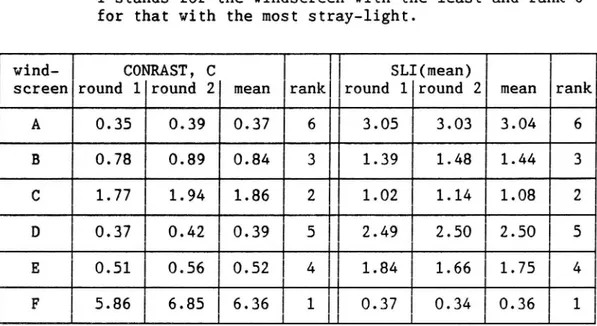
Table 1. Mean values of the contrast, C, and the SLI(mean) for six windscreens. The measurements have been carried out in five spots on each windsCreen. All measure ments have been repeated once. The rank orders of the windscreens below is based on all measurements. Rank 1 stands for the windscreen with the least and rank 6 for that with the most stray light.
wind- CONRAST, C SLI(mean)
screen round 1 round 2 mean rank round 1 round 2 mean rank A 0.35 0.39 0.37 6 3.05 3.03 3.04 6 B 0.78 0.89 0.84 3 1.39 1.48 1.44 3 C 1.77 1.94 1.86 2 1.02 1.14 1.08 2 D 0.37 0.42 0.39 5 2.49 2.50 2.50 5 E 0.51 0.56 0.52 4 1.84 1.66 1.75 4 F 5.86 6.85 6.36 1 0.37 0.34 0.36 1
The reliability of the contrast measurements (C) is very high,
p= 0.999. There are, however, systematic differences between the measurement values from the first measurement round compared to those of the second. Somewhat higher measurement values were systematically obtained when the measurements were repeated (p< .05). This difference is probably an effect of a small inevita ble difference in the angle of incidence between the first and the second laboratory measurement set-up.
The Timmermann instrument also obtained a very highreliability, p=0.944. No significant difference was found (p<.05) between the measurement values from the first and the second measurement round. In this case we expect the instrument to keep all
Measurement results validity
The correlation between the two measurement methods was rxy= -O.755 for the first round of measurements and rxy= -O.758 for
the second. So, the relation between the two measurement methods
is relatively strong but not strong enough to make good predic-tions between SLI(mean)- and C-values.
The rank orders of the six windscreens based on these two
methods are identical. So, in this case the rank correlation
is at a maximum (rrank = 1.00).
The crucial question for establishing the validity of these two
measures is: How well are they related to visual distances to
targets on the road detected through windscreens of a large
va-riation in wear.
In VTI rapport 339A a series of such field experiments is repor ted. Among these experiments, Experiment 4 is the most appropri-ate one for estimating these correlations. There are two main reasons for this statement. Firstly, the windscreen factor is varied in more levels (4) than in any other of the experiments. Secondly, 9 subjects participated in Experiment 4 compared to 3 in each of the preceding ones.
The correlations between the SLI(mean) and the C values of the
4 windscreens on the one hand and the mean visibility distances over subjects and target positions (S) on the other have been calculated. Plots of sight distances against SLI(mean) and
C-values show a linear relation between sight distance (m) and
SLI(mean) values, while the relation between sight distance (m) and C values is logarithmic. This means that the calculated re gression equations are:
(I
) II A + B*SLI(mean)
(I
where S is the sight distance and A,B,D,E are constants. The
equations have been calculated for target positions 0 m, 140 m,
280 m and 380 m (longitudinally in front of the stationary
oppo-sing car). The vehicle of the subjects had correctly aimed low beam headlights. The stationary vehicle had low beams aimed 1.5° up. The results are shown in table 2, below.
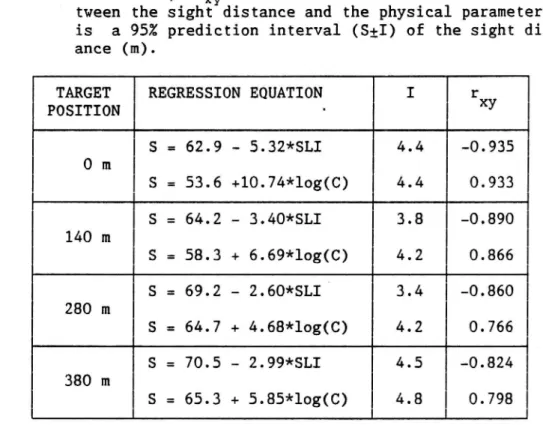
Table 2. Results of the regression analysis. The relation be-tween the sight distance and the two physical
para-meters SLI(mean) and C has been evaluated for 4 target
positions in a typical low beam opposing situation. In
the table, rx is the coefficient of correlation be
tween the sight distance and the physical parameter. I is a 95% prediction interval (SiI) of the sight dist
ance (m).
TARGET REGRESSION EQUATION I rx
POSITION
'
y
S = 62.9 5.32*SLI 4.4 0.935 O m S = 53.6 +10.74*log(C) 4.4 0.933 S = 64.2 3.40*SLI 3.8 -0.890 140 m S = 58.3 + 6.69*log(C) 4.2 0.866 S = 69.2 2.60*SLIT 3.4 0.860 280 m S = 64.7 + 4.68*log(C) 4.2 0.766 S = 70.5 - 2.99*SLI 4.5 -0.824 380 m S = 65.3 + 5.85*log(C) 4.8 0.798The validity of the two physical methods of measurement as ex pressed by the coefficient of correlation above (rxy) is very
high. The size of the rxy-values show that it is possible to
carry out good predictions of visibility distances in a low beam opposing situation.
Conclusions
The two physical methods of measurement which have been compared both have a very high reliability. The intercorrelation is also comparatively high. Considering the size of these correlations (see page 4) the methods cannot be considered to measure exactly the same property.
The validity of both methods is very high. (See Table 2). The consequence of this result is that both methods can be used to evaluate windscreens without making field tests of driver visi
bility. The SLI(mean) values of the Timmermann instrument have
somewhat higher correlation coefficients than the corresponding C values of the laboratory method. These differences between the
coefficients are relatively small but consistent. So, it is
re-latively safe to conclude, that the Timmermann instrument should be used for purposes of evaluation of windscreens. This instru-ment has proved superior to the laboratory method. The main dif-ference between the methods is that the Timmermann instrument can measure windscreens mounted on vehicles in traffic. Conse-quently, the measurement performance of the instrument is much faster and not so expensive compared to the laboratory method.